OPEN-SOURCE SCRIPT
EMA 21/55/200 Market Quality Dashboard
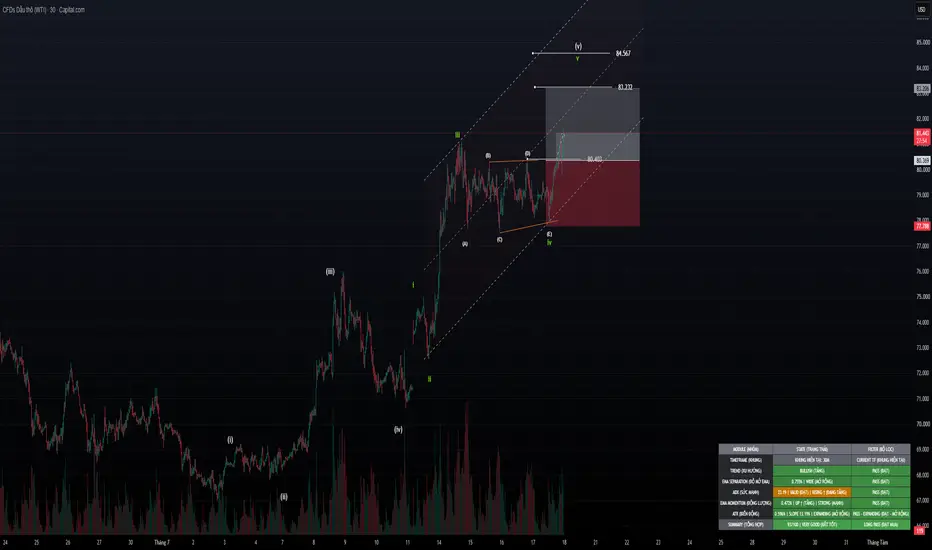
EMA 21/55/200 Market Quality Dashboard
An enhanced evolution of the original DANGHIEU EMA 21/55/200 V2 + ADX ATR Momentum, redesigned as a comprehensive Market Quality Dashboard to evaluate trend quality before trade execution.
Overview
EMA 21/55/200 Market Quality Dashboard is a professional trend-following market filter designed to evaluate overall market quality before traders search for trend-following opportunities.
Rather than generating Buy or Sell signals, this indicator analyzes multiple independent market conditions and presents them in a structured dashboard. Its purpose is to help traders understand why the market is suitable—or unsuitable—for trend trading, allowing for more informed decision-making before execution.
Key Features
Trend identification using EMA 21 / 55 / 200
EMA Separation filter to identify sideways markets
ADX Trend Strength analysis
EMA Momentum confirmation
ATR Volatility classification
100-point Market Score
State & Filter Dashboard
HTF Simulation without using request.security()
Market Quality Modules
Trend
Determines the primary market trend using the alignment of EMA 21, EMA 55 and EMA 200.
Bullish → EMA 21 > EMA 55 > EMA 200
Bearish → EMA 21 < EMA 55 < EMA 200
EMA Separation
Measures the distance between EMA 21 and EMA 55.
Helps filter sideways markets where moving averages become compressed.
ADX (Trend Strength)
Evaluates the strength of the current trend.
Displays:
ADX Value
Trend Strength
Rising / Falling Direction
EMA Momentum
Measures the rate of change of EMA 21.
Confirms whether momentum is aligned with the current market trend.
ATR Volatility
Evaluates current market volatility.
ATR is classified into three states:
Expanding
Stable
Contracting
For trend-following markets:
Expanding → PASS
Stable → PASS
Contracting → BLOCK
Unlike previous versions, Stable volatility is considered a valid condition for trend-following markets. Only Contracting volatility blocks the ATR filter.
Market Score
Each module contributes to a 100-point Market Score.
The score is designed to evaluate and rank overall market quality. It is not intended to generate entry signals.
Suggested interpretation:
80 – 100 → Excellent Market Conditions
65 – 79 → Good Market Conditions
50 – 64 → Average Market Conditions
Below 50 → Weak Market Conditions
Dashboard Philosophy
The dashboard separates market information into two independent concepts:
State
Displays the current market condition.
Examples:
Bullish Trend
Strong ADX
Expanding ATR
Positive Momentum
Filter
Shows whether each condition satisfies the trading requirements.
Possible results:
PASS
BLOCK
FILTER OFF
This separation allows traders to quickly identify which condition is preventing a valid trend setup, rather than relying on simple Buy or Sell signals.
HTF Simulation
Supports Higher Timeframe (HTF) Simulation by scaling indicator lengths according to the selected timeframe ratio.
This approach provides a smooth approximation of higher-timeframe market behavior without relying on request.security(), helping traders maintain consistency across multiple timeframes.
How to Use
Use the dashboard as a market quality filter before applying your own trading strategy.
Look for Long opportunities when:
EMA 21 > EMA 55 > EMA 200
EMA Separation passes
ADX passes
EMA Momentum is aligned with the bullish trend
ATR is Expanding or Stable
Market Score is preferably 80 or higher
Look for Short opportunities when:
EMA 21 < EMA 55 < EMA 200
EMA Separation passes
ADX passes
EMA Momentum is aligned with the bearish trend
ATR is Expanding or Stable
Market Score is preferably 80 or higher
Works Best With
This dashboard is designed to complement, not replace, your trading strategy.
It works best when combined with:
Market Structure
Support & Resistance
Supply & Demand
Order Blocks
Liquidity Concepts
Pullbacks
Risk Management
Important Notes
This indicator is not an entry signal.
It is designed to evaluate market quality before trade execution.
Market Score is a market quality ranking system and should never be interpreted as a Buy or Sell signal.
ATR Stable is considered a valid condition for trend-following markets. Only ATR Contracting blocks the ATR filter.
The dashboard is intended to improve trade selection by helping traders avoid low-quality market conditions, rather than predicting future price movements.
An enhanced evolution of the original DANGHIEU EMA 21/55/200 V2 + ADX ATR Momentum, redesigned as a comprehensive Market Quality Dashboard to evaluate trend quality before trade execution.
Overview
EMA 21/55/200 Market Quality Dashboard is a professional trend-following market filter designed to evaluate overall market quality before traders search for trend-following opportunities.
Rather than generating Buy or Sell signals, this indicator analyzes multiple independent market conditions and presents them in a structured dashboard. Its purpose is to help traders understand why the market is suitable—or unsuitable—for trend trading, allowing for more informed decision-making before execution.
Key Features
Trend identification using EMA 21 / 55 / 200
EMA Separation filter to identify sideways markets
ADX Trend Strength analysis
EMA Momentum confirmation
ATR Volatility classification
100-point Market Score
State & Filter Dashboard
HTF Simulation without using request.security()
Market Quality Modules
Trend
Determines the primary market trend using the alignment of EMA 21, EMA 55 and EMA 200.
Bullish → EMA 21 > EMA 55 > EMA 200
Bearish → EMA 21 < EMA 55 < EMA 200
EMA Separation
Measures the distance between EMA 21 and EMA 55.
Helps filter sideways markets where moving averages become compressed.
ADX (Trend Strength)
Evaluates the strength of the current trend.
Displays:
ADX Value
Trend Strength
Rising / Falling Direction
EMA Momentum
Measures the rate of change of EMA 21.
Confirms whether momentum is aligned with the current market trend.
ATR Volatility
Evaluates current market volatility.
ATR is classified into three states:
Expanding
Stable
Contracting
For trend-following markets:
Expanding → PASS
Stable → PASS
Contracting → BLOCK
Unlike previous versions, Stable volatility is considered a valid condition for trend-following markets. Only Contracting volatility blocks the ATR filter.
Market Score
Each module contributes to a 100-point Market Score.
The score is designed to evaluate and rank overall market quality. It is not intended to generate entry signals.
Suggested interpretation:
80 – 100 → Excellent Market Conditions
65 – 79 → Good Market Conditions
50 – 64 → Average Market Conditions
Below 50 → Weak Market Conditions
Dashboard Philosophy
The dashboard separates market information into two independent concepts:
State
Displays the current market condition.
Examples:
Bullish Trend
Strong ADX
Expanding ATR
Positive Momentum
Filter
Shows whether each condition satisfies the trading requirements.
Possible results:
PASS
BLOCK
FILTER OFF
This separation allows traders to quickly identify which condition is preventing a valid trend setup, rather than relying on simple Buy or Sell signals.
HTF Simulation
Supports Higher Timeframe (HTF) Simulation by scaling indicator lengths according to the selected timeframe ratio.
This approach provides a smooth approximation of higher-timeframe market behavior without relying on request.security(), helping traders maintain consistency across multiple timeframes.
How to Use
Use the dashboard as a market quality filter before applying your own trading strategy.
Look for Long opportunities when:
EMA 21 > EMA 55 > EMA 200
EMA Separation passes
ADX passes
EMA Momentum is aligned with the bullish trend
ATR is Expanding or Stable
Market Score is preferably 80 or higher
Look for Short opportunities when:
EMA 21 < EMA 55 < EMA 200
EMA Separation passes
ADX passes
EMA Momentum is aligned with the bearish trend
ATR is Expanding or Stable
Market Score is preferably 80 or higher
Works Best With
This dashboard is designed to complement, not replace, your trading strategy.
It works best when combined with:
Market Structure
Support & Resistance
Supply & Demand
Order Blocks
Liquidity Concepts
Pullbacks
Risk Management
Important Notes
This indicator is not an entry signal.
It is designed to evaluate market quality before trade execution.
Market Score is a market quality ranking system and should never be interpreted as a Buy or Sell signal.
ATR Stable is considered a valid condition for trend-following markets. Only ATR Contracting blocks the ATR filter.
The dashboard is intended to improve trade selection by helping traders avoid low-quality market conditions, rather than predicting future price movements.
Skrypt open-source
W zgodzie z duchem TradingView twórca tego skryptu udostępnił go jako open-source, aby użytkownicy mogli przejrzeć i zweryfikować jego działanie. Ukłony dla autora. Korzystanie jest bezpłatne, jednak ponowna publikacja kodu podlega naszym Zasadom serwisu.

Wyłączenie odpowiedzialności
Informacje i publikacje nie stanowią i nie powinny być traktowane jako porady finansowe, inwestycyjne, tradingowe ani jakiekolwiek inne rekomendacje dostarczane lub zatwierdzone przez TradingView. Więcej informacji znajduje się w Warunkach użytkowania.
Skrypt open-source
W zgodzie z duchem TradingView twórca tego skryptu udostępnił go jako open-source, aby użytkownicy mogli przejrzeć i zweryfikować jego działanie. Ukłony dla autora. Korzystanie jest bezpłatne, jednak ponowna publikacja kodu podlega naszym Zasadom serwisu.
Wyłączenie odpowiedzialności
Informacje i publikacje nie stanowią i nie powinny być traktowane jako porady finansowe, inwestycyjne, tradingowe ani jakiekolwiek inne rekomendacje dostarczane lub zatwierdzone przez TradingView. Więcej informacji znajduje się w Warunkach użytkowania.