OPEN-SOURCE SCRIPT
Zaktualizowano Divergence Strength Analyzer-John Hayden
Hayden Momentum Regimes & Time-Decay Divergence Analyzer
Overview:
Most retail traders treat the Relative Strength Index (RSI) as a basic overbought/oversold oscillator—shorting above 70 and buying below 30. In *"RSI: The Complete Guide," John Hayden* completely flips this flawed conventional wisdom on its head. Hayden demonstrates that extreme RSI levels actually represent high-velocity structural momentum expansions rather than impending reversals.
This open-source Pine Script tool here maps Hayden's proprietary market regimes, isolates institutional *Hidden and Normal Divergences, and introduces a strict **Time-Decay Strength Matrix* to filter out low-velocity market noise.
Core Mechanics
1. The High-Velocity Regime Speedometer
Instead of looking for immediate trend reversals when the RSI enters extreme territories, this indicator uses these levels to categorize the macro trend structure:
*The Bull Market Regime (40/80 Range):* Initiated when the RSI breaks out above 70. Once confirmed, the RSI establishes a firm support floor around the *40* line during pullbacks, indicating heavy institutional backing.
*The Bear Market Regime (20/60 Range):* Initiated when the RSI drops below 30. Relief rallies consistently stall out and find a ceiling around the *60* line, proving persistent distribution.
2. The Power of Hayden's Hidden Divergence
While normal divergence frequently acts as a near-term counter-trend trap, Hayden highlights *Hidden Divergence* as the ultimate trend-continuation footprint.
* In a confirmed bullish regime, the price prints a structurally higher low while the RSI registers a deeply oversold lower low. This discrepancy indicates that while emotional momentum has fully cooled off, structural buying pressure remains completely intact, creating a coiled spring ready to unleash the next "superfast" leg up.
3. The Time-Decay Strength Matrix (%)
A primary reason traders fail with standard divergence indicators is that they fail to account for the element of time. Hayden explicitly teaches that the validity of a momentum discrepancy decays the longer it takes to form.
This script mathematically calculates the precise distance between structural peaks or troughs and scores the setup using Hayden’s time-based parameters:
* 🚀 *100% Strength (Ultra Condensed):* \le 4 bars between pivots. Highly explosive immediate velocity.
* 📈 *75% Strength (Standard Strong):* 5 to 8 bars between pivots. Highly reliable trend-joiner.
* ⚖️ *50% Strength (Moderate):* 9 to 12 bars between pivots. Average momentum reliability.
* ❌ *0% Strength (Decayed/Filtered):* > 16 bars between pivots. The setup is completely ignored and filtered off your chart to prevent slow, sideways chops.
How to Trade This Script
1. *Scan the Regime Background:* Look for a faint green chart overlay to confirm you are inside a valid Hayden Bull Regime.
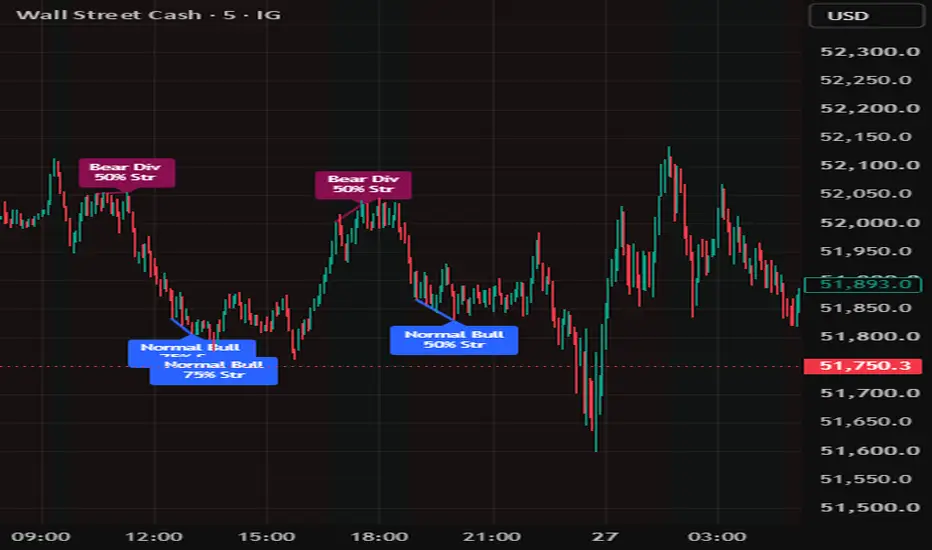
2. *Locate the Footprint:* Wait for the indicator to map an *MDRP Hidden Bull* or *Normal Bull* label.
3. *Verify the Strength %:* Prioritize signals showcasing *75% to 100% Strength*. This ensures you are striking right at the inflection point of structural trend acceleration.
4. *Invalidation:* If the macro RSI breaks out of its trend bounds (e.g., dropping below the 40-floor buffer in a bull market), the regime shifts to neutral, and current long-bias expectations are discarded.
Features
*Pure Price & Momentum Geometry:* Zero volume filters are utilized, making this script ideal for clean execution across both highly liquid indexes and choppy small-cap resource scripts.
*Dynamic Chart Labels:* Eliminates chart confusion by printing the exact divergence type alongside its dynamic strength rating directly on the key pivot bar.
Overview:
Most retail traders treat the Relative Strength Index (RSI) as a basic overbought/oversold oscillator—shorting above 70 and buying below 30. In *"RSI: The Complete Guide," John Hayden* completely flips this flawed conventional wisdom on its head. Hayden demonstrates that extreme RSI levels actually represent high-velocity structural momentum expansions rather than impending reversals.
This open-source Pine Script tool here maps Hayden's proprietary market regimes, isolates institutional *Hidden and Normal Divergences, and introduces a strict **Time-Decay Strength Matrix* to filter out low-velocity market noise.
Core Mechanics
1. The High-Velocity Regime Speedometer
Instead of looking for immediate trend reversals when the RSI enters extreme territories, this indicator uses these levels to categorize the macro trend structure:
*The Bull Market Regime (40/80 Range):* Initiated when the RSI breaks out above 70. Once confirmed, the RSI establishes a firm support floor around the *40* line during pullbacks, indicating heavy institutional backing.
*The Bear Market Regime (20/60 Range):* Initiated when the RSI drops below 30. Relief rallies consistently stall out and find a ceiling around the *60* line, proving persistent distribution.
2. The Power of Hayden's Hidden Divergence
While normal divergence frequently acts as a near-term counter-trend trap, Hayden highlights *Hidden Divergence* as the ultimate trend-continuation footprint.
* In a confirmed bullish regime, the price prints a structurally higher low while the RSI registers a deeply oversold lower low. This discrepancy indicates that while emotional momentum has fully cooled off, structural buying pressure remains completely intact, creating a coiled spring ready to unleash the next "superfast" leg up.
3. The Time-Decay Strength Matrix (%)
A primary reason traders fail with standard divergence indicators is that they fail to account for the element of time. Hayden explicitly teaches that the validity of a momentum discrepancy decays the longer it takes to form.
This script mathematically calculates the precise distance between structural peaks or troughs and scores the setup using Hayden’s time-based parameters:
* 🚀 *100% Strength (Ultra Condensed):* \le 4 bars between pivots. Highly explosive immediate velocity.
* 📈 *75% Strength (Standard Strong):* 5 to 8 bars between pivots. Highly reliable trend-joiner.
* ⚖️ *50% Strength (Moderate):* 9 to 12 bars between pivots. Average momentum reliability.
* ❌ *0% Strength (Decayed/Filtered):* > 16 bars between pivots. The setup is completely ignored and filtered off your chart to prevent slow, sideways chops.
How to Trade This Script
1. *Scan the Regime Background:* Look for a faint green chart overlay to confirm you are inside a valid Hayden Bull Regime.
2. *Locate the Footprint:* Wait for the indicator to map an *MDRP Hidden Bull* or *Normal Bull* label.
3. *Verify the Strength %:* Prioritize signals showcasing *75% to 100% Strength*. This ensures you are striking right at the inflection point of structural trend acceleration.
4. *Invalidation:* If the macro RSI breaks out of its trend bounds (e.g., dropping below the 40-floor buffer in a bull market), the regime shifts to neutral, and current long-bias expectations are discarded.
Features
*Pure Price & Momentum Geometry:* Zero volume filters are utilized, making this script ideal for clean execution across both highly liquid indexes and choppy small-cap resource scripts.
*Dynamic Chart Labels:* Eliminates chart confusion by printing the exact divergence type alongside its dynamic strength rating directly on the key pivot bar.
Informacje o Wersji
Added Visual trend line to show DivergenceInformacje o Wersji
Visual refreshInformacje o Wersji
Visual RefreshInformacje o Wersji
Visual RefreshInformacje o Wersji
Visual RefreshInformacje o Wersji
Visual line Skrypt open-source
W zgodzie z duchem TradingView twórca tego skryptu udostępnił go jako open-source, aby użytkownicy mogli przejrzeć i zweryfikować jego działanie. Ukłony dla autora. Korzystanie jest bezpłatne, jednak ponowna publikacja kodu podlega naszym Zasadom serwisu.

Wyłączenie odpowiedzialności
Informacje i publikacje nie stanowią i nie powinny być traktowane jako porady finansowe, inwestycyjne, tradingowe ani jakiekolwiek inne rekomendacje dostarczane lub zatwierdzone przez TradingView. Więcej informacji znajduje się w Warunkach użytkowania.
Skrypt open-source
W zgodzie z duchem TradingView twórca tego skryptu udostępnił go jako open-source, aby użytkownicy mogli przejrzeć i zweryfikować jego działanie. Ukłony dla autora. Korzystanie jest bezpłatne, jednak ponowna publikacja kodu podlega naszym Zasadom serwisu.
Wyłączenie odpowiedzialności
Informacje i publikacje nie stanowią i nie powinny być traktowane jako porady finansowe, inwestycyjne, tradingowe ani jakiekolwiek inne rekomendacje dostarczane lub zatwierdzone przez TradingView. Więcej informacji znajduje się w Warunkach użytkowania.