OPEN-SOURCE SCRIPT
Sati Dashboard 9-Box (Position Fixed)
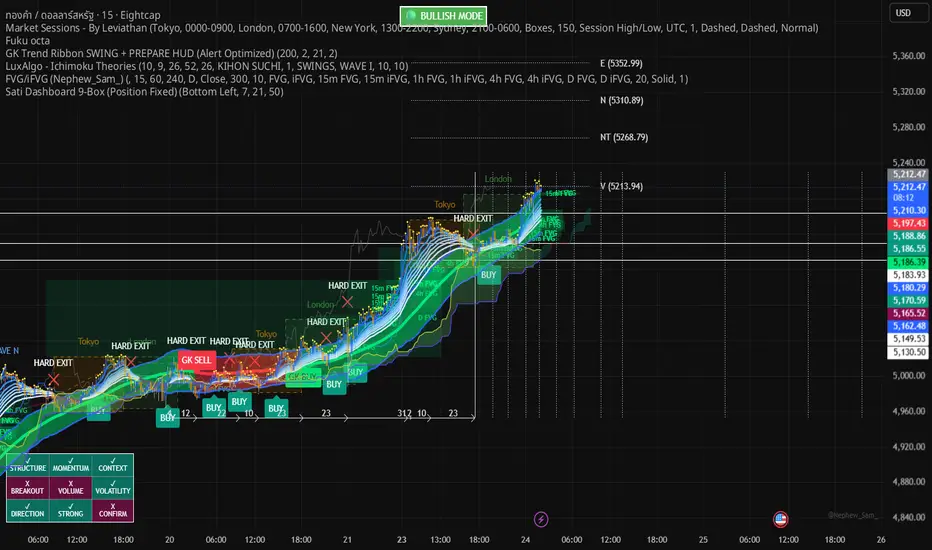
ATI Dashboard 9-Box (Position Fixed) is a trade management system built as a “Stable Architecture of Mindfulness”—turning market complexity into a simple checklist to reduce emotional decisions and strengthen discipline.
Core Philosophy
“Not to be the most accurate entry machine, but to keep you from losing your mind.”
This system isn’t designed to make you chase price arrows. It’s designed to verify market readiness across four key dimensions—Structure, Momentum, Context, and Volume—before you commit capital.
Key Features
9-Box Checklist Dashboard: A 9-cell binary (Yes/No) checklist that filters out market noise.
Structure: Validates price structure using EMA 21 and EMA 50.
Momentum: Confirms driving force via RSI and price swing/impulse strength.
Context: Confirms the higher-timeframe trend using 1H, so you don’t trade against the main trend.
Volume & Volatility: Confirms sufficient trading volume and appropriate volatility.
Signal Stability: An intelligent signal filter that reduces whipsaw in sideways markets by locking the BUY signal until a clear exit condition appears.
Hard Exit Protection: Triggers an immediate exit alert when structure breaks (e.g., a candle closes beyond the Base Line) to protect capital before major damage occurs.
Customizable UI (Position Fixed): You can move the Dashboard to different screen corners via Settings (Top Right, Bottom Left, etc.) to fit both desktop and mobile screens.
How to Use
Wait for the Checklist: Watch the 9-box Dashboard. If more than 6–7 boxes turn green (✓), the market is considered highly ready.
Entry: Enter when the “BUY” label appears while the readiness score meets the threshold.
Exit: Consider closing when “HARD EXIT” (red X) appears, or when multiple boxes start turning red (X), indicating weakening structure.
Settings
Dashboard Position: Choose the corner where the panel will appear.
Minimum Score: Adjust how “strict” the signal is (recommended: 7 for higher accuracy).
Base Line: Adjust the EMA value to match your preferred timeframe.
Risk Disclaimer: Trading involves risk. This indicator is only a decision-support tool based on statistics and mathematics. Users must apply their own risk management at all times.
Core Philosophy
“Not to be the most accurate entry machine, but to keep you from losing your mind.”
This system isn’t designed to make you chase price arrows. It’s designed to verify market readiness across four key dimensions—Structure, Momentum, Context, and Volume—before you commit capital.
Key Features
9-Box Checklist Dashboard: A 9-cell binary (Yes/No) checklist that filters out market noise.
Structure: Validates price structure using EMA 21 and EMA 50.
Momentum: Confirms driving force via RSI and price swing/impulse strength.
Context: Confirms the higher-timeframe trend using 1H, so you don’t trade against the main trend.
Volume & Volatility: Confirms sufficient trading volume and appropriate volatility.
Signal Stability: An intelligent signal filter that reduces whipsaw in sideways markets by locking the BUY signal until a clear exit condition appears.
Hard Exit Protection: Triggers an immediate exit alert when structure breaks (e.g., a candle closes beyond the Base Line) to protect capital before major damage occurs.
Customizable UI (Position Fixed): You can move the Dashboard to different screen corners via Settings (Top Right, Bottom Left, etc.) to fit both desktop and mobile screens.
How to Use
Wait for the Checklist: Watch the 9-box Dashboard. If more than 6–7 boxes turn green (✓), the market is considered highly ready.
Entry: Enter when the “BUY” label appears while the readiness score meets the threshold.
Exit: Consider closing when “HARD EXIT” (red X) appears, or when multiple boxes start turning red (X), indicating weakening structure.
Settings
Dashboard Position: Choose the corner where the panel will appear.
Minimum Score: Adjust how “strict” the signal is (recommended: 7 for higher accuracy).
Base Line: Adjust the EMA value to match your preferred timeframe.
Risk Disclaimer: Trading involves risk. This indicator is only a decision-support tool based on statistics and mathematics. Users must apply their own risk management at all times.
Skrypt open-source
W zgodzie z duchem TradingView twórca tego skryptu udostępnił go jako open-source, aby użytkownicy mogli przejrzeć i zweryfikować jego działanie. Ukłony dla autora. Korzystanie jest bezpłatne, jednak ponowna publikacja kodu podlega naszym Zasadom serwisu.

Wyłączenie odpowiedzialności
Informacje i publikacje nie stanowią i nie powinny być traktowane jako porady finansowe, inwestycyjne, tradingowe ani jakiekolwiek inne rekomendacje dostarczane lub zatwierdzone przez TradingView. Więcej informacji znajduje się w Warunkach użytkowania.
Skrypt open-source
W zgodzie z duchem TradingView twórca tego skryptu udostępnił go jako open-source, aby użytkownicy mogli przejrzeć i zweryfikować jego działanie. Ukłony dla autora. Korzystanie jest bezpłatne, jednak ponowna publikacja kodu podlega naszym Zasadom serwisu.
Wyłączenie odpowiedzialności
Informacje i publikacje nie stanowią i nie powinny być traktowane jako porady finansowe, inwestycyjne, tradingowe ani jakiekolwiek inne rekomendacje dostarczane lub zatwierdzone przez TradingView. Więcej informacji znajduje się w Warunkach użytkowania.