Smart Volume [Forex]
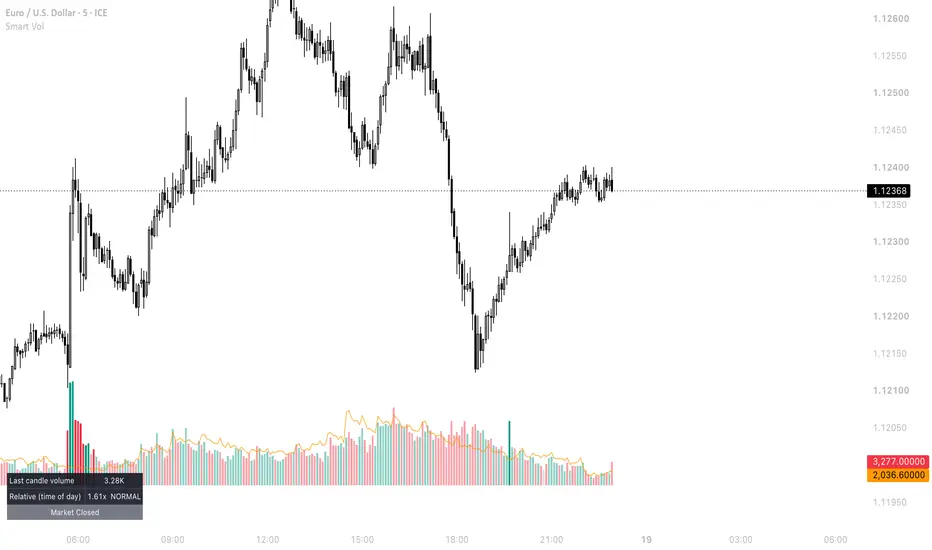
Smart Volume [Forex] draws colour-coded volume bars at the bottom of the price chart and measures how busy each candle is compared with what is NORMAL FOR THAT TIME OF DAY.
WHY TIME-OF-DAY RELATIVE VOLUME?
Forex volume follows the trading sessions: activity is naturally low during the late Asian session and much higher at the London and New York opens. A standard moving average of volume mixes these periods together, so almost every London-open candle looks "high" and almost every Asian candle looks "low". This script instead compares each candle with the average volume of the same hour and minute over the last N days. A reading of 2.0x therefore means "twice as active as this time of day usually is", which makes unusual activity much easier to spot.
HOW IT WORKS
- For every intraday time slot (e.g. 08:30), the script stores the volume of that slot over the last N days (default 10) and uses their average as the baseline.
- Relative volume (RVOL) = current candle volume / baseline.
- A "Simple" mode is also available, which uses a plain moving average of the last N candles. On daily and higher timeframes the simple mode is always used.
COLOURS
- Normal volume: semi-transparent green (up candle) or red (down candle).
- High volume (RVOL ≥ 2.0x by default): solid green / red.
- Low volume (RVOL ≤ 0.5x by default): grey.
- Orange line: the baseline (average) volume.
INFO BOX
Shows the volume of the latest candle and its relative volume with a HIGH / NORMAL / LOW label. When the forex market is closed (weekend), the box makes clear that it is showing the last candle of the week.
SETTINGS
Bar height (% of chart), colours, average method, number of days / candles, high and low thresholds, info box on/off.
ALERTS
- High volume bullish candle
- High volume bearish candle
NOTE ON FOREX VOLUME
Forex has no central exchange, so the volume available on TradingView for currency pairs is tick volume (the number of price changes), and it can differ between data providers. It is a useful measure of activity, but it is not the actual traded volume.
HOW TO USE
Use it as context rather than as a signal on its own, for example: a breakout or rejection with high relative volume is more significant than one with low relative volume, and low relative volume periods usually offer weaker follow-through.
This script is for educational purposes and does not constitute financial advice.
WHY TIME-OF-DAY RELATIVE VOLUME?
Forex volume follows the trading sessions: activity is naturally low during the late Asian session and much higher at the London and New York opens. A standard moving average of volume mixes these periods together, so almost every London-open candle looks "high" and almost every Asian candle looks "low". This script instead compares each candle with the average volume of the same hour and minute over the last N days. A reading of 2.0x therefore means "twice as active as this time of day usually is", which makes unusual activity much easier to spot.
HOW IT WORKS
- For every intraday time slot (e.g. 08:30), the script stores the volume of that slot over the last N days (default 10) and uses their average as the baseline.
- Relative volume (RVOL) = current candle volume / baseline.
- A "Simple" mode is also available, which uses a plain moving average of the last N candles. On daily and higher timeframes the simple mode is always used.
COLOURS
- Normal volume: semi-transparent green (up candle) or red (down candle).
- High volume (RVOL ≥ 2.0x by default): solid green / red.
- Low volume (RVOL ≤ 0.5x by default): grey.
- Orange line: the baseline (average) volume.
INFO BOX
Shows the volume of the latest candle and its relative volume with a HIGH / NORMAL / LOW label. When the forex market is closed (weekend), the box makes clear that it is showing the last candle of the week.
SETTINGS
Bar height (% of chart), colours, average method, number of days / candles, high and low thresholds, info box on/off.
ALERTS
- High volume bullish candle
- High volume bearish candle
NOTE ON FOREX VOLUME
Forex has no central exchange, so the volume available on TradingView for currency pairs is tick volume (the number of price changes), and it can differ between data providers. It is a useful measure of activity, but it is not the actual traded volume.
HOW TO USE
Use it as context rather than as a signal on its own, for example: a breakout or rejection with high relative volume is more significant than one with low relative volume, and low relative volume periods usually offer weaker follow-through.
This script is for educational purposes and does not constitute financial advice.

Wyłączenie odpowiedzialności
Informacje i publikacje nie stanowią i nie powinny być traktowane jako porady finansowe, inwestycyjne, tradingowe ani jakiekolwiek inne rekomendacje dostarczane lub zatwierdzone przez TradingView. Więcej informacji znajduje się w Warunkach użytkowania.
Wyłączenie odpowiedzialności
Informacje i publikacje nie stanowią i nie powinny być traktowane jako porady finansowe, inwestycyjne, tradingowe ani jakiekolwiek inne rekomendacje dostarczane lub zatwierdzone przez TradingView. Więcej informacji znajduje się w Warunkach użytkowania.