Trend Projection Lasers by MoneyK
Trend Projection Lasers by MoneyK
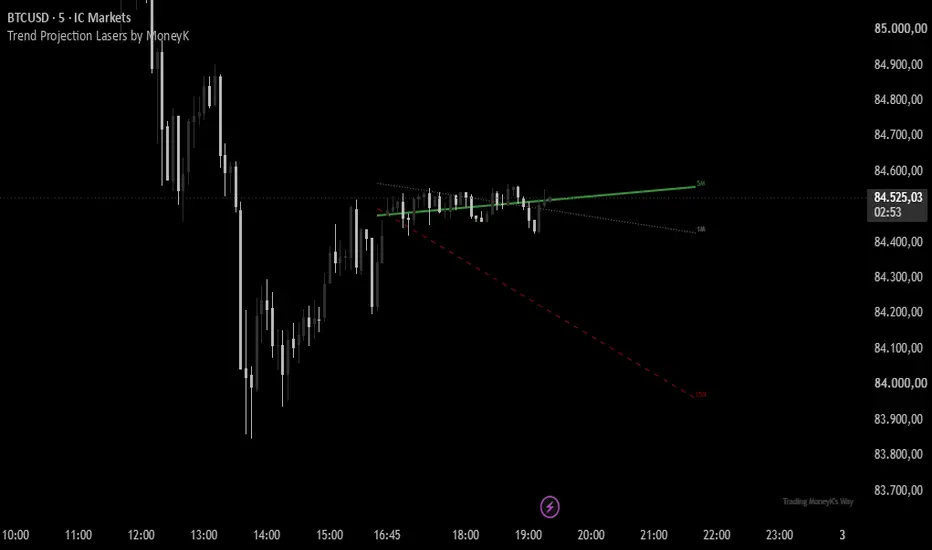
Trend Projection Lasers is a multi-timeframe visual analysis tool designed to make short-term trend direction, momentum and timeframe interaction easier to read directly on the chart.
Rather than displaying another oscillator or dashboard, the indicator draws a set of projected “lasers” over price. Each laser represents the current linear trajectory of a specific timeframe, allowing traders to compare what the lower timeframe is doing, what the active chart timeframe is doing, and what the higher timeframe is doing at the same time.
The objective is not to predict where price will go. The lasers show where the current regression slope is pointing if the present trajectory continues. They are therefore best understood as a visual representation of directional pressure and trend geometry, not as a price target or automatic trading signal.
How the lasers are calculated
Each laser is based on a 34-bar linear regression. The current regression slope is measured and then extended forward to create a visual projection.
A positive slope is displayed with the bullish color, a negative slope with the bearish color, and a very small slope relative to ATR is classified as flat or neutral.
The projection extends 28 chart bars forward. Every timeframe keeps its own independent regression slope, while the lasers are drawn inside the same chart-space window so their direction can be compared visually.
Three-timeframe structure
The indicator organizes the chart into three possible layers.
The Lower TF Laser is drawn as a dotted line and shows the faster timeframe when one is available. It is useful for seeing short-term acceleration, pullbacks and early changes in direction.
The Current TF Laser is the solid line. It represents the timeframe currently being traded or analyzed and acts as the main visual reference.
The Higher TF Laser is drawn as a dashed line. It provides broader directional context and helps show whether the current move is aligned with, pulling back against, or beginning to diverge from the larger trajectory.
The predefined timeframe combinations are:
1M chart: 1M current + 5M higher
5M chart: 1M lower + 5M current + 15M higher
15M chart: 5M lower + 15M current + 1H higher
30M chart: 15M lower + 30M current + 1H higher
1H chart: 15M lower + 1H current + 4H higher
This makes the indicator particularly useful for scalpers and intraday traders, because the immediate move can be viewed without losing sight of the timeframe above it.
Reading alignment
When the current and higher-timeframe lasers point in the same direction, the active move has broader timeframe agreement.
When all available lasers point in the same direction, short-term, current and higher-timeframe trajectories are aligned.
When the lower timeframe turns against the current and higher timeframes, the chart may be showing a short-term pullback inside a broader directional move.
When the current timeframe begins to oppose the higher timeframe, the trader can immediately see that the active move is no longer traveling in the same direction as the broader trajectory.
When one or more lasers become neutral or nearly flat, directional pressure has weakened. This can be useful in identifying compression, hesitation, loss of momentum or a transition before a clearer slope develops.
None of these situations is automatically a BUY or SELL signal. Their purpose is to make the relationship between timeframes easier to see.
How it can help with analysis
Trend Projection Lasers can help answer several practical questions quickly.
Is the current move traveling with or against the larger timeframe? Is a counter-move only visible on the faster timeframe, or has it already reached the active and higher timeframes? Is directional pressure increasing, weakening or flattening? Are multiple timeframes beginning to converge toward the same direction, or are they separating?
This can be especially useful when price action looks visually confusing. Instead of relying only on the shape of individual candles, the lasers summarize the recent trajectory of each selected timeframe into a simple directional reference.
They can also provide useful context alongside market structure, liquidity, support/resistance, fair value gaps, session behavior or other forms of technical analysis.
How it can help with trade management
The indicator can remain useful after an entry has already been taken.
For example, a temporary lower-timeframe reversal while the current and higher-timeframe lasers remain aligned may help distinguish a local pullback from a broader change in trajectory.
If the current timeframe begins to flatten while the higher timeframe remains directional, it can highlight a loss of immediate momentum without automatically implying that the larger move has reversed.
If both the current and higher-timeframe lasers flatten or turn against the existing move, the chart is showing that directional support has changed more substantially. This can be useful information when reassessing an open position, managing a runner, protecting gains or deciding how aggressively to continue participating in a move.
The indicator does not determine stop-loss placement, take-profit levels, position size or trade exits. It provides visual context that can support those decisions.
Dynamic behavior
The lasers update dynamically as price changes and as their source timeframe bars develop.
Because of this, a laser can change slope, color or angle while the underlying timeframe is still forming. This behavior is intentional: the indicator is designed to display the current developing trajectory, not to freeze a prediction made earlier.
For that reason, the projected extension should never be interpreted as a guaranteed future path.
Customization
Users can independently show or hide the lower, current and higher-timeframe lasers.
Laser widths can also be adjusted separately, and bullish, bearish and neutral colors are fully customizable. This allows the indicator to be adapted to different chart themes while preserving the distinction between the dotted lower-timeframe laser, solid current-timeframe laser and dashed higher-timeframe laser.
Important
Trend Projection Lasers is a visual context and analysis tool.
It does not generate trade entries, trade plans or alerts. It does not predict an exact future price and should not be treated as a standalone BUY or SELL system.
Its purpose is simpler: to make the evolving direction of several timeframes visible at a glance, helping traders understand whether short-term price action is aligned with, pulling back against, or diverging from the broader move.
Español
Trend Projection Lasers by MoneyK
Trend Projection Lasers es una herramienta visual de análisis multitemporal diseñada para facilitar la lectura de la dirección, el impulso y la relación entre distintos marcos temporales directamente sobre el gráfico.
En lugar de añadir otro oscilador o panel, el indicador dibuja sobre el precio una serie de “láseres” proyectados. Cada láser representa la trayectoria lineal actual de un marco temporal determinado, permitiendo comparar simultáneamente qué está haciendo el timeframe inferior, qué está haciendo el timeframe activo y qué está haciendo el timeframe superior.
Su objetivo no es predecir adónde va a llegar el precio. Los láseres muestran hacia dónde apunta la pendiente actual de la regresión si la trayectoria presente continuara. Por eso deben entenderse como una representación visual de la presión direccional y de la geometría de la tendencia, no como un objetivo de precio ni como una señal automática de trading.
Cómo se calculan los láseres
Cada láser se basa en una regresión lineal de 34 velas. El indicador mide su pendiente actual y la extiende hacia delante para crear la proyección visual.
Una pendiente positiva utiliza el color alcista, una pendiente negativa utiliza el color bajista y una pendiente muy pequeña en relación con el ATR se clasifica como plana o neutral.
La proyección se extiende 28 barras del gráfico hacia delante. Cada timeframe conserva su propia pendiente de regresión independiente, pero todos los láseres se dibujan dentro de una misma ventana visual para que sus direcciones puedan compararse fácilmente.
Estructura de tres timeframes
El indicador organiza la lectura en hasta tres capas.
El Lower TF Laser se dibuja con línea punteada y representa el marco temporal inferior cuando está disponible. Permite observar aceleraciones de corto plazo, retrocesos y cambios tempranos de dirección.
El Current TF Laser es la línea sólida. Representa el timeframe que se está analizando o negociando y funciona como referencia visual principal.
El Higher TF Laser aparece con línea entrecortada. Aporta el contexto de un marco temporal superior y permite ver si el movimiento actual está alineado con la trayectoria mayor, está retrocediendo contra ella o empieza a divergir.
Las combinaciones predefinidas son:
Gráfico 1M: 1M actual + 5M superior
Gráfico 5M: 1M inferior + 5M actual + 15M superior
Gráfico 15M: 5M inferior + 15M actual + 1H superior
Gráfico 30M: 15M inferior + 30M actual + 1H superior
Gráfico 1H: 15M inferior + 1H actual + 4H superior
Esta estructura resulta especialmente útil para scalpers y traders intradía, porque permite observar el movimiento inmediato sin perder de vista el contexto del timeframe superior.
Cómo interpretar la alineación
Cuando los láseres del timeframe actual y del timeframe superior apuntan en la misma dirección, el movimiento activo cuenta con una trayectoria compatible en un marco temporal mayor.
Cuando todos los láseres disponibles apuntan en la misma dirección, las trayectorias de corto plazo, timeframe actual y timeframe superior están alineadas.
Cuando el timeframe inferior gira en contra mientras los timeframes actual y superior mantienen su dirección, el gráfico puede estar mostrando un retroceso de corto plazo dentro de un movimiento mayor.
Cuando el timeframe actual empieza a apuntar contra el superior, resulta visible que el movimiento inmediato ya no está viajando en la misma dirección que la trayectoria de mayor marco temporal.
Cuando uno o varios láseres se vuelven neutrales o prácticamente planos, la presión direccional se ha debilitado. Esto puede ayudar a reconocer compresión, pausa, pérdida de impulso o una fase de transición antes de que aparezca una pendiente más definida.
Ninguna de estas situaciones constituye automáticamente una señal BUY o SELL. El propósito es hacer visible la relación entre los distintos timeframes.
Cómo ayuda en el análisis
Trend Projection Lasers permite responder rápidamente varias preguntas importantes.
¿El movimiento actual avanza a favor o en contra del marco temporal superior? ¿El movimiento contrario aparece únicamente en el timeframe rápido o ya está afectando también al timeframe operativo? ¿La presión direccional está aumentando, disminuyendo o aplanándose? ¿Los diferentes timeframes empiezan a converger hacia una misma dirección o se están separando?
Esto puede ser especialmente útil cuando la acción del precio resulta visualmente confusa. En vez de depender únicamente de la forma de las velas individuales, los láseres condensan la trayectoria reciente de cada timeframe en una referencia direccional sencilla.
También pueden utilizarse como contexto adicional junto con estructura de mercado, liquidez, soportes y resistencias, fair value gaps, comportamiento de las sesiones u otras herramientas de análisis técnico.
Cómo ayuda en la gestión de una operación
El indicador puede seguir aportando información después de haber tomado una entrada.
Por ejemplo, un giro temporal del timeframe inferior mientras los láseres actual y superior continúan alineados puede ayudar a diferenciar un pullback local de un cambio más amplio en la trayectoria.
Si el timeframe actual empieza a aplanarse mientras el superior conserva su dirección, puede estar mostrando una pérdida de impulso inmediato sin que eso implique automáticamente que el movimiento mayor haya cambiado.
Si tanto el timeframe actual como el superior empiezan a aplanarse o a girar contra el movimiento existente, el gráfico está mostrando un cambio más importante en el apoyo direccional. Esa información puede resultar útil al reevaluar una posición abierta, gestionar un runner, proteger beneficios o decidir cuánto margen se quiere seguir dando al movimiento.
El indicador no calcula el Stop Loss, Take Profit, tamaño de posición ni las salidas. Aporta contexto visual que puede complementar esas decisiones.
Comportamiento dinámico
Los láseres se actualizan dinámicamente a medida que cambia el precio y se desarrollan las velas de sus respectivos timeframes.
Por ello, un láser puede modificar su pendiente, color o ángulo mientras la vela del timeframe que lo origina continúa abierta. Este comportamiento es intencional: el indicador está diseñado para mostrar la trayectoria que se está desarrollando en ese momento, no para congelar una predicción realizada anteriormente.
Por esa razón, la extensión proyectada nunca debe interpretarse como una trayectoria futura garantizada.
Personalización
El usuario puede mostrar u ocultar de forma independiente los láseres del timeframe inferior, actual y superior.
También puede ajustar individualmente sus grosores y personalizar los colores alcista, bajista y neutral. De esta manera, el indicador puede adaptarse al estilo visual de cada gráfico manteniendo la distinción entre el láser punteado del timeframe inferior, el láser sólido del timeframe actual y el láser entrecortado del timeframe superior.
Importante
Trend Projection Lasers es una herramienta visual de contexto y análisis.
No genera entradas, planes de trading ni alertas. No predice un precio futuro exacto y no debe interpretarse como un sistema autónomo de BUY o SELL.
Su propósito es más sencillo: hacer visible de un vistazo la dirección que están desarrollando varios timeframes, ayudando a entender si la acción del precio de corto plazo está alineada con el movimiento mayor, está haciendo un pullback contra él o empieza a divergir.
Trend Projection Lasers is a multi-timeframe visual analysis tool designed to make short-term trend direction, momentum and timeframe interaction easier to read directly on the chart.
Rather than displaying another oscillator or dashboard, the indicator draws a set of projected “lasers” over price. Each laser represents the current linear trajectory of a specific timeframe, allowing traders to compare what the lower timeframe is doing, what the active chart timeframe is doing, and what the higher timeframe is doing at the same time.
The objective is not to predict where price will go. The lasers show where the current regression slope is pointing if the present trajectory continues. They are therefore best understood as a visual representation of directional pressure and trend geometry, not as a price target or automatic trading signal.
How the lasers are calculated
Each laser is based on a 34-bar linear regression. The current regression slope is measured and then extended forward to create a visual projection.
A positive slope is displayed with the bullish color, a negative slope with the bearish color, and a very small slope relative to ATR is classified as flat or neutral.
The projection extends 28 chart bars forward. Every timeframe keeps its own independent regression slope, while the lasers are drawn inside the same chart-space window so their direction can be compared visually.
Three-timeframe structure
The indicator organizes the chart into three possible layers.
The Lower TF Laser is drawn as a dotted line and shows the faster timeframe when one is available. It is useful for seeing short-term acceleration, pullbacks and early changes in direction.
The Current TF Laser is the solid line. It represents the timeframe currently being traded or analyzed and acts as the main visual reference.
The Higher TF Laser is drawn as a dashed line. It provides broader directional context and helps show whether the current move is aligned with, pulling back against, or beginning to diverge from the larger trajectory.
The predefined timeframe combinations are:
1M chart: 1M current + 5M higher
5M chart: 1M lower + 5M current + 15M higher
15M chart: 5M lower + 15M current + 1H higher
30M chart: 15M lower + 30M current + 1H higher
1H chart: 15M lower + 1H current + 4H higher
This makes the indicator particularly useful for scalpers and intraday traders, because the immediate move can be viewed without losing sight of the timeframe above it.
Reading alignment
When the current and higher-timeframe lasers point in the same direction, the active move has broader timeframe agreement.
When all available lasers point in the same direction, short-term, current and higher-timeframe trajectories are aligned.
When the lower timeframe turns against the current and higher timeframes, the chart may be showing a short-term pullback inside a broader directional move.
When the current timeframe begins to oppose the higher timeframe, the trader can immediately see that the active move is no longer traveling in the same direction as the broader trajectory.
When one or more lasers become neutral or nearly flat, directional pressure has weakened. This can be useful in identifying compression, hesitation, loss of momentum or a transition before a clearer slope develops.
None of these situations is automatically a BUY or SELL signal. Their purpose is to make the relationship between timeframes easier to see.
How it can help with analysis
Trend Projection Lasers can help answer several practical questions quickly.
Is the current move traveling with or against the larger timeframe? Is a counter-move only visible on the faster timeframe, or has it already reached the active and higher timeframes? Is directional pressure increasing, weakening or flattening? Are multiple timeframes beginning to converge toward the same direction, or are they separating?
This can be especially useful when price action looks visually confusing. Instead of relying only on the shape of individual candles, the lasers summarize the recent trajectory of each selected timeframe into a simple directional reference.
They can also provide useful context alongside market structure, liquidity, support/resistance, fair value gaps, session behavior or other forms of technical analysis.
How it can help with trade management
The indicator can remain useful after an entry has already been taken.
For example, a temporary lower-timeframe reversal while the current and higher-timeframe lasers remain aligned may help distinguish a local pullback from a broader change in trajectory.
If the current timeframe begins to flatten while the higher timeframe remains directional, it can highlight a loss of immediate momentum without automatically implying that the larger move has reversed.
If both the current and higher-timeframe lasers flatten or turn against the existing move, the chart is showing that directional support has changed more substantially. This can be useful information when reassessing an open position, managing a runner, protecting gains or deciding how aggressively to continue participating in a move.
The indicator does not determine stop-loss placement, take-profit levels, position size or trade exits. It provides visual context that can support those decisions.
Dynamic behavior
The lasers update dynamically as price changes and as their source timeframe bars develop.
Because of this, a laser can change slope, color or angle while the underlying timeframe is still forming. This behavior is intentional: the indicator is designed to display the current developing trajectory, not to freeze a prediction made earlier.
For that reason, the projected extension should never be interpreted as a guaranteed future path.
Customization
Users can independently show or hide the lower, current and higher-timeframe lasers.
Laser widths can also be adjusted separately, and bullish, bearish and neutral colors are fully customizable. This allows the indicator to be adapted to different chart themes while preserving the distinction between the dotted lower-timeframe laser, solid current-timeframe laser and dashed higher-timeframe laser.
Important
Trend Projection Lasers is a visual context and analysis tool.
It does not generate trade entries, trade plans or alerts. It does not predict an exact future price and should not be treated as a standalone BUY or SELL system.
Its purpose is simpler: to make the evolving direction of several timeframes visible at a glance, helping traders understand whether short-term price action is aligned with, pulling back against, or diverging from the broader move.
Español
Trend Projection Lasers by MoneyK
Trend Projection Lasers es una herramienta visual de análisis multitemporal diseñada para facilitar la lectura de la dirección, el impulso y la relación entre distintos marcos temporales directamente sobre el gráfico.
En lugar de añadir otro oscilador o panel, el indicador dibuja sobre el precio una serie de “láseres” proyectados. Cada láser representa la trayectoria lineal actual de un marco temporal determinado, permitiendo comparar simultáneamente qué está haciendo el timeframe inferior, qué está haciendo el timeframe activo y qué está haciendo el timeframe superior.
Su objetivo no es predecir adónde va a llegar el precio. Los láseres muestran hacia dónde apunta la pendiente actual de la regresión si la trayectoria presente continuara. Por eso deben entenderse como una representación visual de la presión direccional y de la geometría de la tendencia, no como un objetivo de precio ni como una señal automática de trading.
Cómo se calculan los láseres
Cada láser se basa en una regresión lineal de 34 velas. El indicador mide su pendiente actual y la extiende hacia delante para crear la proyección visual.
Una pendiente positiva utiliza el color alcista, una pendiente negativa utiliza el color bajista y una pendiente muy pequeña en relación con el ATR se clasifica como plana o neutral.
La proyección se extiende 28 barras del gráfico hacia delante. Cada timeframe conserva su propia pendiente de regresión independiente, pero todos los láseres se dibujan dentro de una misma ventana visual para que sus direcciones puedan compararse fácilmente.
Estructura de tres timeframes
El indicador organiza la lectura en hasta tres capas.
El Lower TF Laser se dibuja con línea punteada y representa el marco temporal inferior cuando está disponible. Permite observar aceleraciones de corto plazo, retrocesos y cambios tempranos de dirección.
El Current TF Laser es la línea sólida. Representa el timeframe que se está analizando o negociando y funciona como referencia visual principal.
El Higher TF Laser aparece con línea entrecortada. Aporta el contexto de un marco temporal superior y permite ver si el movimiento actual está alineado con la trayectoria mayor, está retrocediendo contra ella o empieza a divergir.
Las combinaciones predefinidas son:
Gráfico 1M: 1M actual + 5M superior
Gráfico 5M: 1M inferior + 5M actual + 15M superior
Gráfico 15M: 5M inferior + 15M actual + 1H superior
Gráfico 30M: 15M inferior + 30M actual + 1H superior
Gráfico 1H: 15M inferior + 1H actual + 4H superior
Esta estructura resulta especialmente útil para scalpers y traders intradía, porque permite observar el movimiento inmediato sin perder de vista el contexto del timeframe superior.
Cómo interpretar la alineación
Cuando los láseres del timeframe actual y del timeframe superior apuntan en la misma dirección, el movimiento activo cuenta con una trayectoria compatible en un marco temporal mayor.
Cuando todos los láseres disponibles apuntan en la misma dirección, las trayectorias de corto plazo, timeframe actual y timeframe superior están alineadas.
Cuando el timeframe inferior gira en contra mientras los timeframes actual y superior mantienen su dirección, el gráfico puede estar mostrando un retroceso de corto plazo dentro de un movimiento mayor.
Cuando el timeframe actual empieza a apuntar contra el superior, resulta visible que el movimiento inmediato ya no está viajando en la misma dirección que la trayectoria de mayor marco temporal.
Cuando uno o varios láseres se vuelven neutrales o prácticamente planos, la presión direccional se ha debilitado. Esto puede ayudar a reconocer compresión, pausa, pérdida de impulso o una fase de transición antes de que aparezca una pendiente más definida.
Ninguna de estas situaciones constituye automáticamente una señal BUY o SELL. El propósito es hacer visible la relación entre los distintos timeframes.
Cómo ayuda en el análisis
Trend Projection Lasers permite responder rápidamente varias preguntas importantes.
¿El movimiento actual avanza a favor o en contra del marco temporal superior? ¿El movimiento contrario aparece únicamente en el timeframe rápido o ya está afectando también al timeframe operativo? ¿La presión direccional está aumentando, disminuyendo o aplanándose? ¿Los diferentes timeframes empiezan a converger hacia una misma dirección o se están separando?
Esto puede ser especialmente útil cuando la acción del precio resulta visualmente confusa. En vez de depender únicamente de la forma de las velas individuales, los láseres condensan la trayectoria reciente de cada timeframe en una referencia direccional sencilla.
También pueden utilizarse como contexto adicional junto con estructura de mercado, liquidez, soportes y resistencias, fair value gaps, comportamiento de las sesiones u otras herramientas de análisis técnico.
Cómo ayuda en la gestión de una operación
El indicador puede seguir aportando información después de haber tomado una entrada.
Por ejemplo, un giro temporal del timeframe inferior mientras los láseres actual y superior continúan alineados puede ayudar a diferenciar un pullback local de un cambio más amplio en la trayectoria.
Si el timeframe actual empieza a aplanarse mientras el superior conserva su dirección, puede estar mostrando una pérdida de impulso inmediato sin que eso implique automáticamente que el movimiento mayor haya cambiado.
Si tanto el timeframe actual como el superior empiezan a aplanarse o a girar contra el movimiento existente, el gráfico está mostrando un cambio más importante en el apoyo direccional. Esa información puede resultar útil al reevaluar una posición abierta, gestionar un runner, proteger beneficios o decidir cuánto margen se quiere seguir dando al movimiento.
El indicador no calcula el Stop Loss, Take Profit, tamaño de posición ni las salidas. Aporta contexto visual que puede complementar esas decisiones.
Comportamiento dinámico
Los láseres se actualizan dinámicamente a medida que cambia el precio y se desarrollan las velas de sus respectivos timeframes.
Por ello, un láser puede modificar su pendiente, color o ángulo mientras la vela del timeframe que lo origina continúa abierta. Este comportamiento es intencional: el indicador está diseñado para mostrar la trayectoria que se está desarrollando en ese momento, no para congelar una predicción realizada anteriormente.
Por esa razón, la extensión proyectada nunca debe interpretarse como una trayectoria futura garantizada.
Personalización
El usuario puede mostrar u ocultar de forma independiente los láseres del timeframe inferior, actual y superior.
También puede ajustar individualmente sus grosores y personalizar los colores alcista, bajista y neutral. De esta manera, el indicador puede adaptarse al estilo visual de cada gráfico manteniendo la distinción entre el láser punteado del timeframe inferior, el láser sólido del timeframe actual y el láser entrecortado del timeframe superior.
Importante
Trend Projection Lasers es una herramienta visual de contexto y análisis.
No genera entradas, planes de trading ni alertas. No predice un precio futuro exacto y no debe interpretarse como un sistema autónomo de BUY o SELL.
Su propósito es más sencillo: hacer visible de un vistazo la dirección que están desarrollando varios timeframes, ayudando a entender si la acción del precio de corto plazo está alineada con el movimiento mayor, está haciendo un pullback contra él o empieza a divergir.

Money-K
Wyłączenie odpowiedzialności
Informacje i publikacje nie stanowią i nie powinny być traktowane jako porady finansowe, inwestycyjne, tradingowe ani jakiekolwiek inne rekomendacje dostarczane lub zatwierdzone przez TradingView. Więcej informacji znajduje się w Warunkach użytkowania.
Money-K
Wyłączenie odpowiedzialności
Informacje i publikacje nie stanowią i nie powinny być traktowane jako porady finansowe, inwestycyjne, tradingowe ani jakiekolwiek inne rekomendacje dostarczane lub zatwierdzone przez TradingView. Więcej informacji znajduje się w Warunkach użytkowania.