Zaktualizowano
[blackcat] L3 CCI-RSI Combo
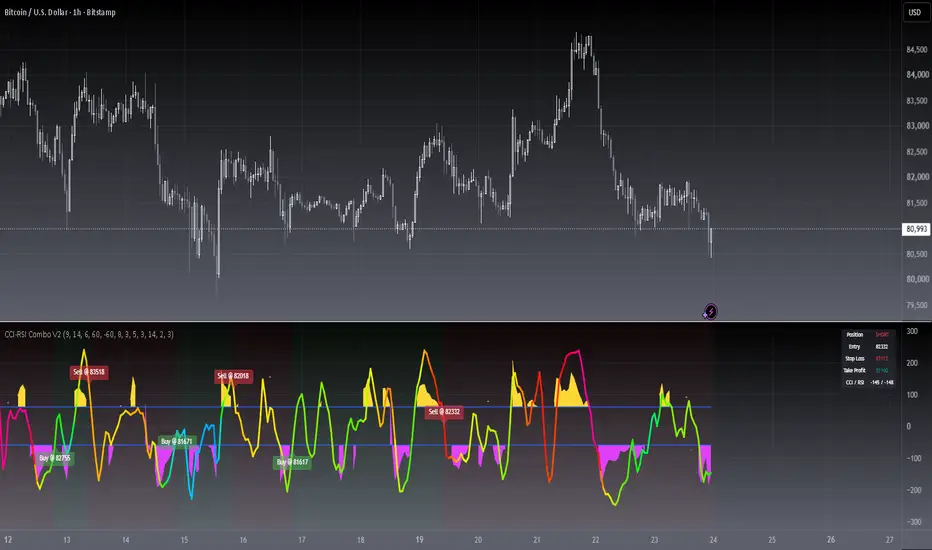
CCI-RSI Combo indicator is a combination indicator that includes CCI and RSI. It uses some parameters to calculate the values of CCI and RSI, and generates corresponding charts based on these values. On the chart, when CCI exceeds 100 or falls below -100, yellow or magenta filling areas are displayed. Additionally, gradient colors are used on the RSI chart to represent different value ranges. Based on the values of CCI and RSI, buying or selling signals can be identified and "B" or "S" labels are displayed at the corresponding positions. It utilizes some technical indicators and logic to generate buying and selling signals, and displays the corresponding labels on the chart.
Here are the main parts of the code:
1. Definition of some variables:
- `N`, `M`, `N1`: Parameters used to calculate CCI and RSI.
- `xcn(cond, len)` and `xex(cond, len)`: Two functions used to calculate the number of times a condition is met.
2. Calculation of CCI (Commodity Channel Index):
- Calculate the CCI value based on the formula `(TYP - ta.sma(TYP, M)) / (0.015 * ta.stdev(TYP, M))`.
- Use the `plot()` function to plot CCI on the chart and set the color based on its value.
3. Calculation of RSI (Relative Strength Index):
- First calculate RSI1 by taking the average of positive differences between closing prices and the average of all absolute differences, and then multiplying by 100.
- Then use the ALMA function to transform RSI1 into a smoother curve.
- Use the `plot()` function to plot RSI on the chart and select gradient colors for shading based on its value.
4. Setting up the gradient color array:
- Create a color array using `array.new_color()` and add a series of color values to it.
5. Generating buying and selling signals based on conditions:
- Use logical operators and technical indicator functions to determine the conditions for buying and selling.
- Use the `label.new()` function to draw the corresponding labels on the chart to represent buying or selling signals.
Here are the main parts of the code:
1. Definition of some variables:
- `N`, `M`, `N1`: Parameters used to calculate CCI and RSI.
- `xcn(cond, len)` and `xex(cond, len)`: Two functions used to calculate the number of times a condition is met.
2. Calculation of CCI (Commodity Channel Index):
- Calculate the CCI value based on the formula `(TYP - ta.sma(TYP, M)) / (0.015 * ta.stdev(TYP, M))`.
- Use the `plot()` function to plot CCI on the chart and set the color based on its value.
3. Calculation of RSI (Relative Strength Index):
- First calculate RSI1 by taking the average of positive differences between closing prices and the average of all absolute differences, and then multiplying by 100.
- Then use the ALMA function to transform RSI1 into a smoother curve.
- Use the `plot()` function to plot RSI on the chart and select gradient colors for shading based on its value.
4. Setting up the gradient color array:
- Create a color array using `array.new_color()` and add a series of color values to it.
5. Generating buying and selling signals based on conditions:
- Use logical operators and technical indicator functions to determine the conditions for buying and selling.
- Use the `label.new()` function to draw the corresponding labels on the chart to represent buying or selling signals.
Informacje o Wersji
OVERVIEWThe [blackcat] L3 CCI-RSI Combo indicator combines the Commodity Channel Index (CCI) with a modified Relative Strength Index (RSI) to provide traders with enhanced insights into market momentum and potential trend reversals 📈💹. This script calculates both indicators using custom functions and plots them on separate panels for clear visualization.
FEATURES
Combines Commodity Channel Index (CCI) and Relative Strength Index (RSI):
N Periods: Number of periods used in RSI calculation.
M Periods: Number of periods used in CCI calculation.
N1 Periods: Additional period setting for RSI smoothing.
Plots CCI values with dynamic coloring based on their magnitude:
Yellow: Above upper limit.
Fuchsia: Below lower limit.
Displays a gradient-colored RSI line for better visual interpretation.
Includes upper and lower limits for CCI to highlight extreme values.
Generates buy ('Buy') and sell ('Sell') labels based on specific conditions.
Provides alert functionality for long and short signals 🔔
HOW TO USE
Add the indicator to your TradingView chart by selecting it from the indicators list.
Adjust the N Periods, M Periods, and N1 Periods parameters as needed.
Monitor the CCI and RSI lines on their respective panels.
Look for buy and sell labels indicating potential trade opportunities.
Set up alerts based on the generated signals to receive notifications when conditions are met 📲.
LIMITATIONS
The indicator may generate false signals in highly volatile or ranging markets 🌪️.
Users should combine this indicator with other forms of analysis for more reliable trading decisions.
The effectiveness of the indicator may vary depending on the asset and timeframe being analyzed.
NOTES
Ensure that you have sufficient historical data available for accurate calculations.
Test the indicator thoroughly on demo accounts before applying it to live trading 🔍.
Customize the appearance and parameters as needed to fit your trading strategy.
Informacje o Wersji
█ OVERVIEWL3 CCI-RSI Combo V2 is a momentum-swing oscillator that fuses a typical-price CCI with a double-smoothed, rainbow-gradient RSI in a single pane. It marks potential swing reversals with Buy/Sell labels, tracks a position state machine, and shows ATR-based take-profit and stop-loss reference levels with a live dashboard.
█ CONCEPTS
The engine combines two classic momentum views plus a swing-base filter:
• CCI trigger: a CCI computed on typical price crossing user-defined bands (default ±60) confirms momentum turns out of oversold/overbought territory.
• Swing base filter: before a signal can fire, price must touch the N-period lowest low (or highest high) at least a minimum number of times inside a lookback window — a sign of accumulation or distribution at the swing extreme.
• Rainbow RSI layer: an internally smoothed RSI is rescaled and recolored through a 101-step gradient (blue → green → yellow → red), giving an instant visual read of momentum strength.
• Signal governance (new in V2): every signal fires on the first bar its condition becomes true (edge-triggered), passes a cooldown window, and is arbitrated by a same-bar exclusivity rule so entries and exits never conflict on one bar.
█ HOW TO USE
1 — Add the indicator to any chart. The pane shows the rainbow RSI line, the CCI excursions beyond the bands (yellow above, fuchsia below with filled areas), and the two band lines.
2 — Wait for a Buy label (swing base at the lows + CCI crossing up through the lower band) or a Sell label (swing base at the highs + CCI crossing down through the upper band). Labels include the trigger price.
3 — Create alerts from the alert list (4 channels: Long, Short, Long Exit, Short Exit). Alerts fire once per bar close, so signals never repaint intrabar.
Input Parameters
• CCI-RSI Engine: N Periods (swing window, 9), M Periods (CCI length, 14), N1 Periods (RSI smoothing, 6).
• Signal Engine: Upper/Lower Limit (±60), Swing Count Window (8), Min Swing Touches (3), CCI Cross Lookback (5).
• Signal Governance: Cooldown Bars (3, 0 = off), Same-bar Entry/Exit Exclusivity (on), Extra Exit: CCI Zero Cross (off).
• Risk (ATR): enable/disable TP/SL levels, ATR length (14), Stop Loss xATR (2.0), Take Profit xATR (3.0).
• Visual: toggles for labels, position background, and dashboard.
█ FEATURES
• Buy/Sell labels with trigger price attached
• Position state machine with cooldown and same-bar exclusivity (signal spam eliminated)
• Optional CCI zero-cross exit, shown as orange XL/XS marks
• ATR-adaptive TP/SL reference levels (dashboard + data window)
• Position background tint (green long / red short) and a live dashboard panel
• Four alertcondition channels plus dynamic alerts including the signal price
█ SIGNALS
Visual Elements
• Buy (green up label): long swing-reversal entry.
• Sell (red down label): short swing-reversal entry; an opposite signal while holding flips the position.
• XL / XS (orange cross): optional exit when CCI crosses the zero line against the position.
• Background tint: light green = long state, light red = short state.
• Rainbow line: gradient RSI momentum; warm colors = strong upside momentum, cool colors = downside.
• Yellow / fuchsia CCI segments and fills: CCI traveling beyond the upper / lower band.
█ LIMITATIONS
• Oscillator-based: best suited to swing and ranging conditions; strong one-way trends can keep signals early against momentum.
• TP/SL levels are reference projections, not orders — this is an indicator, not a strategy.
• No performance outcome is promised; always forward-test on your market and timeframe.
• Not financial advice.
█ NOTES
• V2 of blackcat1402's classic L3 CCI-RSI Combo. The original 101-color gradient identity and core engine are preserved; V2 adds signal governance, exit logic, ATR risk references, visuals, and a complete alert set.
• Source is open under the Mozilla Public License 2.0 — study, reuse and attribution welcome.
════════════════════════════════════════════════════════════════════════
For questions or feedback, please use the comments section below.

Don't miss out! The first and most important thing to do is to join my Discord chat now! Click here to start your adventure: discord.com/invite/ZTGpQJq My new github for more pine development soon: github.com/wxt-coder
Wyłączenie odpowiedzialności
Informacje i publikacje nie stanowią i nie powinny być traktowane jako porady finansowe, inwestycyjne, tradingowe ani jakiekolwiek inne rekomendacje dostarczane lub zatwierdzone przez TradingView. Więcej informacji znajduje się w Warunkach użytkowania.
Don't miss out! The first and most important thing to do is to join my Discord chat now! Click here to start your adventure: discord.com/invite/ZTGpQJq My new github for more pine development soon: github.com/wxt-coder
Wyłączenie odpowiedzialności
Informacje i publikacje nie stanowią i nie powinny być traktowane jako porady finansowe, inwestycyjne, tradingowe ani jakiekolwiek inne rekomendacje dostarczane lub zatwierdzone przez TradingView. Więcej informacji znajduje się w Warunkach użytkowania.