OPEN-SOURCE SCRIPT
Daily Bias Visual Pro Fran_Pineda
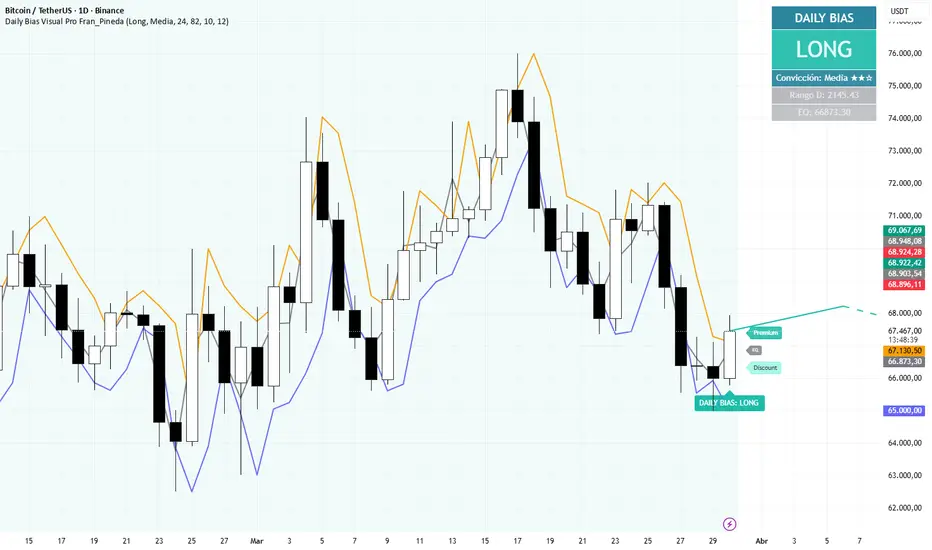
Daily Bias Visual Pro — Description
Daily Bias Visual Pro is a visual TradingView indicator designed to display the market’s daily directional bias in a clear, elegant, and highly intuitive way.
Instead of relying on a complex ruleset, this tool allows the trader to manually define the daily bias as Long or Short, then transforms the chart appearance to match that directional view. The result is a cleaner decision-making environment with immediate visual context.
The indicator is built for traders who want their chart to communicate bias at a glance, without turning it into a Christmas tree of random signals.
Main features
1. Manual Daily Bias Selection
The user can switch the bias between:
Long
Short
When set to Long, the indicator adopts a bullish visual structure.
When set to Short, it automatically shifts into a bearish visual layout.
2. Daily Range Visualization
The script pulls the current daily high and low and divides that range into two key zones:
Premium
Discount
It also plots the daily equilibrium (EQ), giving a fast visual reference for where price is trading within the current daily range.
3. Previous Day High and Low
The indicator can display the previous day’s:
High
Low
This helps traders keep important reference liquidity levels visible directly on the chart.
4. Projection Path
A stylized forward projection is drawn on the chart to represent the chosen directional bias:
upward path for Long
downward path for Short
This is not a prediction engine or auto-forecasting model. It is a visual bias guide, designed to reinforce directional context.
5. Bias Dashboard Panel
A clean panel in the top-right corner shows:
current daily bias
conviction level
daily range size
equilibrium price
This gives the chart a structured and polished look while keeping key information easy to read.
6. Background Tint and Visual Aesthetics
The script includes subtle background tinting and zone coloring to improve readability without overwhelming price action.
Its purpose is not just function, but presentation — because a good chart should think clearly and look the part too.
How it works
The script uses daily timeframe data through request.security() to retrieve:
current daily high
current daily low
previous daily high
previous daily low
From that, it calculates:
the current daily range
the equilibrium level
premium and discount zones
The user-defined bias then controls the full visual theme of the indicator, including:
colors
labels
projection direction
dashboard styling
Best use case
This indicator is ideal for traders who:
build a directional narrative before execution
want a clean chart bias framework
prefer a visual decision-support tool over automated entry signals
manually define whether the day is more likely bullish or bearish
It works especially well as a top-down bias layer before using lower-timeframe execution models.
Important note
This indicator does not generate automatic trade signals.
It is a visual bias tool, not a strategy engine.
Its main purpose is to help traders frame the day, organize chart context, and keep directional thinking consistent.
Suggested short publishing version
Daily Bias Visual Pro is a visual TradingView indicator that helps traders define and display the daily market bias in a clean and attractive way. By selecting Long or Short, the script automatically adapts the chart’s visual structure, including premium/discount zones, equilibrium, previous day levels, a directional projection path, and a bias dashboard. It is designed as a decision-support and chart-context tool, not as an automatic signal generator.
Daily Bias Visual Pro is a visual TradingView indicator designed to display the market’s daily directional bias in a clear, elegant, and highly intuitive way.
Instead of relying on a complex ruleset, this tool allows the trader to manually define the daily bias as Long or Short, then transforms the chart appearance to match that directional view. The result is a cleaner decision-making environment with immediate visual context.
The indicator is built for traders who want their chart to communicate bias at a glance, without turning it into a Christmas tree of random signals.
Main features
1. Manual Daily Bias Selection
The user can switch the bias between:
Long
Short
When set to Long, the indicator adopts a bullish visual structure.
When set to Short, it automatically shifts into a bearish visual layout.
2. Daily Range Visualization
The script pulls the current daily high and low and divides that range into two key zones:
Premium
Discount
It also plots the daily equilibrium (EQ), giving a fast visual reference for where price is trading within the current daily range.
3. Previous Day High and Low
The indicator can display the previous day’s:
High
Low
This helps traders keep important reference liquidity levels visible directly on the chart.
4. Projection Path
A stylized forward projection is drawn on the chart to represent the chosen directional bias:
upward path for Long
downward path for Short
This is not a prediction engine or auto-forecasting model. It is a visual bias guide, designed to reinforce directional context.
5. Bias Dashboard Panel
A clean panel in the top-right corner shows:
current daily bias
conviction level
daily range size
equilibrium price
This gives the chart a structured and polished look while keeping key information easy to read.
6. Background Tint and Visual Aesthetics
The script includes subtle background tinting and zone coloring to improve readability without overwhelming price action.
Its purpose is not just function, but presentation — because a good chart should think clearly and look the part too.
How it works
The script uses daily timeframe data through request.security() to retrieve:
current daily high
current daily low
previous daily high
previous daily low
From that, it calculates:
the current daily range
the equilibrium level
premium and discount zones
The user-defined bias then controls the full visual theme of the indicator, including:
colors
labels
projection direction
dashboard styling
Best use case
This indicator is ideal for traders who:
build a directional narrative before execution
want a clean chart bias framework
prefer a visual decision-support tool over automated entry signals
manually define whether the day is more likely bullish or bearish
It works especially well as a top-down bias layer before using lower-timeframe execution models.
Important note
This indicator does not generate automatic trade signals.
It is a visual bias tool, not a strategy engine.
Its main purpose is to help traders frame the day, organize chart context, and keep directional thinking consistent.
Suggested short publishing version
Daily Bias Visual Pro is a visual TradingView indicator that helps traders define and display the daily market bias in a clean and attractive way. By selecting Long or Short, the script automatically adapts the chart’s visual structure, including premium/discount zones, equilibrium, previous day levels, a directional projection path, and a bias dashboard. It is designed as a decision-support and chart-context tool, not as an automatic signal generator.
Skrypt open-source
W zgodzie z duchem TradingView twórca tego skryptu udostępnił go jako open-source, aby użytkownicy mogli przejrzeć i zweryfikować jego działanie. Ukłony dla autora. Korzystanie jest bezpłatne, jednak ponowna publikacja kodu podlega naszym Zasadom serwisu.

Wyłączenie odpowiedzialności
Informacje i publikacje nie stanowią i nie powinny być traktowane jako porady finansowe, inwestycyjne, tradingowe ani jakiekolwiek inne rekomendacje dostarczane lub zatwierdzone przez TradingView. Więcej informacji znajduje się w Warunkach użytkowania.
Skrypt open-source
W zgodzie z duchem TradingView twórca tego skryptu udostępnił go jako open-source, aby użytkownicy mogli przejrzeć i zweryfikować jego działanie. Ukłony dla autora. Korzystanie jest bezpłatne, jednak ponowna publikacja kodu podlega naszym Zasadom serwisu.
Wyłączenie odpowiedzialności
Informacje i publikacje nie stanowią i nie powinny być traktowane jako porady finansowe, inwestycyjne, tradingowe ani jakiekolwiek inne rekomendacje dostarczane lub zatwierdzone przez TradingView. Więcej informacji znajduje się w Warunkach użytkowania.