D/W/M EMA (Auto Bar-Count Period)
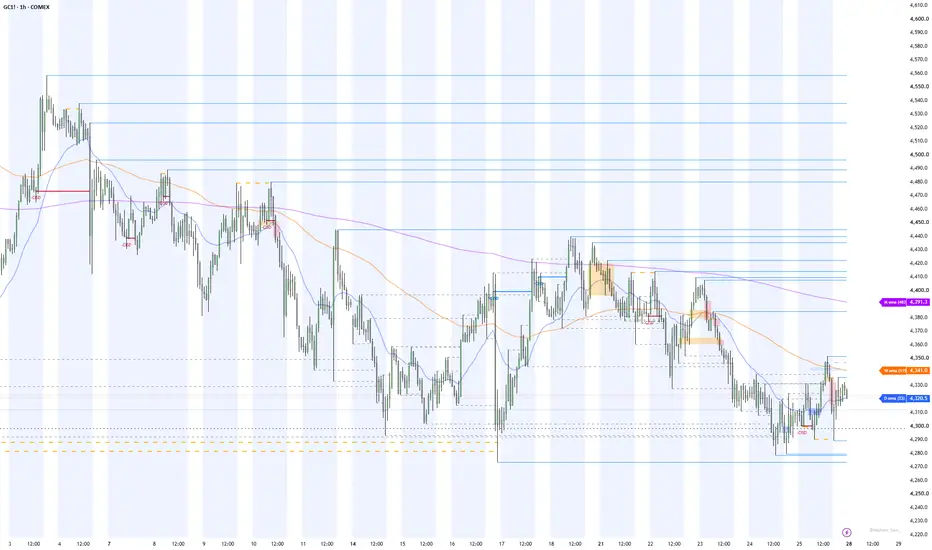
D/W/M EMA (Auto Bar-Count Period)
This indicator plots three EMAs — Daily, Weekly, and Monthly — directly on your current chart timeframe, without using higher-timeframe security() calls.
How it works:
Instead of pulling daily/weekly/monthly candles from a higher timeframe, the script counts how many bars of your current chart timeframe make up one full trading day, one full week, and one full month. It then uses that bar count as the EMA length, calculated natively on your chart's own resolution.
For example, on a 5-minute chart, if a trading session contains 78 five-minute bars, the "Daily EMA" becomes a 78-period EMA computed on the 5-minute chart itself — effectively approximating a daily EMA's behavior while staying perfectly in sync with your intraday price action, with no repainting or timeframe-alignment issues.
The bar count auto-adjusts to whatever timeframe you're viewing, so switching charts (1m, 5m, 1H, etc.) automatically recalculates the correct EMA length for each period.
Features:
Three independent EMAs: Daily, Weekly, Monthly — each with its own color and on/off toggle
Adjustable EMA source (close, open, hl2, etc.)
Adjustable line width
Right-side labels showing each EMA's value and its current calculated period length (e.g., "D ema (78)")
Runs entirely on the chart's native timeframe — no higher-timeframe data requests
Notes:
The very first day/week/month on the chart uses a fallback starting length until one full period has completed and a real bar count is established.
This is a technical analysis tool and does not constitute financial advice. Past performance and indicator signals do not guarantee future results — always use proper risk management.
This indicator plots three EMAs — Daily, Weekly, and Monthly — directly on your current chart timeframe, without using higher-timeframe security() calls.
How it works:
Instead of pulling daily/weekly/monthly candles from a higher timeframe, the script counts how many bars of your current chart timeframe make up one full trading day, one full week, and one full month. It then uses that bar count as the EMA length, calculated natively on your chart's own resolution.
For example, on a 5-minute chart, if a trading session contains 78 five-minute bars, the "Daily EMA" becomes a 78-period EMA computed on the 5-minute chart itself — effectively approximating a daily EMA's behavior while staying perfectly in sync with your intraday price action, with no repainting or timeframe-alignment issues.
The bar count auto-adjusts to whatever timeframe you're viewing, so switching charts (1m, 5m, 1H, etc.) automatically recalculates the correct EMA length for each period.
Features:
Three independent EMAs: Daily, Weekly, Monthly — each with its own color and on/off toggle
Adjustable EMA source (close, open, hl2, etc.)
Adjustable line width
Right-side labels showing each EMA's value and its current calculated period length (e.g., "D ema (78)")
Runs entirely on the chart's native timeframe — no higher-timeframe data requests
Notes:
The very first day/week/month on the chart uses a fallback starting length until one full period has completed and a real bar count is established.
This is a technical analysis tool and does not constitute financial advice. Past performance and indicator signals do not guarantee future results — always use proper risk management.

Wyłączenie odpowiedzialności
Informacje i publikacje nie stanowią i nie powinny być traktowane jako porady finansowe, inwestycyjne, tradingowe ani jakiekolwiek inne rekomendacje dostarczane lub zatwierdzone przez TradingView. Więcej informacji znajduje się w Warunkach użytkowania.
Wyłączenie odpowiedzialności
Informacje i publikacje nie stanowią i nie powinny być traktowane jako porady finansowe, inwestycyjne, tradingowe ani jakiekolwiek inne rekomendacje dostarczane lub zatwierdzone przez TradingView. Więcej informacji znajduje się w Warunkach użytkowania.