Cross-Asset Regime Oscillator
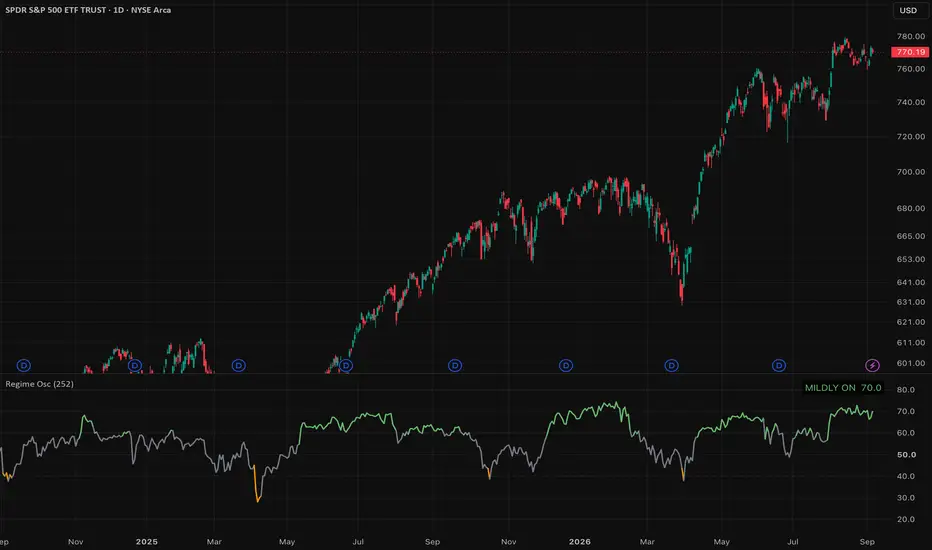
A daily 0–100 gauge of US market risk appetite, built from five cross-asset
signals rather than price alone. It answers one question: is the broader
tape leaning risk-on or risk-off right now?
METHOD
Each signal is z-scored against its own trailing distribution on daily bars
("Lookback (bars)" input, default 252 ≈ one trading year, range 60–1000),
clamped to ±3 so no single blown-out signal dominates, averaged with equal
weight, then mapped linearly onto 0–100. The lookback always counts daily
bars, whatever the chart timeframe.
SIGNALS (all free-tier data, no premium feeds)
1. Credit — HYG/IEF: high yield vs. Treasuries. Higher = risk-on.
2. Equity volatility — VIX, inverted. Lower vol = risk-on.
3. Cyclical vs. defensive — XLI/XLU: industrials vs. utilities. Higher = risk-on.
4. Yield curve — US10Y minus US03MY (10-year minus 3-month). Steeper = risk-on.
5. US dollar — DXY, inverted. Weaker dollar = risk-on.
READING IT
0–20 RISK-OFF · 20–40 MILDLY OFF · 40–60 NEUTRAL · 60–80 MILDLY ON · 80–100 RISK-ON
The line is colored by band, with dotted guides at 20/40/60/80, and the
corner readout shows the current band and score. Enable "Show signal
breakdown" to see each signal's clamped z-score and the composite in the
corner table — useful for seeing WHICH channel is driving a move (e.g. credit
still positive while vol and cyclicals roll over). "Color chart bars by
regime" paints the price bars with the band color.
MISSING DATA
A signal that has not loaded, has fewer daily bars than the lookback, or is
flat over the lookback is skipped, and the composite averages the rest. The
readout warns when fewer than 3 of the 5 signals have data.
NON-REPAINTING
Every value is the clamped z-score of the last CONFIRMED daily bar, computed
inside the daily security context. The one-bar offset makes the request
confirmed-only, so the forming daily bar never leaks in and values never
change on refresh. Each day's value is aligned to the start of the daily
period, so the reading is identical on every supported chart timeframe.
During a live session the reading reflects the prior session's close.
SUPPORTED TIMEFRAMES
Daily and intraday charts. On any chart timeframe above daily (weekly,
monthly, multi-day) the script stops with a runtime error by design:
"Cross-Asset Regime Oscillator is a daily indicator. Use a 1D or lower
chart timeframe." It is a daily oscillator, and above-daily requests cannot
be pinned reliably to the same confirmed session.
LIMITATIONS
This is a deliberately simple, transparent construction: equal weights, one
lookback, five signals. It describes current conditions; it does not
forecast. Short lookbacks react fast and can whipsaw. Not investment advice.
signals rather than price alone. It answers one question: is the broader
tape leaning risk-on or risk-off right now?
METHOD
Each signal is z-scored against its own trailing distribution on daily bars
("Lookback (bars)" input, default 252 ≈ one trading year, range 60–1000),
clamped to ±3 so no single blown-out signal dominates, averaged with equal
weight, then mapped linearly onto 0–100. The lookback always counts daily
bars, whatever the chart timeframe.
SIGNALS (all free-tier data, no premium feeds)
1. Credit — HYG/IEF: high yield vs. Treasuries. Higher = risk-on.
2. Equity volatility — VIX, inverted. Lower vol = risk-on.
3. Cyclical vs. defensive — XLI/XLU: industrials vs. utilities. Higher = risk-on.
4. Yield curve — US10Y minus US03MY (10-year minus 3-month). Steeper = risk-on.
5. US dollar — DXY, inverted. Weaker dollar = risk-on.
READING IT
0–20 RISK-OFF · 20–40 MILDLY OFF · 40–60 NEUTRAL · 60–80 MILDLY ON · 80–100 RISK-ON
The line is colored by band, with dotted guides at 20/40/60/80, and the
corner readout shows the current band and score. Enable "Show signal
breakdown" to see each signal's clamped z-score and the composite in the
corner table — useful for seeing WHICH channel is driving a move (e.g. credit
still positive while vol and cyclicals roll over). "Color chart bars by
regime" paints the price bars with the band color.
MISSING DATA
A signal that has not loaded, has fewer daily bars than the lookback, or is
flat over the lookback is skipped, and the composite averages the rest. The
readout warns when fewer than 3 of the 5 signals have data.
NON-REPAINTING
Every value is the clamped z-score of the last CONFIRMED daily bar, computed
inside the daily security context. The one-bar offset makes the request
confirmed-only, so the forming daily bar never leaks in and values never
change on refresh. Each day's value is aligned to the start of the daily
period, so the reading is identical on every supported chart timeframe.
During a live session the reading reflects the prior session's close.
SUPPORTED TIMEFRAMES
Daily and intraday charts. On any chart timeframe above daily (weekly,
monthly, multi-day) the script stops with a runtime error by design:
"Cross-Asset Regime Oscillator is a daily indicator. Use a 1D or lower
chart timeframe." It is a daily oscillator, and above-daily requests cannot
be pinned reliably to the same confirmed session.
LIMITATIONS
This is a deliberately simple, transparent construction: equal weights, one
lookback, five signals. It describes current conditions; it does not
forecast. Short lookbacks react fast and can whipsaw. Not investment advice.

Wyłączenie odpowiedzialności
Informacje i publikacje nie stanowią i nie powinny być traktowane jako porady finansowe, inwestycyjne, tradingowe ani jakiekolwiek inne rekomendacje dostarczane lub zatwierdzone przez TradingView. Więcej informacji znajduje się w Warunkach użytkowania.
Wyłączenie odpowiedzialności
Informacje i publikacje nie stanowią i nie powinny być traktowane jako porady finansowe, inwestycyjne, tradingowe ani jakiekolwiek inne rekomendacje dostarczane lub zatwierdzone przez TradingView. Więcej informacji znajduje się w Warunkach użytkowania.