LCA Indicator
LCA Indicator
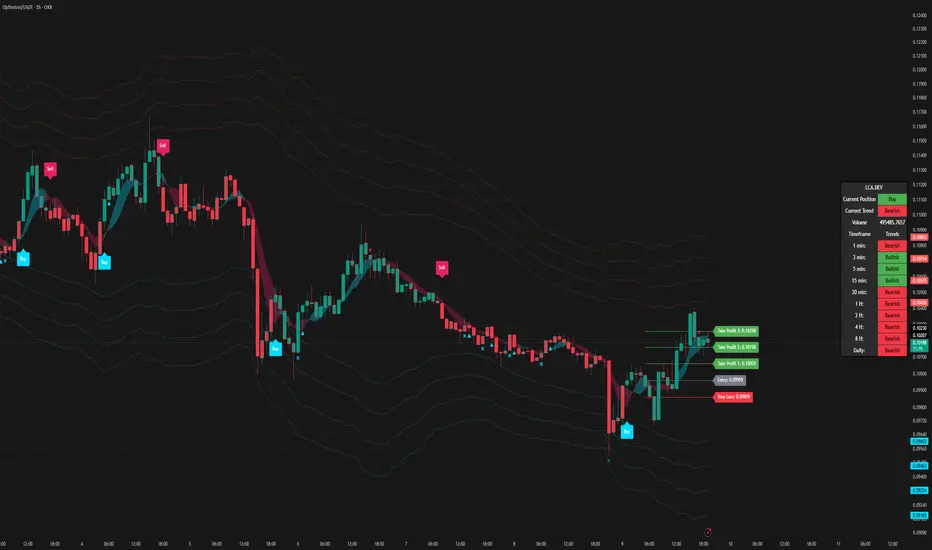
An all-in-one overlay for trend trading. It prints Buy and Sell signals from a range filter and draws an entry, a stop and three targets for the latest signal. Around that it adds context: a short-term trend ribbon, WaveTrend exhaustion and divergence marks, RSI stretch warnings, volatility bands, and a dashboard that shows the trend on ten timeframes at once.
It is a chart-reading and planning tool. It does not trade for you, and it does not filter the signals for you: you decide which ones to take.
━━━━━━━━━━━━━━━━━━━━
HOW THE PARTS FIT TOGETHER
━━━━━━━━━━━━━━━━━━━━
• The range filter sets the main direction and gives the trade signals.
• The dashboard shows whether the higher timeframes agree with that direction.
• The WaveTrend marks, RSI diamonds and reversal bands warn when a move is stretched and may pause or turn. That helps with taking profit, or with skipping a late entry.
• The entry, stop and targets turn the latest signal into a plan with a fixed risk.
━━━━━━━━━━━━━━━━━━━━
BUY & SELL SIGNALS (RANGE FILTER)
━━━━━━━━━━━━━━━━━━━━
The range filter is a line that follows price but ignores small moves. It only moves when price travels further than a set range away from it, so normal bar-to-bar noise leaves it in place.
• The range is the average of two smoothed measures of the typical bar-to-bar move: a fast one (27 bars, × 1.5) and a slow one (55 bars, × Sensitivity).
• Buy: the close is above the filter and the filter's last move was up.
• Sell: the close is below the filter and the filter's last move was down.
• Signals alternate. A new Buy only prints after a Sell, and the other way round.
• Candles are coloured by the filter's last move: green after it moved up, red after it moved down.
Sensitivity (1 to 6, default 3) sets the width of the range. Higher values give fewer, later signals that hold through bigger pullbacks. Lower values react faster but flip more often in sideways markets.
Signals are calculated on the bar's close. On the live bar a signal can appear and disappear until the bar closes. A signal on a closed bar does not change.
━━━━━━━━━━━━━━━━━━━━
ENTRY, STOP AND TARGETS
━━━━━━━━━━━━━━━━━━━━
For the latest signal the script draws:
• Entry: the close of the signal bar.
• Stop Loss: a fixed percentage away from the entry (Stop Loss %, default 1%).
• Take Profit 1, 2 and 3: one, two and three times the stop distance beyond the entry (1R, 2R and 3R).
The levels stay on the chart until the next signal replaces them. The script does not check whether they were hit. Set Stop Loss % to 0 to hide them.
━━━━━━━━━━━━━━━━━━━━
TREND RIBBON
━━━━━━━━━━━━━━━━━━━━
A band between a 5-period and an 8-period simple moving average of the close. It is cyan when the faster average is above the slower one and pink when it is below. It shows the short-term direction and turns earlier than the range filter.
━━━━━━━━━━━━━━━━━━━━
WAVETREND MARKS
━━━━━━━━━━━━━━━━━━━━
WaveTrend is a momentum oscillator (channel 9, average 12, calculated on hlc3). Two kinds of marks come from it, and both are always shown.
Mild Buy / Mild Sell (small ×)
• The WaveTrend line crosses its signal line deep in oversold territory (signal at or below −53) or deep in overbought territory (at or above +53). Momentum is turning after a stretched move.
Divergence Buy / Divergence Sell (small triangles)
• Buy: price makes a lower low while WaveTrend makes a higher low.
• Sell: price makes a higher high while WaveTrend makes a lower high.
• Turning points are 5-bar peaks and troughs of the WaveTrend signal line, each compared with the previous one. Lows must be at or below −40 and highs at or above +15. A second, stricter check uses −65 and +45. Either check can print a triangle.
• A turning point is confirmed two bars later, so the triangle prints two bars after it.
━━━━━━━━━━━━━━━━━━━━
REVERSAL DIAMONDS (RSI)
━━━━━━━━━━━━━━━━━━━━
Faint diamonds mark stretched conditions on a 21-period RSI:
• Above the bar: RSI is above 70 and above its own 10-period EMA, so it is still pushing higher.
• Below the bar: RSI is below 30 and below its 10-period EMA.
They print on every bar while the condition holds. Read them as "stretched, don't chase" rather than as entries.
━━━━━━━━━━━━━━━━━━━━
REVERSAL BANDS
━━━━━━━━━━━━━━━━━━━━
Four bands above and four below a 30-period simple moving average, at 3, 4, 5 and 6 times the 30-period ATR (Keltner-style). The further out price reaches, the more stretched it is from its average. The length is adjustable.
━━━━━━━━━━━━━━━━━━━━
OPTIONAL OVERLAYS (OFF BY DEFAULT)
━━━━━━━━━━━━━━━━━━━━
• Previous Day High / Low / Close: yesterday's levels as lines across the chart, labelled P.D.H, P.D.L and P.D.C. They come from the completed daily bar, so they do not repaint. Colour, width, line style and label size are adjustable.
• EMAs: three exponential moving averages, 7, 21 and 144 by default, each with its own source and length.
• Swing Points: pivot highs and lows with 10 bars on each side. Highs are labelled HH or LH against the previous pivot high, lows HL or LL against the previous pivot low. A pivot is only known 10 bars later, so each label appears 10 bars after the turn and is drawn back on the pivot bar.
━━━━━━━━━━━━━━━━━━━━
TREND DASHBOARD
━━━━━━━━━━━━━━━━━━━━
• Current Position: Buy or Sell, the side of the latest range-filter signal.
• Current Trend: Bullish when the close is above the 144-period EMA on the chart's timeframe, Bearish when it is below. This EMA is fixed at 144 and does not follow the EMA settings.
• Volume: the volume of the current bar.
• 1 min to Daily: the same 144-EMA test on ten timeframes (1m, 3m, 5m, 15m, 30m, 1H, 2H, 4H, 8H and 1D).
How the timeframe rows are read:
• Timeframes above the chart's use the current bar of that timeframe, so the row can change until that bar closes.
• Timeframes below the chart's use the latest lower-timeframe bar inside the current chart bar.
• On weekly charts the 1m row uses 3m data. On monthly charts the rows below 10m use 10m data.
━━━━━━━━━━━━━━━━━━━━
SETTINGS
━━━━━━━━━━━━━━━━━━━━
• Buy & Sell Signals: on/off, Sensitivity, Stop Loss %, and Signals Offset (how far the labels sit from the candles).
• Trend Ribbon: on/off and the two lengths.
• Reversal Signals and Reversal Bands: on/off and the band length.
• Previous Day High Low Close, EMA and Swing Points: on/off and style.
• Trend Dashboard: on/off, position, size, text colour and background colour.
━━━━━━━━━━━━━━━━━━━━
ALERTS
━━━━━━━━━━━━━━━━━━━━
• One alert for everything: create an alert on "Any alert() function call". It fires once per bar close on Buy, Sell, Mild Buy, Mild Sell, Divergence Buy and Divergence Sell, and the message says which one. If several land on the same bar, only one message is sent, and Buy and Sell take priority over the others.
• Separate alert conditions are also available: Buy, Sell, Either Buy or Sell, Divergence Buy, Divergence Sell, Mild Buy, Mild Sell, Reversal (RSI), Blue Trend Ribbon, Red Trend Ribbon and Trend Ribbon Color Change. For these, choose "Once Per Bar Close", so you are not alerted to a signal that disappears before the bar closes.
━━━━━━━━━━━━━━━━━━━━
NOTES AND LIMITS
━━━━━━━━━━━━━━━━━━━━
• Like any trend filter, the range filter is late at turns and can flip back and forth in sideways markets. The dashboard and the ribbon help you judge whether a signal goes with the bigger trend.
• Divergence triangles appear 2 bars after the turning point and swing labels 10 bars after it, because both need later bars to confirm.
• The stop and targets are a fixed-percentage plan for the latest signal, not a backtest. The script does not track results.
• It works on any market and timeframe.
This script is for education and chart analysis and is not financial advice. Past signals do not guarantee future results. Manage your risk.
An all-in-one overlay for trend trading. It prints Buy and Sell signals from a range filter and draws an entry, a stop and three targets for the latest signal. Around that it adds context: a short-term trend ribbon, WaveTrend exhaustion and divergence marks, RSI stretch warnings, volatility bands, and a dashboard that shows the trend on ten timeframes at once.
It is a chart-reading and planning tool. It does not trade for you, and it does not filter the signals for you: you decide which ones to take.
━━━━━━━━━━━━━━━━━━━━
HOW THE PARTS FIT TOGETHER
━━━━━━━━━━━━━━━━━━━━
• The range filter sets the main direction and gives the trade signals.
• The dashboard shows whether the higher timeframes agree with that direction.
• The WaveTrend marks, RSI diamonds and reversal bands warn when a move is stretched and may pause or turn. That helps with taking profit, or with skipping a late entry.
• The entry, stop and targets turn the latest signal into a plan with a fixed risk.
━━━━━━━━━━━━━━━━━━━━
BUY & SELL SIGNALS (RANGE FILTER)
━━━━━━━━━━━━━━━━━━━━
The range filter is a line that follows price but ignores small moves. It only moves when price travels further than a set range away from it, so normal bar-to-bar noise leaves it in place.
• The range is the average of two smoothed measures of the typical bar-to-bar move: a fast one (27 bars, × 1.5) and a slow one (55 bars, × Sensitivity).
• Buy: the close is above the filter and the filter's last move was up.
• Sell: the close is below the filter and the filter's last move was down.
• Signals alternate. A new Buy only prints after a Sell, and the other way round.
• Candles are coloured by the filter's last move: green after it moved up, red after it moved down.
Sensitivity (1 to 6, default 3) sets the width of the range. Higher values give fewer, later signals that hold through bigger pullbacks. Lower values react faster but flip more often in sideways markets.
Signals are calculated on the bar's close. On the live bar a signal can appear and disappear until the bar closes. A signal on a closed bar does not change.
━━━━━━━━━━━━━━━━━━━━
ENTRY, STOP AND TARGETS
━━━━━━━━━━━━━━━━━━━━
For the latest signal the script draws:
• Entry: the close of the signal bar.
• Stop Loss: a fixed percentage away from the entry (Stop Loss %, default 1%).
• Take Profit 1, 2 and 3: one, two and three times the stop distance beyond the entry (1R, 2R and 3R).
The levels stay on the chart until the next signal replaces them. The script does not check whether they were hit. Set Stop Loss % to 0 to hide them.
━━━━━━━━━━━━━━━━━━━━
TREND RIBBON
━━━━━━━━━━━━━━━━━━━━
A band between a 5-period and an 8-period simple moving average of the close. It is cyan when the faster average is above the slower one and pink when it is below. It shows the short-term direction and turns earlier than the range filter.
━━━━━━━━━━━━━━━━━━━━
WAVETREND MARKS
━━━━━━━━━━━━━━━━━━━━
WaveTrend is a momentum oscillator (channel 9, average 12, calculated on hlc3). Two kinds of marks come from it, and both are always shown.
Mild Buy / Mild Sell (small ×)
• The WaveTrend line crosses its signal line deep in oversold territory (signal at or below −53) or deep in overbought territory (at or above +53). Momentum is turning after a stretched move.
Divergence Buy / Divergence Sell (small triangles)
• Buy: price makes a lower low while WaveTrend makes a higher low.
• Sell: price makes a higher high while WaveTrend makes a lower high.
• Turning points are 5-bar peaks and troughs of the WaveTrend signal line, each compared with the previous one. Lows must be at or below −40 and highs at or above +15. A second, stricter check uses −65 and +45. Either check can print a triangle.
• A turning point is confirmed two bars later, so the triangle prints two bars after it.
━━━━━━━━━━━━━━━━━━━━
REVERSAL DIAMONDS (RSI)
━━━━━━━━━━━━━━━━━━━━
Faint diamonds mark stretched conditions on a 21-period RSI:
• Above the bar: RSI is above 70 and above its own 10-period EMA, so it is still pushing higher.
• Below the bar: RSI is below 30 and below its 10-period EMA.
They print on every bar while the condition holds. Read them as "stretched, don't chase" rather than as entries.
━━━━━━━━━━━━━━━━━━━━
REVERSAL BANDS
━━━━━━━━━━━━━━━━━━━━
Four bands above and four below a 30-period simple moving average, at 3, 4, 5 and 6 times the 30-period ATR (Keltner-style). The further out price reaches, the more stretched it is from its average. The length is adjustable.
━━━━━━━━━━━━━━━━━━━━
OPTIONAL OVERLAYS (OFF BY DEFAULT)
━━━━━━━━━━━━━━━━━━━━
• Previous Day High / Low / Close: yesterday's levels as lines across the chart, labelled P.D.H, P.D.L and P.D.C. They come from the completed daily bar, so they do not repaint. Colour, width, line style and label size are adjustable.
• EMAs: three exponential moving averages, 7, 21 and 144 by default, each with its own source and length.
• Swing Points: pivot highs and lows with 10 bars on each side. Highs are labelled HH or LH against the previous pivot high, lows HL or LL against the previous pivot low. A pivot is only known 10 bars later, so each label appears 10 bars after the turn and is drawn back on the pivot bar.
━━━━━━━━━━━━━━━━━━━━
TREND DASHBOARD
━━━━━━━━━━━━━━━━━━━━
• Current Position: Buy or Sell, the side of the latest range-filter signal.
• Current Trend: Bullish when the close is above the 144-period EMA on the chart's timeframe, Bearish when it is below. This EMA is fixed at 144 and does not follow the EMA settings.
• Volume: the volume of the current bar.
• 1 min to Daily: the same 144-EMA test on ten timeframes (1m, 3m, 5m, 15m, 30m, 1H, 2H, 4H, 8H and 1D).
How the timeframe rows are read:
• Timeframes above the chart's use the current bar of that timeframe, so the row can change until that bar closes.
• Timeframes below the chart's use the latest lower-timeframe bar inside the current chart bar.
• On weekly charts the 1m row uses 3m data. On monthly charts the rows below 10m use 10m data.
━━━━━━━━━━━━━━━━━━━━
SETTINGS
━━━━━━━━━━━━━━━━━━━━
• Buy & Sell Signals: on/off, Sensitivity, Stop Loss %, and Signals Offset (how far the labels sit from the candles).
• Trend Ribbon: on/off and the two lengths.
• Reversal Signals and Reversal Bands: on/off and the band length.
• Previous Day High Low Close, EMA and Swing Points: on/off and style.
• Trend Dashboard: on/off, position, size, text colour and background colour.
━━━━━━━━━━━━━━━━━━━━
ALERTS
━━━━━━━━━━━━━━━━━━━━
• One alert for everything: create an alert on "Any alert() function call". It fires once per bar close on Buy, Sell, Mild Buy, Mild Sell, Divergence Buy and Divergence Sell, and the message says which one. If several land on the same bar, only one message is sent, and Buy and Sell take priority over the others.
• Separate alert conditions are also available: Buy, Sell, Either Buy or Sell, Divergence Buy, Divergence Sell, Mild Buy, Mild Sell, Reversal (RSI), Blue Trend Ribbon, Red Trend Ribbon and Trend Ribbon Color Change. For these, choose "Once Per Bar Close", so you are not alerted to a signal that disappears before the bar closes.
━━━━━━━━━━━━━━━━━━━━
NOTES AND LIMITS
━━━━━━━━━━━━━━━━━━━━
• Like any trend filter, the range filter is late at turns and can flip back and forth in sideways markets. The dashboard and the ribbon help you judge whether a signal goes with the bigger trend.
• Divergence triangles appear 2 bars after the turning point and swing labels 10 bars after it, because both need later bars to confirm.
• The stop and targets are a fixed-percentage plan for the latest signal, not a backtest. The script does not track results.
• It works on any market and timeframe.
This script is for education and chart analysis and is not financial advice. Past signals do not guarantee future results. Manage your risk.

Wyłączenie odpowiedzialności
Informacje i publikacje nie stanowią i nie powinny być traktowane jako porady finansowe, inwestycyjne, tradingowe ani jakiekolwiek inne rekomendacje dostarczane lub zatwierdzone przez TradingView. Więcej informacji znajduje się w Warunkach użytkowania.
Wyłączenie odpowiedzialności
Informacje i publikacje nie stanowią i nie powinny być traktowane jako porady finansowe, inwestycyjne, tradingowe ani jakiekolwiek inne rekomendacje dostarczane lub zatwierdzone przez TradingView. Więcej informacji znajduje się w Warunkach użytkowania.