OPEN-SOURCE SCRIPT
Bias Status Dashboard
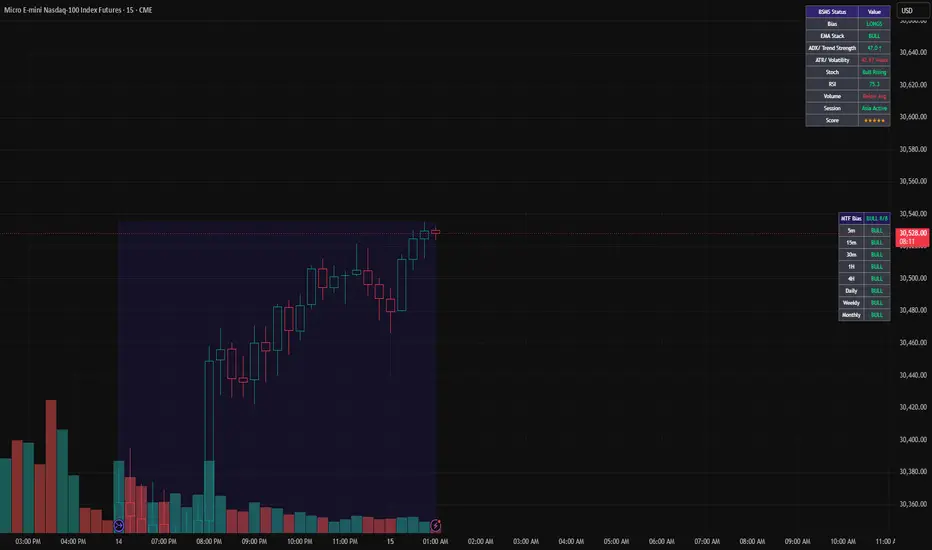
## Bias Status Dashboard
The Bias Status Dashboard is designed to give traders a quick visual read of the current market bias directly on the chart. It organizes market direction, projection zones, percentage references, and current symbol context into one clean dashboard.
This indicator is useful for traders who want to quickly determine whether price is leaning bullish, bearish, neutral/ranging, continuing, reversing, or becoming overextended.
## Main Features
* Displays current market bias in a simple dashboard format
* Identifies the current chart/symbol being analyzed
* Shows projection-based zones for normal, moderate, and extreme movement
* Includes percentage references to show how much of the projected move has been used
* Plots optional chart lines for upside and downside projection areas
* Helps identify when price still has room for continuation or may be stretched
* Organizes high and low projection zones in a clean, logical order
* Designed to reduce chart clutter while keeping important context visible
## Projection Zones
The dashboard separates movement into three main zones:
**Normal Zone** – Price is within a reasonable projected range.
**Moderate Zone** – Price is moving deeper into projection and should be watched more carefully.
**Extreme Zone** – Price is extended and may carry higher risk for late entries, exhaustion, or reversal behavior.
These zones can help traders avoid chasing trades after price has already moved too far.
## How to Use
Use the dashboard as a trade filter and market context tool.
A simple workflow:
1. Check the current bias.
2. Confirm whether the market is bullish, bearish, neutral, or extended.
3. Compare current price to the normal, moderate, and extreme zones.
4. Avoid late entries when price is already in an extreme area.
5. Use your own strategy for entries, stops, targets, and risk management.
This indicator is not meant to be a standalone buy or sell signal. It is designed to support analysis by showing where price currently sits within the projected movement range.
## Best For
* Intraday futures trading
* Bias confirmation
* Continuation trade filtering
* Reversal awareness
* Target planning
* Projection-based analysis
* Avoiding overextended entries
* Quick market condition review
This tool can be used across multiple futures and index markets, but users should test and adjust settings based on their preferred symbol, session, and timeframe.
## Disclaimer
This indicator does not guarantee future price direction or trade outcomes. It is intended for educational and analysis purposes only. Always use proper risk management and combine this tool with your own tested trading plan.
The Bias Status Dashboard is designed to give traders a quick visual read of the current market bias directly on the chart. It organizes market direction, projection zones, percentage references, and current symbol context into one clean dashboard.
This indicator is useful for traders who want to quickly determine whether price is leaning bullish, bearish, neutral/ranging, continuing, reversing, or becoming overextended.
## Main Features
* Displays current market bias in a simple dashboard format
* Identifies the current chart/symbol being analyzed
* Shows projection-based zones for normal, moderate, and extreme movement
* Includes percentage references to show how much of the projected move has been used
* Plots optional chart lines for upside and downside projection areas
* Helps identify when price still has room for continuation or may be stretched
* Organizes high and low projection zones in a clean, logical order
* Designed to reduce chart clutter while keeping important context visible
## Projection Zones
The dashboard separates movement into three main zones:
**Normal Zone** – Price is within a reasonable projected range.
**Moderate Zone** – Price is moving deeper into projection and should be watched more carefully.
**Extreme Zone** – Price is extended and may carry higher risk for late entries, exhaustion, or reversal behavior.
These zones can help traders avoid chasing trades after price has already moved too far.
## How to Use
Use the dashboard as a trade filter and market context tool.
A simple workflow:
1. Check the current bias.
2. Confirm whether the market is bullish, bearish, neutral, or extended.
3. Compare current price to the normal, moderate, and extreme zones.
4. Avoid late entries when price is already in an extreme area.
5. Use your own strategy for entries, stops, targets, and risk management.
This indicator is not meant to be a standalone buy or sell signal. It is designed to support analysis by showing where price currently sits within the projected movement range.
## Best For
* Intraday futures trading
* Bias confirmation
* Continuation trade filtering
* Reversal awareness
* Target planning
* Projection-based analysis
* Avoiding overextended entries
* Quick market condition review
This tool can be used across multiple futures and index markets, but users should test and adjust settings based on their preferred symbol, session, and timeframe.
## Disclaimer
This indicator does not guarantee future price direction or trade outcomes. It is intended for educational and analysis purposes only. Always use proper risk management and combine this tool with your own tested trading plan.
Skrypt open-source
W zgodzie z duchem TradingView twórca tego skryptu udostępnił go jako open-source, aby użytkownicy mogli przejrzeć i zweryfikować jego działanie. Ukłony dla autora. Korzystanie jest bezpłatne, jednak ponowna publikacja kodu podlega naszym Zasadom serwisu.

Wyłączenie odpowiedzialności
Informacje i publikacje nie stanowią i nie powinny być traktowane jako porady finansowe, inwestycyjne, tradingowe ani jakiekolwiek inne rekomendacje dostarczane lub zatwierdzone przez TradingView. Więcej informacji znajduje się w Warunkach użytkowania.
Skrypt open-source
W zgodzie z duchem TradingView twórca tego skryptu udostępnił go jako open-source, aby użytkownicy mogli przejrzeć i zweryfikować jego działanie. Ukłony dla autora. Korzystanie jest bezpłatne, jednak ponowna publikacja kodu podlega naszym Zasadom serwisu.
Wyłączenie odpowiedzialności
Informacje i publikacje nie stanowią i nie powinny być traktowane jako porady finansowe, inwestycyjne, tradingowe ani jakiekolwiek inne rekomendacje dostarczane lub zatwierdzone przez TradingView. Więcej informacji znajduje się w Warunkach użytkowania.