OPEN-SOURCE SCRIPT
ATR Normalized Relative Strength
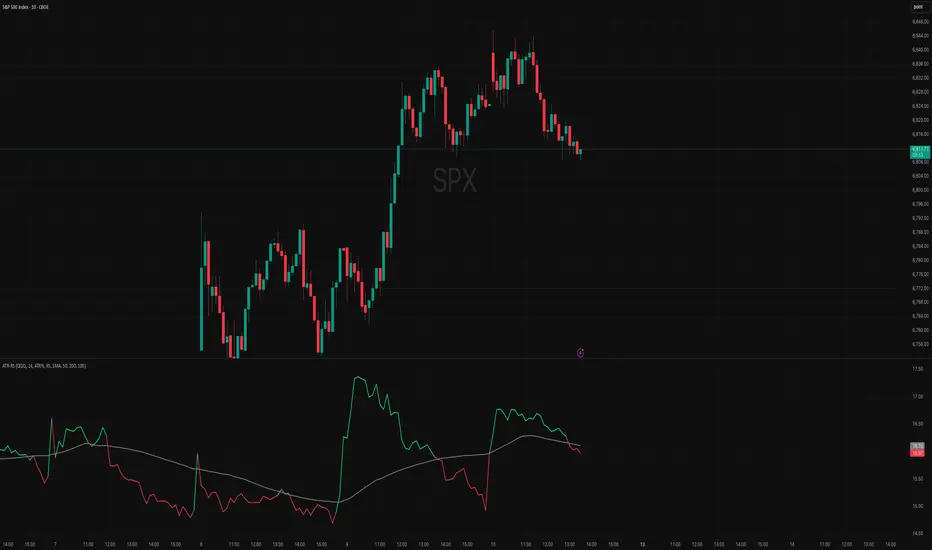
ATR Normalized Relative Strength
A relative strength indicator that compares a symbol's performance against a benchmark — but unlike standard RS lines, it normalizes both sides by their respective ATR (Average True Range) before computing the ratio. This adjusts for volatility differences between the symbol and benchmark, producing a cleaner relative strength reading that reflects true outperformance rather than raw price ratio changes driven by volatility mismatches.
What Makes This Original
Standard relative strength (price ratio of symbol to benchmark) has a well-known flaw: a high-volatility stock will appear to have erratic RS against a low-volatility benchmark, even if both are trending in the same direction. The RS line fluctuates with volatility, not just with relative performance.
This indicator solves this by normalizing each side by its own ATR before computing the ratio:
How the Components Work Together
The indicator chains three transforms that each serve a specific purpose:
Without step 1, the RS line would conflate volatility changes with relative performance changes. A stock that becomes more volatile would appear to strengthen against its benchmark even if the directional move is identical.
How It Works
RS Mode:
Mansfield Mode:
How to Use
For sector rotation: Compare sector ETFs against SPY or QQQ. Stocks with rising ATR-normalized RS are gaining relative strength adjusted for their volatility — a stronger signal than raw RS for identifying true sector leadership.
For stock screening: Stocks with RS above their MA (green) and rising are outperforming the benchmark on a volatility-adjusted basis. This filters out stocks that appear strong only because they are volatile.
For position management: Switch to Mansfield mode to see when a stock's relative strength is at historical extremes. A reading far above zero may indicate the outperformance is extended; near or below zero suggests the edge is fading.
For pair trading: The ATR normalization makes this indicator particularly useful for pairs where the two legs have different volatility profiles. The normalized ratio removes the volatility skew that would otherwise distort the spread.
Important Notes
Default Parameters
A relative strength indicator that compares a symbol's performance against a benchmark — but unlike standard RS lines, it normalizes both sides by their respective ATR (Average True Range) before computing the ratio. This adjusts for volatility differences between the symbol and benchmark, producing a cleaner relative strength reading that reflects true outperformance rather than raw price ratio changes driven by volatility mismatches.
What Makes This Original
Standard relative strength (price ratio of symbol to benchmark) has a well-known flaw: a high-volatility stock will appear to have erratic RS against a low-volatility benchmark, even if both are trending in the same direction. The RS line fluctuates with volatility, not just with relative performance.
This indicator solves this by normalizing each side by its own ATR before computing the ratio:
- ATR normalization — Each symbol's price is divided by its own ATR (or ATR as a percentage of price), effectively converting both into "volatility-adjusted units." The resulting RS ratio compares performance per unit of volatility — a much fairer comparison between assets of different volatility profiles.
- Two normalization modes — "ATR%" divides price by ATR-as-percent-of-price (better for comparing assets at different price levels like AAPL vs BRK.A). "ATR Price" divides price by raw ATR (better for comparing assets within similar price ranges).
- Dual display modes — Switch between a standard RS line (with configurable MA and color coding) and a Mansfield Relative Strength view (percentage deviation from a long-term MA, scaled for readability).
How the Components Work Together
The indicator chains three transforms that each serve a specific purpose:
- ATR normalization (step 1) removes the volatility component from each asset's price, producing a "volatility-adjusted price" for both the symbol and benchmark
- Ratio calculation (step 2) divides the normalized symbol by the normalized benchmark, yielding a relative strength reading that reflects directional outperformance independent of volatility differences
- MA overlay or Mansfield transform (step 3) provides trend context — in RS mode, the MA shows whether relative strength is improving or deteriorating; in Mansfield mode, the zero line crossing shows regime changes between outperformance and underperformance
Without step 1, the RS line would conflate volatility changes with relative performance changes. A stock that becomes more volatile would appear to strengthen against its benchmark even if the directional move is identical.
How It Works
RS Mode:
- Plots the ATR-normalized relative strength ratio as a line
- A configurable MA (SMA or EMA, default 50) provides the trend baseline
- When color-by-MA is enabled: green when RS is above the MA (outperforming), red when below (underperforming)
Mansfield Mode:
- Takes the ATR-normalized RS and computes: ((RS / SMA(RS, 200)) - 1) x 100
- This shows the percentage deviation of current RS from its long-term average
- Above zero = outperforming relative to historical norm; below zero = underperforming
- Scale factor is configurable (default 100) for readability across different assets
How to Use
For sector rotation: Compare sector ETFs against SPY or QQQ. Stocks with rising ATR-normalized RS are gaining relative strength adjusted for their volatility — a stronger signal than raw RS for identifying true sector leadership.
For stock screening: Stocks with RS above their MA (green) and rising are outperforming the benchmark on a volatility-adjusted basis. This filters out stocks that appear strong only because they are volatile.
For position management: Switch to Mansfield mode to see when a stock's relative strength is at historical extremes. A reading far above zero may indicate the outperformance is extended; near or below zero suggests the edge is fading.
For pair trading: The ATR normalization makes this indicator particularly useful for pairs where the two legs have different volatility profiles. The normalized ratio removes the volatility skew that would otherwise distort the spread.
Important Notes
This indicator does not repaint. All benchmark data is fetched using request.security() with barmerge.lookahead_off and barmerge.gaps_off, referencing only completed bars. The ATR normalization is applied independently to each symbol using their own ATR values — there is no cross-contamination of volatility data between the symbol and benchmark.
Default Parameters
- Compare To: NASDAQ:QQQ
- ATR Length: 14
- Normalization: ATR% (percentage-based)
- Display: RS mode
- RS MA Type: SMA | RS MA Length: 50 | Color by MA: enabled
- Mansfield Length: 200 | Mansfield Scale: 100
Skrypt open-source
W zgodzie z duchem TradingView twórca tego skryptu udostępnił go jako open-source, aby użytkownicy mogli przejrzeć i zweryfikować jego działanie. Ukłony dla autora. Korzystanie jest bezpłatne, jednak ponowna publikacja kodu podlega naszym Zasadom serwisu.

Wyłączenie odpowiedzialności
Informacje i publikacje nie stanowią i nie powinny być traktowane jako porady finansowe, inwestycyjne, tradingowe ani jakiekolwiek inne rekomendacje dostarczane lub zatwierdzone przez TradingView. Więcej informacji znajduje się w Warunkach użytkowania.
Skrypt open-source
W zgodzie z duchem TradingView twórca tego skryptu udostępnił go jako open-source, aby użytkownicy mogli przejrzeć i zweryfikować jego działanie. Ukłony dla autora. Korzystanie jest bezpłatne, jednak ponowna publikacja kodu podlega naszym Zasadom serwisu.
Wyłączenie odpowiedzialności
Informacje i publikacje nie stanowią i nie powinny być traktowane jako porady finansowe, inwestycyjne, tradingowe ani jakiekolwiek inne rekomendacje dostarczane lub zatwierdzone przez TradingView. Więcej informacji znajduje się w Warunkach użytkowania.