OPEN-SOURCE SCRIPT
Operebem VolumePRO
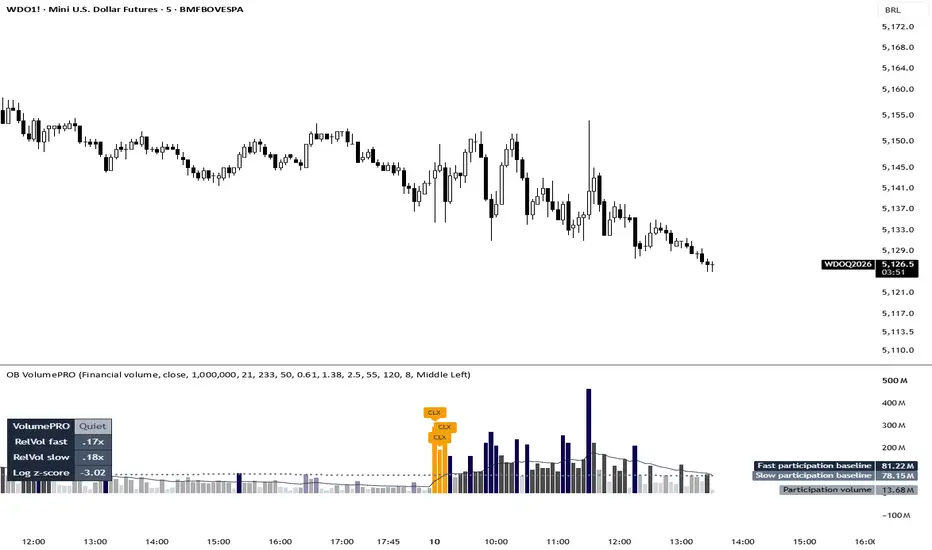
Operebem VolumePRO
Volume Participation Indicator for TradingView
Version: 1
Pine Script: v6
Type: Indicator (no automatic order execution)
DESCRIPTION
Operebem VolumePRO is a volume analysis indicator that classifies traded participation into four distinct regimes: Quiet, Normal, Expansion, and Climax.
It was designed to help traders quickly identify whether current volume is below recent behavior, within a normal range, above the short-term average, or in a statistically unusual concentration.
The indicator does not provide entries, exits, stop-loss, take-profit, or buy/sell recommendations. It should be used as additional context for price action, trend, market structure, and risk management.
HOW THE INDICATOR CALCULATES PARTICIPATION
The user can choose between three volume calculation modes:
Exchange Volume — Uses the raw volume series provided by the asset and broker on TradingView.
Financial Volume — Multiplies volume by the selected price (default: Close). Formula: volume × price.
Normalized Financial Volume — Multiplies volume by price and divides by the user-defined normalization divisor (default: 1,000,000).
The price source for Financial modes is customizable. The choice of mode should consider the asset type, the volume unit displayed by the data source, and the trader’s analytical objective.
IMPORTANT NOTES ON VOLUME DATA
TradingView’s volume series can vary significantly depending on the asset, exchange, broker, and market. In many Forex pairs and some CFDs, volume often represents ticks or provider activity rather than consolidated global financial volume.
For this reason, absolute values should not be directly compared across different assets, brokers, or instruments. Relative regime readings are generally more meaningful than absolute number comparisons.
BASELINES AND REFERENCES
The indicator calculates two dynamic references:
Fast Baseline: Exponential Moving Average of participation (default period: 21). Used for short-term expansion and quiet detection.
Slow Baseline: Simple Moving Average of participation (default period: 233). Provides broader context and can optionally dim bars below it visually.
Both periods are fully customizable. Shorter periods react faster but generate more regime changes; longer periods smooth the reading but respond more slowly.
PARTICIPATION REGIMES
Quiet — Current participation is below the configured relative threshold to the Fast Baseline (default: 0.75 → below 75% of the fast average).
Normal — Default regime when the bar does not meet Quiet, Expansion, or Climax criteria.
Expansion — Current participation is equal to or above the configured relative threshold to the Fast Baseline (default: 1.25 → 125% or more of the fast average).
Climax — Triggered when the log-volume z-score reaches or exceeds the configured threshold (default: 2.50). Identifies statistically extreme participation.
Priority: When a bar meets both Climax and Expansion criteria, it is classified as Climax.
LOG-VOLUME Z-SCORE
To detect extreme spikes, the indicator applies the natural logarithm to participation (log(participation + 1)), then calculates the mean and standard deviation over a configurable lookback period (default: 50 bars).
Formula:
textz-score = (logVolume - mean(logVolume)) / stdev(logVolume)
The logarithm reduces the disproportionate influence of isolated extreme bars. The z-score is a relative measure of exceptionality, not a probability, and does not guarantee reversals or continuations.
VISUAL ELEMENTS
Columns represent the calculated participation in the chosen mode.
Colors:
Quiet: Gray
Normal: Blue
Expansion: Green
Climax: Orange
The Fast Baseline can be displayed as a solid line. The Slow Baseline can be shown as a dotted line with circles. When enabled, bars below the Slow Baseline have reduced visual intensity (purely cosmetic — does not affect calculations).
CLIMAX MARKERS
When enabled, confirmed Climax bars are marked with the text CLX. The maximum number of on-chart markers is configurable. Older markers are automatically removed when the limit is reached to optimize Pine Script object usage.
Markers are only placed after bar close to avoid false confirmations during live bar formation.
INFORMATION TABLE (Optional)
The table displays:
Current Regime
Relative Volume (vs Fast Baseline)
Relative Volume (vs Slow Baseline)
Log-Volume Z-Score
Table position is customizable.
ALERTS
Two configurable alerts are available:
Participation Expansion — Triggers when entering a new Expansion regime.
Participation Climax — Triggers when entering a new Climax regime.
Alerts are disabled by default. Enable them in the settings and create the alert via TradingView’s menu. “Alerts only after bar close” is enabled by default and strongly recommended.
RECOMMENDED STARTING SETTINGS
Volume Mode: Financial Volume
Price Source: Close
Normalization Divisor: 1,000,000
Fast Baseline Length: 21
Slow Baseline Length: 233
Log-Volume Z-Score Length: 50
Quiet Below Relative Volume: 0.75
Expansion Above Relative Volume: 1.25
Climax Z-Score Trigger: 2.50
These values are not universal — adjust according to the asset, timeframe, liquidity, and your trading methodology.
INTERPRETATION WITH PRICE ACTION
Expansion or Climax can confirm increased participation, but does not indicate whether buyers or sellers are in control. Always analyze in conjunction with:
Bar close direction
Market structure (highs/lows)
Key support/resistance levels
Subsequent price behavior
A Climax bar near resistance, support, or at the end of a move can have very different implications. The indicator does not automatically detect absorption, distribution, or institutional intent.
Quiet regimes indicate relatively lower participation but do not necessarily mean consolidation or an imminent volatility explosion.
LIMITATIONS
Depends on the quality and availability of TradingView’s volume data.
Regimes are relative to the asset’s recent history and should not be treated as universal classifications.
The indicator is descriptive, not predictive. It does not eliminate market risk or replace a solid trading plan.
No backtesting or performance guarantees.
RESPONSIBLE USE
Use Operebem VolumePRO as a contextual tool. Always validate readings with price action, liquidity, trading session, costs, volatility, and your own strategy rules. Test thoroughly on your preferred assets and timeframes before using with real capital.
This indicator is for educational and informational purposes only. It does not constitute investment advice, solicitation, or any promise of financial return.
Authorship & Originality
Operebem VolumePRO was developed in Pine Script v6 to provide a clean, organized view of relative volume participation. The description above documents the published implementation and should remain consistent with future code updates.
Volume Participation Indicator for TradingView
Version: 1
Pine Script: v6
Type: Indicator (no automatic order execution)
DESCRIPTION
Operebem VolumePRO is a volume analysis indicator that classifies traded participation into four distinct regimes: Quiet, Normal, Expansion, and Climax.
It was designed to help traders quickly identify whether current volume is below recent behavior, within a normal range, above the short-term average, or in a statistically unusual concentration.
The indicator does not provide entries, exits, stop-loss, take-profit, or buy/sell recommendations. It should be used as additional context for price action, trend, market structure, and risk management.
HOW THE INDICATOR CALCULATES PARTICIPATION
The user can choose between three volume calculation modes:
Exchange Volume — Uses the raw volume series provided by the asset and broker on TradingView.
Financial Volume — Multiplies volume by the selected price (default: Close). Formula: volume × price.
Normalized Financial Volume — Multiplies volume by price and divides by the user-defined normalization divisor (default: 1,000,000).
The price source for Financial modes is customizable. The choice of mode should consider the asset type, the volume unit displayed by the data source, and the trader’s analytical objective.
IMPORTANT NOTES ON VOLUME DATA
TradingView’s volume series can vary significantly depending on the asset, exchange, broker, and market. In many Forex pairs and some CFDs, volume often represents ticks or provider activity rather than consolidated global financial volume.
For this reason, absolute values should not be directly compared across different assets, brokers, or instruments. Relative regime readings are generally more meaningful than absolute number comparisons.
BASELINES AND REFERENCES
The indicator calculates two dynamic references:
Fast Baseline: Exponential Moving Average of participation (default period: 21). Used for short-term expansion and quiet detection.
Slow Baseline: Simple Moving Average of participation (default period: 233). Provides broader context and can optionally dim bars below it visually.
Both periods are fully customizable. Shorter periods react faster but generate more regime changes; longer periods smooth the reading but respond more slowly.
PARTICIPATION REGIMES
Quiet — Current participation is below the configured relative threshold to the Fast Baseline (default: 0.75 → below 75% of the fast average).
Normal — Default regime when the bar does not meet Quiet, Expansion, or Climax criteria.
Expansion — Current participation is equal to or above the configured relative threshold to the Fast Baseline (default: 1.25 → 125% or more of the fast average).
Climax — Triggered when the log-volume z-score reaches or exceeds the configured threshold (default: 2.50). Identifies statistically extreme participation.
Priority: When a bar meets both Climax and Expansion criteria, it is classified as Climax.
LOG-VOLUME Z-SCORE
To detect extreme spikes, the indicator applies the natural logarithm to participation (log(participation + 1)), then calculates the mean and standard deviation over a configurable lookback period (default: 50 bars).
Formula:
textz-score = (logVolume - mean(logVolume)) / stdev(logVolume)
The logarithm reduces the disproportionate influence of isolated extreme bars. The z-score is a relative measure of exceptionality, not a probability, and does not guarantee reversals or continuations.
VISUAL ELEMENTS
Columns represent the calculated participation in the chosen mode.
Colors:
Quiet: Gray
Normal: Blue
Expansion: Green
Climax: Orange
The Fast Baseline can be displayed as a solid line. The Slow Baseline can be shown as a dotted line with circles. When enabled, bars below the Slow Baseline have reduced visual intensity (purely cosmetic — does not affect calculations).
CLIMAX MARKERS
When enabled, confirmed Climax bars are marked with the text CLX. The maximum number of on-chart markers is configurable. Older markers are automatically removed when the limit is reached to optimize Pine Script object usage.
Markers are only placed after bar close to avoid false confirmations during live bar formation.
INFORMATION TABLE (Optional)
The table displays:
Current Regime
Relative Volume (vs Fast Baseline)
Relative Volume (vs Slow Baseline)
Log-Volume Z-Score
Table position is customizable.
ALERTS
Two configurable alerts are available:
Participation Expansion — Triggers when entering a new Expansion regime.
Participation Climax — Triggers when entering a new Climax regime.
Alerts are disabled by default. Enable them in the settings and create the alert via TradingView’s menu. “Alerts only after bar close” is enabled by default and strongly recommended.
RECOMMENDED STARTING SETTINGS
Volume Mode: Financial Volume
Price Source: Close
Normalization Divisor: 1,000,000
Fast Baseline Length: 21
Slow Baseline Length: 233
Log-Volume Z-Score Length: 50
Quiet Below Relative Volume: 0.75
Expansion Above Relative Volume: 1.25
Climax Z-Score Trigger: 2.50
These values are not universal — adjust according to the asset, timeframe, liquidity, and your trading methodology.
INTERPRETATION WITH PRICE ACTION
Expansion or Climax can confirm increased participation, but does not indicate whether buyers or sellers are in control. Always analyze in conjunction with:
Bar close direction
Market structure (highs/lows)
Key support/resistance levels
Subsequent price behavior
A Climax bar near resistance, support, or at the end of a move can have very different implications. The indicator does not automatically detect absorption, distribution, or institutional intent.
Quiet regimes indicate relatively lower participation but do not necessarily mean consolidation or an imminent volatility explosion.
LIMITATIONS
Depends on the quality and availability of TradingView’s volume data.
Regimes are relative to the asset’s recent history and should not be treated as universal classifications.
The indicator is descriptive, not predictive. It does not eliminate market risk or replace a solid trading plan.
No backtesting or performance guarantees.
RESPONSIBLE USE
Use Operebem VolumePRO as a contextual tool. Always validate readings with price action, liquidity, trading session, costs, volatility, and your own strategy rules. Test thoroughly on your preferred assets and timeframes before using with real capital.
This indicator is for educational and informational purposes only. It does not constitute investment advice, solicitation, or any promise of financial return.
Authorship & Originality
Operebem VolumePRO was developed in Pine Script v6 to provide a clean, organized view of relative volume participation. The description above documents the published implementation and should remain consistent with future code updates.
Skrypt open-source
W zgodzie z duchem TradingView twórca tego skryptu udostępnił go jako open-source, aby użytkownicy mogli przejrzeć i zweryfikować jego działanie. Ukłony dla autora. Korzystanie jest bezpłatne, jednak ponowna publikacja kodu podlega naszym Zasadom serwisu.

Wyłączenie odpowiedzialności
Informacje i publikacje nie stanowią i nie powinny być traktowane jako porady finansowe, inwestycyjne, tradingowe ani jakiekolwiek inne rekomendacje dostarczane lub zatwierdzone przez TradingView. Więcej informacji znajduje się w Warunkach użytkowania.
Skrypt open-source
W zgodzie z duchem TradingView twórca tego skryptu udostępnił go jako open-source, aby użytkownicy mogli przejrzeć i zweryfikować jego działanie. Ukłony dla autora. Korzystanie jest bezpłatne, jednak ponowna publikacja kodu podlega naszym Zasadom serwisu.
Wyłączenie odpowiedzialności
Informacje i publikacje nie stanowią i nie powinny być traktowane jako porady finansowe, inwestycyjne, tradingowe ani jakiekolwiek inne rekomendacje dostarczane lub zatwierdzone przez TradingView. Więcej informacji znajduje się w Warunkach użytkowania.