IT TRADING V1 [Core Structure + MTF]
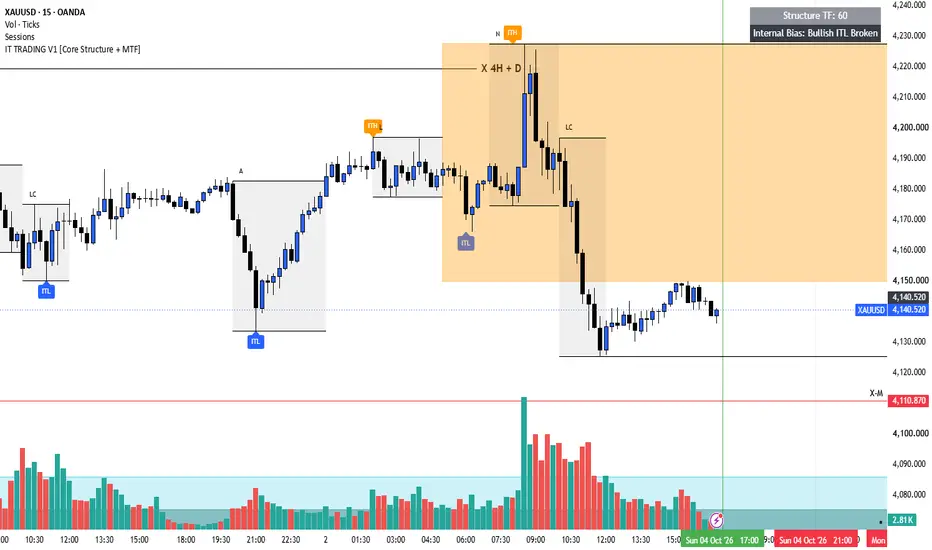
IT TRADING V1 maps market structure across swing degrees and lets you view the structure of any timeframe you choose, directly on your current chart.
WHAT IT DOES
The script detects swing points, groups them into short-term and intermediate-term structure, marks the intermediate levels as protected levels, and shows a simple internal bias based on how price is trading relative to those levels.
HOW IT WORKS
1. Short-term swings (STH / STL): Pivot highs and lows are detected using the Base Pivot Strength setting. A swing is only accepted if its distance from the previous opposite swing is larger than an ATR-based minimum, which filters out small noise swings.
2. Intermediate-term points (ITH / ITL): An ITL is a short-term low that sits below both the short-term low before it and the one after it. An ITH is the mirror case on the high side.
3. Protected levels: The latest ITL and ITH are drawn as horizontal lines extending to the right, starting from the swing where they formed.
4. Internal bias: Price is compared with the latest ITL and ITH, and the dashboard shows one of: Neutral, Bullish Protected, Bearish Protected, Bullish ITL Broken, Bearish ITH Broken.
5. Multi-timeframe mapping: Use the Structure Timeframe input to calculate all of the above on a different timeframe, for example a 4H structure on a 5m chart. Leave it blank to use the chart timeframe.
SETTINGS
- Structure Timeframe: the timeframe used for structure mapping (blank = chart timeframe)
- Base Pivot Strength: number of bars on each side of a pivot
- ATR Length / Minimum Swing ATR Filter: controls how large a swing must be to count
- Show STH/STL, Show ITH/ITL, Show Protected Levels: toggle each layer
HOW TO USE
- Choose a structure timeframe higher than your chart timeframe.
- Use ITL/ITH lines as reference levels for structure, and the dashboard as a quick read on bias.
- A lower pivot strength gives more swings; a higher one gives fewer, more significant swings.
IMPORTANT NOTES
- Pivots are confirmed only after the pivot-strength number of bars has closed on the selected timeframe, so labels appear with a delay. This is how pivot detection works, not a bug.
- The higher-timeframe data is requested without lookahead.
- If the selected timeframe is lower than the chart timeframe, a warning appears in the dashboard.
- This tool is for analysis and education only. It does not generate buy or sell signals and is not financial advice. Past structure does not guarantee future results.
WHAT IT DOES
The script detects swing points, groups them into short-term and intermediate-term structure, marks the intermediate levels as protected levels, and shows a simple internal bias based on how price is trading relative to those levels.
HOW IT WORKS
1. Short-term swings (STH / STL): Pivot highs and lows are detected using the Base Pivot Strength setting. A swing is only accepted if its distance from the previous opposite swing is larger than an ATR-based minimum, which filters out small noise swings.
2. Intermediate-term points (ITH / ITL): An ITL is a short-term low that sits below both the short-term low before it and the one after it. An ITH is the mirror case on the high side.
3. Protected levels: The latest ITL and ITH are drawn as horizontal lines extending to the right, starting from the swing where they formed.
4. Internal bias: Price is compared with the latest ITL and ITH, and the dashboard shows one of: Neutral, Bullish Protected, Bearish Protected, Bullish ITL Broken, Bearish ITH Broken.
5. Multi-timeframe mapping: Use the Structure Timeframe input to calculate all of the above on a different timeframe, for example a 4H structure on a 5m chart. Leave it blank to use the chart timeframe.
SETTINGS
- Structure Timeframe: the timeframe used for structure mapping (blank = chart timeframe)
- Base Pivot Strength: number of bars on each side of a pivot
- ATR Length / Minimum Swing ATR Filter: controls how large a swing must be to count
- Show STH/STL, Show ITH/ITL, Show Protected Levels: toggle each layer
HOW TO USE
- Choose a structure timeframe higher than your chart timeframe.
- Use ITL/ITH lines as reference levels for structure, and the dashboard as a quick read on bias.
- A lower pivot strength gives more swings; a higher one gives fewer, more significant swings.
IMPORTANT NOTES
- Pivots are confirmed only after the pivot-strength number of bars has closed on the selected timeframe, so labels appear with a delay. This is how pivot detection works, not a bug.
- The higher-timeframe data is requested without lookahead.
- If the selected timeframe is lower than the chart timeframe, a warning appears in the dashboard.
- This tool is for analysis and education only. It does not generate buy or sell signals and is not financial advice. Past structure does not guarantee future results.

Wyłączenie odpowiedzialności
Informacje i publikacje nie stanowią i nie powinny być traktowane jako porady finansowe, inwestycyjne, tradingowe ani jakiekolwiek inne rekomendacje dostarczane lub zatwierdzone przez TradingView. Więcej informacji znajduje się w Warunkach użytkowania.
Wyłączenie odpowiedzialności
Informacje i publikacje nie stanowią i nie powinny być traktowane jako porady finansowe, inwestycyjne, tradingowe ani jakiekolwiek inne rekomendacje dostarczane lub zatwierdzone przez TradingView. Więcej informacji znajduje się w Warunkach użytkowania.