OPEN-SOURCE SCRIPT
PMH / PML Each Day
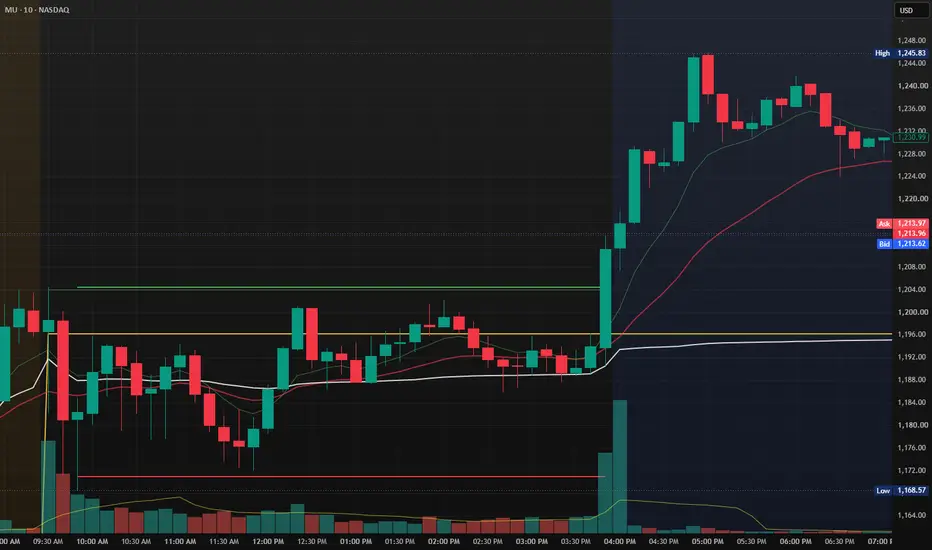
# PMH / PML Each Day Levels
This indicator automatically plots the **Previous Market High (PMH)** and **Previous Market Low (PML)** for every trading day using **Regular Trading Hours (RTH)** only.
### Features
* Plots the Previous Market High (PMH) and Previous Market Low (PML) for every trading session.
* Uses only **9:30 AM – 4:00 PM (Regular Market Hours)**.
* Draws historical PMH/PML levels for every day, making it ideal for backtesting.
* Each day's levels are displayed independently and do not overwrite previous sessions.
* Clean horizontal lines help identify important support and resistance levels.
* Works across all intraday timeframes.
* Perfect for price action, ORB, liquidity sweeps, and breakout/reversal strategies.
### Ideal For
* Intraday traders
* Opening Range Breakout (ORB) traders
* Support & Resistance analysis
* Historical chart review and backtesting
* Liquidity and market structure traders
This indicator provides a simple and reliable way to visualize the previous day's key market levels, allowing traders to quickly identify areas where price may react during the current trading session.
This indicator automatically plots the **Previous Market High (PMH)** and **Previous Market Low (PML)** for every trading day using **Regular Trading Hours (RTH)** only.
### Features
* Plots the Previous Market High (PMH) and Previous Market Low (PML) for every trading session.
* Uses only **9:30 AM – 4:00 PM (Regular Market Hours)**.
* Draws historical PMH/PML levels for every day, making it ideal for backtesting.
* Each day's levels are displayed independently and do not overwrite previous sessions.
* Clean horizontal lines help identify important support and resistance levels.
* Works across all intraday timeframes.
* Perfect for price action, ORB, liquidity sweeps, and breakout/reversal strategies.
### Ideal For
* Intraday traders
* Opening Range Breakout (ORB) traders
* Support & Resistance analysis
* Historical chart review and backtesting
* Liquidity and market structure traders
This indicator provides a simple and reliable way to visualize the previous day's key market levels, allowing traders to quickly identify areas where price may react during the current trading session.
Skrypt open-source
W zgodzie z duchem TradingView twórca tego skryptu udostępnił go jako open-source, aby użytkownicy mogli przejrzeć i zweryfikować jego działanie. Ukłony dla autora. Korzystanie jest bezpłatne, jednak ponowna publikacja kodu podlega naszym Zasadom serwisu.

Wyłączenie odpowiedzialności
Informacje i publikacje nie stanowią i nie powinny być traktowane jako porady finansowe, inwestycyjne, tradingowe ani jakiekolwiek inne rekomendacje dostarczane lub zatwierdzone przez TradingView. Więcej informacji znajduje się w Warunkach użytkowania.
Skrypt open-source
W zgodzie z duchem TradingView twórca tego skryptu udostępnił go jako open-source, aby użytkownicy mogli przejrzeć i zweryfikować jego działanie. Ukłony dla autora. Korzystanie jest bezpłatne, jednak ponowna publikacja kodu podlega naszym Zasadom serwisu.
Wyłączenie odpowiedzialności
Informacje i publikacje nie stanowią i nie powinny być traktowane jako porady finansowe, inwestycyjne, tradingowe ani jakiekolwiek inne rekomendacje dostarczane lub zatwierdzone przez TradingView. Więcej informacji znajduje się w Warunkach użytkowania.