OPEN-SOURCE SCRIPT
Zaktualizowano Minimal Sessions Liquidities
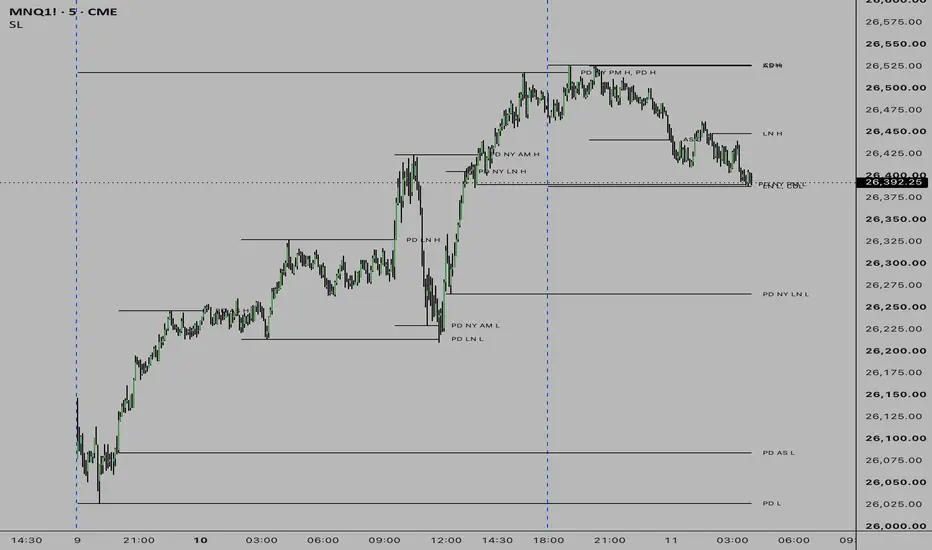
Description
The Session Liquidities indicator is an advanced, automated toolkit for traders who rely on time-based liquidity sweeps and daily structural levels. It automatically highlights the high and low price points for the most actively traded sessions in the market and tracks them dynamically.
Instead of manually drawing horizontal rays across your chart every day, this script does the heavy lifting by identifying the highs and lows of six distinct timeframes (all strictly mapped to Eastern Time / New York Time) and carrying them forward until they are interacted with.
🕒 Sessions Tracked
The engine tracks liquidity boundaries for the following key windows:
Asian Session (AS): 20:00 - 00:00 ET
London Session (LN): 02:00 - 05:00 ET
New York AM Session (NY AM): 09:30 - 11:30 ET
New York Lunch Session (NY LN): 12:00 - 13:00 ET
New York PM Session (NY PM): 13:30 - 16:30 ET
Current Day (CD): 18:00 - 16:55 ET
✨ Key Features
Dynamic Liquidity Extensions: Once a session closes, its high and low lines are automatically extended forward into future price action, acting as pristine liquidity magnets.
Stop When Swept: An optional setting allows you to stop drawing the liquidity line exactly on the candle where the price eventually sweeps (crosses) it. This prevents your chart from being cluttered by old, invalidated liquidity levels.
Previous Day (PD) Memory: The script remembers historical session data. When a new day begins, the script automatically re-labels the previous day's untouched levels to "PD" (e.g., PD AS H for Previous Day Asian High), or D-2 for older levels.
Smart Overlap Merging: It's very common for two sessions to share the exact same high or low. To keep your charts incredibly sleek, the engine actively scans for overlapping labels. If two liquidity pools rest at the exact same tick, it merges their labels into a single comma-separated text (e.g., Current Day High, AS L) and removes the redundant visual clutter.
Customizable Lookback: Control exactly how many historical days of liquidity you want to track (up to 40 days) to match your trading style without overwhelming your screen.
⚙️ Settings
Sessions to Show: Toggle any of the 6 individual sessions on or off.
Session Colors: Fully customize the color of the lines and labels for each specific session.
Lookback Limit: Adjust how many historical periods are kept on the chart (1 = Current Only, 2 = Current + Previous Day).
Stop Lines When Swept: Toggle whether the line should extend indefinitely or terminate upon contact with price.
Label Size: Change the typography size (defaults to Tiny for a professional, unobtrusive aesthetic).
The Session Liquidities indicator is an advanced, automated toolkit for traders who rely on time-based liquidity sweeps and daily structural levels. It automatically highlights the high and low price points for the most actively traded sessions in the market and tracks them dynamically.
Instead of manually drawing horizontal rays across your chart every day, this script does the heavy lifting by identifying the highs and lows of six distinct timeframes (all strictly mapped to Eastern Time / New York Time) and carrying them forward until they are interacted with.
🕒 Sessions Tracked
The engine tracks liquidity boundaries for the following key windows:
Asian Session (AS): 20:00 - 00:00 ET
London Session (LN): 02:00 - 05:00 ET
New York AM Session (NY AM): 09:30 - 11:30 ET
New York Lunch Session (NY LN): 12:00 - 13:00 ET
New York PM Session (NY PM): 13:30 - 16:30 ET
Current Day (CD): 18:00 - 16:55 ET
✨ Key Features
Dynamic Liquidity Extensions: Once a session closes, its high and low lines are automatically extended forward into future price action, acting as pristine liquidity magnets.
Stop When Swept: An optional setting allows you to stop drawing the liquidity line exactly on the candle where the price eventually sweeps (crosses) it. This prevents your chart from being cluttered by old, invalidated liquidity levels.
Previous Day (PD) Memory: The script remembers historical session data. When a new day begins, the script automatically re-labels the previous day's untouched levels to "PD" (e.g., PD AS H for Previous Day Asian High), or D-2 for older levels.
Smart Overlap Merging: It's very common for two sessions to share the exact same high or low. To keep your charts incredibly sleek, the engine actively scans for overlapping labels. If two liquidity pools rest at the exact same tick, it merges their labels into a single comma-separated text (e.g., Current Day High, AS L) and removes the redundant visual clutter.
Customizable Lookback: Control exactly how many historical days of liquidity you want to track (up to 40 days) to match your trading style without overwhelming your screen.
⚙️ Settings
Sessions to Show: Toggle any of the 6 individual sessions on or off.
Session Colors: Fully customize the color of the lines and labels for each specific session.
Lookback Limit: Adjust how many historical periods are kept on the chart (1 = Current Only, 2 = Current + Previous Day).
Stop Lines When Swept: Toggle whether the line should extend indefinitely or terminate upon contact with price.
Label Size: Change the typography size (defaults to Tiny for a professional, unobtrusive aesthetic).
Informacje o Wersji
Bug FixesSkrypt open-source
W zgodzie z duchem TradingView twórca tego skryptu udostępnił go jako open-source, aby użytkownicy mogli przejrzeć i zweryfikować jego działanie. Ukłony dla autora. Korzystanie jest bezpłatne, jednak ponowna publikacja kodu podlega naszym Zasadom serwisu.

Wyłączenie odpowiedzialności
Informacje i publikacje nie stanowią i nie powinny być traktowane jako porady finansowe, inwestycyjne, tradingowe ani jakiekolwiek inne rekomendacje dostarczane lub zatwierdzone przez TradingView. Więcej informacji znajduje się w Warunkach użytkowania.
Skrypt open-source
W zgodzie z duchem TradingView twórca tego skryptu udostępnił go jako open-source, aby użytkownicy mogli przejrzeć i zweryfikować jego działanie. Ukłony dla autora. Korzystanie jest bezpłatne, jednak ponowna publikacja kodu podlega naszym Zasadom serwisu.
Wyłączenie odpowiedzialności
Informacje i publikacje nie stanowią i nie powinny być traktowane jako porady finansowe, inwestycyjne, tradingowe ani jakiekolwiek inne rekomendacje dostarczane lub zatwierdzone przez TradingView. Więcej informacji znajduje się w Warunkach użytkowania.