Eye Rejection Profile [EyeAlgo]
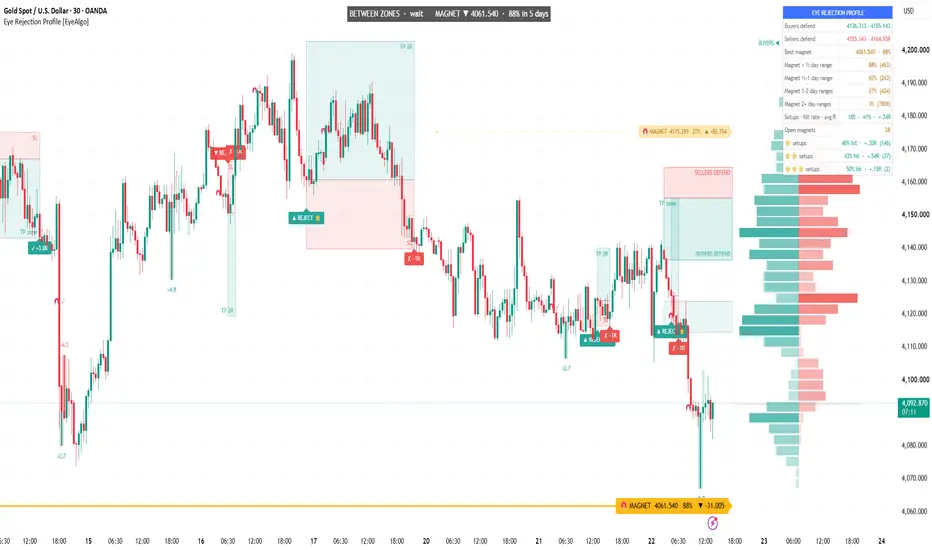
Eye Rejection Profile shows three things on one chart: where price was REJECTED (wick volume by price), where price is likely to be PULLED next (untouched volume levels with a measured probability), and how good each rejection setup is — graded ⭐ / ⭐⭐ / ⭐⭐⭐ and tracked to its result, with each grade's own hit rate in the dashboard.

🟢 OVERVIEW
A normal volume profile tells you where volume traded, but not where buyers or sellers actually pushed price away. A level tool shows lines, but not which one price is likely to visit next, or how often that worked on your symbol. Eye Rejection Profile answers three questions on one screen:
• Where did buyers and sellers defend price (rejection zones)?
• Which untouched volume level is price most likely to visit next, and how likely is it?
• Is this rejection a weak one or a high-quality one — and how did that grade perform on this chart before?
🟢 WHAT MAKES IT ORIGINAL
▶ Wick-only volume profile: instead of all volume, only the volume of the WICKS is placed by price. Lower wicks are buyers' rejection (left wing), upper wicks are sellers' rejection (right wing) — a "butterfly" profile.
▶ Frozen session zones: rejection zones are rebuilt once per session from the bars BEFORE that session and then frozen, so zones and setups never repaint. A band rejected from both sides is treated as congestion and only the stronger side is kept.
▶ Magnet Map with measured probability: every untouched session POC (naked POC) is a 🧲 MAGNET. Each one shows the chance that price trades back to it within 5 sessions, learned from this symbol's own history by distance from price.
▶ Rejection candles: a wick glows only when its size AND its volume both stand out (wick length in ATR × relative volume).
▶ Graded, self-tracking setups: every REJECT setup gets stars for location, candle strength and magnet target, is followed to TP, SL or time exit, and the dashboard shows hit rate and average R for ⭐, ⭐⭐ and ⭐⭐⭐ separately.
🟢 HOW IT WORKS

1. Rejection profile
For each candle in the look-back (default 300 bars) the upper and lower wick are measured and weighted by that bar's volume × the wick's share of the candle range, then spread over the price rows the wick covers. Stronger rows are drawn more solid. The profile is drawn to the right of the last candle and updates live.
2. Rejection zones (BUYERS DEFEND / SELLERS DEFEND)
At the start of each session (day on intraday charts, week on daily, month on weekly, year on monthly) rows with at least 60 % of the strongest row's rejection volume form zones — up to 2 per side. If a buyer zone and a seller zone overlap, only the zone with more total rejection volume is kept. Zones stay fixed for the whole session.
3. Rejection candles (glowing wicks)
A wick glows when it is at least 40 % of the candle range and its strength — (wick ÷ ATR) × (volume ÷ 50-bar average volume) — is at least 2.5, and it is longer than the opposite wick. The ×number next to it is that strength.
4. Magnet Map (untouched volume levels)
At the end of each session its Point of Control (price with the most volume) is stored. Until price trades back to it, it is a 🧲 MAGNET line with a label like "🧲 MAGNET 4061.5 88% ▼ -21.7". Every session, each open magnet is recorded with its distance from price (in average session ranges: under ½, ½–1, 1–2, 2+). When the 5-session window ends, the script counts whether it was reached — that gives the probability per distance. Higher probability = thicker, brighter line. When a magnet is reached, a 🧲 ✓ mark stays on the chart.
5. Rejection setups ⭐ / ⭐⭐ / ⭐⭐⭐
▲ REJECT: a candle wicks into a buyer zone and closes back above it with a rejection wick of at least 40 %. ▼ REJECT: the same at a seller zone.
• Stop: beyond the zone + 0.2 ATR.
• Target: the nearest magnet between 1R and 3R away, else the nearest opposite zone in that range, else 2R.
• Time exit after 48 bars. If stop and target are hit in the same bar, it counts as a loss.
• ⭐ zone rejection (every setup) · ⭐ strong rejection candle · ⭐ target is a magnet with ≥ 60 % probability. The magnet probability is the chance of reaching that level within 5 sessions, not the chance that this trade hits its target.
• Only one setup is open at a time, and each zone can trigger once per session; rejections during an open setup are skipped. Hit rate = target exits ÷ all exits, so time exits count as non-wins.
Results are drawn as ✓ +R, ✗ −1R or ⏱ ±R. Hover a REJECT label to see which stars it earned, plus entry, stop and target.
🟢 RESEARCH BEHIND THE DEFAULTS
The defaults were tuned on OANDA XAUUSD 30-minute (all bars TradingView loads by default, October 2026). The script's own dashboard on that chart showed:
• Magnet probability by distance: under ½ session range 88 % (463 samples), ½–1 range 62 % (263), 1–2 ranges 27 % (434), 2+ ranges 1 % (7,809). Close magnets are reached far more often than far ones, which is why far magnets are hidden and the ⭐ magnet star needs ≥ 60 %.
• Setups: the dashboard tracks every setup with its hit rate and average R, overall and per grade. On this chart the sample was small (185 setups, only 2 rated ⭐⭐⭐), and these figures were measured on the same data the defaults were tuned on (in-sample), before spread and commission, so they are not a performance expectation.
All figures are from one chart and period. They describe the past and will differ on other symbols and timeframes — the dashboard recalculates them for whatever chart you open.
🟢 HOW TO USE
1. Read the status bar at the top: which zone is in play and where the best magnet is.
2. Wait for a ▲ / ▼ REJECT at a zone. Give more weight to ⭐⭐ and ⭐⭐⭐.
3. Check the dashboard: if higher grades show a better hit rate and average R on your symbol, use them as a filter.
4. Use magnets as targets or as areas where price may pause.
5. Test the settings on your own symbol and timeframe before using them live.
🟢 HOW TO CHANGE SETTINGS
1. Add the indicator to your chart.
2. Hover the indicator name at the top-left of the chart and click the ⚙ gear icon.
3. Change values in the "Inputs" tab and click OK.
Quick guide:
• Fewer, stronger zones → raise "Zone strength" (e.g. 70 – 80).
• Only strong rejection candles → raise "Rejection strength needed" (e.g. 3 – 4).
• Stricter magnet star → raise "⭐ Magnet target needs (%)".
• Cleaner chart → switch off "Show rejection profile", "Show TP / SL boxes" or "Glow strong rejection wicks".
• Alerts → right-click the chart → Add alert → choose "Eye Rejection Profile" and the condition.
🟢 SETTINGS
• Rejection Profile: bars used per session, rows, profile width, gap from last candle, show profile.
• Rejection Zones: show zones, zone strength %, zones per side.
• Rejection Setups: show setups, rejection wick %, stop buffer, minimum / maximum reward:risk, time exit, magnet % for the ⭐, TP / SL boxes, setups kept on chart.
• Magnet Map: show magnets, nearest magnets shown, probability window, distance limit, minimum samples per bucket.
• Rejection Candles: glowing wicks on / off, strength needed, candles kept.
• Colours, table position, detailed alerts.
🟢 ALERTS
• Rejection setup ▲ / ▼
• ⭐⭐⭐ setup
• Setup target hit / Setup stop hit
• Magnet reached
• Buyer rejection candle / Seller rejection candle
• Detailed alert() message with direction, stars, entry, stop and target — choose "Any alert() function call" when creating the alert.
🟢 IMPORTANT NOTES & LIMITATIONS
• Zones are rebuilt once per session, so a level formed during today's session becomes a zone only from the next session.
• Probabilities and hit rates come from the history loaded on your chart. With little history they show "–" or rest on small samples.
• Volume weighting depends on the data feed. Forex and CFD symbols use tick volume; symbols without volume use equal weight per bar.
• On the live candle the profile, magnets and status update until it closes. Glowing wicks, REJECT signals and alerts appear only on bar close; TP / SL results and magnet ✓ marks show as soon as price touches the level.
• TradingView allows 500 boxes, lines and labels per script, so on long histories the oldest drawings are removed automatically.
• Designed mainly for intraday charts. The script does not place trades.
🟢 DISCLAIMER
This indicator is for educational and analysis purposes only. It is not financial advice. Past behaviour on a chart does not guarantee future results. Always use your own analysis and risk management.
🟢 OVERVIEW
A normal volume profile tells you where volume traded, but not where buyers or sellers actually pushed price away. A level tool shows lines, but not which one price is likely to visit next, or how often that worked on your symbol. Eye Rejection Profile answers three questions on one screen:
• Where did buyers and sellers defend price (rejection zones)?
• Which untouched volume level is price most likely to visit next, and how likely is it?
• Is this rejection a weak one or a high-quality one — and how did that grade perform on this chart before?
🟢 WHAT MAKES IT ORIGINAL
▶ Wick-only volume profile: instead of all volume, only the volume of the WICKS is placed by price. Lower wicks are buyers' rejection (left wing), upper wicks are sellers' rejection (right wing) — a "butterfly" profile.
▶ Frozen session zones: rejection zones are rebuilt once per session from the bars BEFORE that session and then frozen, so zones and setups never repaint. A band rejected from both sides is treated as congestion and only the stronger side is kept.
▶ Magnet Map with measured probability: every untouched session POC (naked POC) is a 🧲 MAGNET. Each one shows the chance that price trades back to it within 5 sessions, learned from this symbol's own history by distance from price.
▶ Rejection candles: a wick glows only when its size AND its volume both stand out (wick length in ATR × relative volume).
▶ Graded, self-tracking setups: every REJECT setup gets stars for location, candle strength and magnet target, is followed to TP, SL or time exit, and the dashboard shows hit rate and average R for ⭐, ⭐⭐ and ⭐⭐⭐ separately.
🟢 HOW IT WORKS
1. Rejection profile
For each candle in the look-back (default 300 bars) the upper and lower wick are measured and weighted by that bar's volume × the wick's share of the candle range, then spread over the price rows the wick covers. Stronger rows are drawn more solid. The profile is drawn to the right of the last candle and updates live.
2. Rejection zones (BUYERS DEFEND / SELLERS DEFEND)
At the start of each session (day on intraday charts, week on daily, month on weekly, year on monthly) rows with at least 60 % of the strongest row's rejection volume form zones — up to 2 per side. If a buyer zone and a seller zone overlap, only the zone with more total rejection volume is kept. Zones stay fixed for the whole session.
3. Rejection candles (glowing wicks)
A wick glows when it is at least 40 % of the candle range and its strength — (wick ÷ ATR) × (volume ÷ 50-bar average volume) — is at least 2.5, and it is longer than the opposite wick. The ×number next to it is that strength.
4. Magnet Map (untouched volume levels)
At the end of each session its Point of Control (price with the most volume) is stored. Until price trades back to it, it is a 🧲 MAGNET line with a label like "🧲 MAGNET 4061.5 88% ▼ -21.7". Every session, each open magnet is recorded with its distance from price (in average session ranges: under ½, ½–1, 1–2, 2+). When the 5-session window ends, the script counts whether it was reached — that gives the probability per distance. Higher probability = thicker, brighter line. When a magnet is reached, a 🧲 ✓ mark stays on the chart.
5. Rejection setups ⭐ / ⭐⭐ / ⭐⭐⭐
▲ REJECT: a candle wicks into a buyer zone and closes back above it with a rejection wick of at least 40 %. ▼ REJECT: the same at a seller zone.
• Stop: beyond the zone + 0.2 ATR.
• Target: the nearest magnet between 1R and 3R away, else the nearest opposite zone in that range, else 2R.
• Time exit after 48 bars. If stop and target are hit in the same bar, it counts as a loss.
• ⭐ zone rejection (every setup) · ⭐ strong rejection candle · ⭐ target is a magnet with ≥ 60 % probability. The magnet probability is the chance of reaching that level within 5 sessions, not the chance that this trade hits its target.
• Only one setup is open at a time, and each zone can trigger once per session; rejections during an open setup are skipped. Hit rate = target exits ÷ all exits, so time exits count as non-wins.
Results are drawn as ✓ +R, ✗ −1R or ⏱ ±R. Hover a REJECT label to see which stars it earned, plus entry, stop and target.
🟢 RESEARCH BEHIND THE DEFAULTS
The defaults were tuned on OANDA XAUUSD 30-minute (all bars TradingView loads by default, October 2026). The script's own dashboard on that chart showed:
• Magnet probability by distance: under ½ session range 88 % (463 samples), ½–1 range 62 % (263), 1–2 ranges 27 % (434), 2+ ranges 1 % (7,809). Close magnets are reached far more often than far ones, which is why far magnets are hidden and the ⭐ magnet star needs ≥ 60 %.
• Setups: the dashboard tracks every setup with its hit rate and average R, overall and per grade. On this chart the sample was small (185 setups, only 2 rated ⭐⭐⭐), and these figures were measured on the same data the defaults were tuned on (in-sample), before spread and commission, so they are not a performance expectation.
All figures are from one chart and period. They describe the past and will differ on other symbols and timeframes — the dashboard recalculates them for whatever chart you open.
🟢 HOW TO USE
1. Read the status bar at the top: which zone is in play and where the best magnet is.
2. Wait for a ▲ / ▼ REJECT at a zone. Give more weight to ⭐⭐ and ⭐⭐⭐.
3. Check the dashboard: if higher grades show a better hit rate and average R on your symbol, use them as a filter.
4. Use magnets as targets or as areas where price may pause.
5. Test the settings on your own symbol and timeframe before using them live.
🟢 HOW TO CHANGE SETTINGS
1. Add the indicator to your chart.
2. Hover the indicator name at the top-left of the chart and click the ⚙ gear icon.
3. Change values in the "Inputs" tab and click OK.
Quick guide:
• Fewer, stronger zones → raise "Zone strength" (e.g. 70 – 80).
• Only strong rejection candles → raise "Rejection strength needed" (e.g. 3 – 4).
• Stricter magnet star → raise "⭐ Magnet target needs (%)".
• Cleaner chart → switch off "Show rejection profile", "Show TP / SL boxes" or "Glow strong rejection wicks".
• Alerts → right-click the chart → Add alert → choose "Eye Rejection Profile" and the condition.
🟢 SETTINGS
• Rejection Profile: bars used per session, rows, profile width, gap from last candle, show profile.
• Rejection Zones: show zones, zone strength %, zones per side.
• Rejection Setups: show setups, rejection wick %, stop buffer, minimum / maximum reward:risk, time exit, magnet % for the ⭐, TP / SL boxes, setups kept on chart.
• Magnet Map: show magnets, nearest magnets shown, probability window, distance limit, minimum samples per bucket.
• Rejection Candles: glowing wicks on / off, strength needed, candles kept.
• Colours, table position, detailed alerts.
🟢 ALERTS
• Rejection setup ▲ / ▼
• ⭐⭐⭐ setup
• Setup target hit / Setup stop hit
• Magnet reached
• Buyer rejection candle / Seller rejection candle
• Detailed alert() message with direction, stars, entry, stop and target — choose "Any alert() function call" when creating the alert.
🟢 IMPORTANT NOTES & LIMITATIONS
• Zones are rebuilt once per session, so a level formed during today's session becomes a zone only from the next session.
• Probabilities and hit rates come from the history loaded on your chart. With little history they show "–" or rest on small samples.
• Volume weighting depends on the data feed. Forex and CFD symbols use tick volume; symbols without volume use equal weight per bar.
• On the live candle the profile, magnets and status update until it closes. Glowing wicks, REJECT signals and alerts appear only on bar close; TP / SL results and magnet ✓ marks show as soon as price touches the level.
• TradingView allows 500 boxes, lines and labels per script, so on long histories the oldest drawings are removed automatically.
• Designed mainly for intraday charts. The script does not place trades.
🟢 DISCLAIMER
This indicator is for educational and analysis purposes only. It is not financial advice. Past behaviour on a chart does not guarantee future results. Always use your own analysis and risk management.

Wyłączenie odpowiedzialności
Informacje i publikacje nie stanowią i nie powinny być traktowane jako porady finansowe, inwestycyjne, tradingowe ani jakiekolwiek inne rekomendacje dostarczane lub zatwierdzone przez TradingView. Więcej informacji znajduje się w Warunkach użytkowania.
Wyłączenie odpowiedzialności
Informacje i publikacje nie stanowią i nie powinny być traktowane jako porady finansowe, inwestycyjne, tradingowe ani jakiekolwiek inne rekomendacje dostarczane lub zatwierdzone przez TradingView. Więcej informacji znajduje się w Warunkach użytkowania.