OPEN-SOURCE SCRIPT
AI-Powered PDH/PDL Power Ranker [PhenLabs]
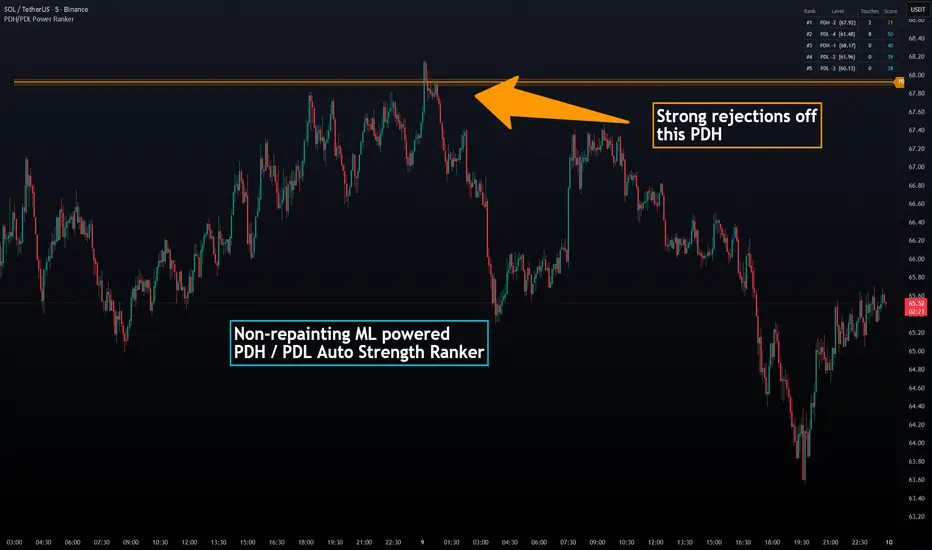
📊 ML-Powered PDH/PDL Power Ranker [PhenLabs]
Version: PineScript™ v6
📌 Description
ML-Powered PDH/PDL Power Ranker is an adaptive support/resistance indicator that tracks Prior Day High and Prior Day Low levels across a configurable session lookback, then ranks each level on a 0–100 scale based on how strongly price has historically reacted to it.
Instead of treating every PDH and PDL as equally important, this script continuously learns which levels deserve attention. It evaluates live touches, measures the realized rejection after a user-defined confirmation window, and updates each level with either a shared NLMS model or an independent Kalman estimator.
The result is a causal, non-repainting ranking engine that helps traders focus on the strongest daily levels, identify high-confidence reaction zones, and ignore weak or stale liquidity areas.
🚀 Points of Innovation
🔧 Core Components
🔥 Key Features
🎨 Visualization
📖 Usage Guidelines
Level Detection
Adaptive Model
Display & Alerts
✅ Best Use Cases
⚠️ Limitations
💡 What Makes This Unique
🔬 How It Works
1. Session Level Creation:
2. Touch Feature Capture:
3. Causal Reaction Resolution:
4. Adaptive Score Update:
5. Display Ranking and Alerts:
💡 Note:
This script is designed to be non-repainting and strictly causal. For best results, use it as a level-prioritization engine inside a broader execution framework that includes market structure, trend context, and risk management.
Version: PineScript™ v6
📌 Description
ML-Powered PDH/PDL Power Ranker is an adaptive support/resistance indicator that tracks Prior Day High and Prior Day Low levels across a configurable session lookback, then ranks each level on a 0–100 scale based on how strongly price has historically reacted to it.
Instead of treating every PDH and PDL as equally important, this script continuously learns which levels deserve attention. It evaluates live touches, measures the realized rejection after a user-defined confirmation window, and updates each level with either a shared NLMS model or an independent Kalman estimator.
The result is a causal, non-repainting ranking engine that helps traders focus on the strongest daily levels, identify high-confidence reaction zones, and ignore weak or stale liquidity areas.
🚀 Points of Innovation
- Adaptive level scoring using two genuine learning models: shared NLMS or per-level Kalman filtering
- Strictly causal labeling process that waits for confirmed post-touch reaction before updating any score
- Feature-based learning framework using wick rejection, relative volume spike, and ATR-normalized approach momentum
- Untouched-level score shrinkage logic that prevents zero-evidence levels from outranking proven levels
- Session-aware PDH/PDL generation that respects TradingView session boundaries, including extended-hours configurations
- Top-ranked dashboard plus high-confidence zone highlighting and touch alerts for fast execution workflow
🔧 Core Components
- PDH/PDL Session Engine: Captures completed-session highs and lows, stores them as active levels, and prunes old levels based on the selected lookback window
- ATR Zone Builder: Expands each level into a configurable reaction band using ATR(14), creating realistic touch zones instead of single-price lines
- NLMS Learning Model: Uses a normalized least-mean-squares filter to learn a global mapping from touch features to realized reaction quality
- Kalman Strength Filter: Maintains an independent latent-strength estimate for each level using scalar Kalman state updates
- Causal Touch Resolver: Snapshots features on zone entry, waits a fixed number of bars, then measures realized rejection with no lookahead
- Ranking Dashboard: Sorts active levels by display score and shows the strongest zones with age, touch count, and score
🔥 Key Features
- Ranks every active PDH and PDL from 0 to 100 so the best daily levels stand out immediately
- Offers two adaptive engines so traders can choose between cross-level learning (NLMS) or level-specific state estimation (Kalman)
- Uses entry-based touch detection to avoid overcounting consolidations sitting inside the same zone
- Applies ATR-normalized reaction measurement so scoring remains comparable across symbols and volatility regimes
- Highlights high-confidence zones directly on the chart when price is trading inside them
- Triggers alert conditions when price touches a zone whose score is above the high-confidence threshold
- Includes a clean top-5 ranking table so traders can identify the strongest daily levels at a glance
🎨 Visualization
- Dynamic zone boxes show each PDH and PDL as a buffered reaction area rather than a thin horizontal line
- Gradient-based score coloring makes weak levels fade cool and strong levels turn hot
- On-chart labels display level type, age in sessions, and current score
- Optional background highlight marks bars trading inside a high-confidence zone
- Ranking dashboard lists the top levels by score along with touch counts and exact price levels
📖 Usage Guidelines
Level Detection
- Session lookback (days) — Default: 7 — Range: 1 to 15 — Controls how many completed sessions of PDH/PDL levels remain active. Lower values keep the chart cleaner; higher values preserve more historical daily structure.
- Zone buffer (× ATR-14) — Default: 0.15 — Range: 0.01 to 2.0 — Sets the half-width of each PDH/PDL zone in ATR units. Increase it for volatile markets; reduce it for tighter precision.
Adaptive Model
- Adaptive model — Default: NLMS — Options: NLMS or Kalman — NLMS learns globally across all resolved touches, while Kalman maintains a separate evolving strength estimate for each level.
- Reaction confirmation bars — Default: 6 — Range: 2 to 50 — Defines how long the script waits after a touch before measuring the realized reaction. Larger values emphasize slower reversals; smaller values emphasize immediate rejection.
- NLMS step size (μ) — Default: 0.50 — Range: 0.01 to 2.0 — Controls learning speed for the NLMS model. Higher values adapt faster but can be more reactive.
- Kalman process noise (Q) — Default: 0.010 — Minimum: 0.0001 — Controls how quickly a level’s true strength is allowed to drift between observations.
- Kalman measurement noise (R) — Default: 0.20 — Minimum: 0.001 — Controls how noisy each touch observation is assumed to be. Higher values smooth updates and slow score changes.
Display & Alerts
- Min score to display — Default: 55 — Range: 0 to 100 — Hides weaker levels from the chart while still tracking them internally
- High-confidence threshold — Default: 75 — Range: 0 to 100 — Defines which zones qualify for hot-zone highlighting and touch alerts
- Show ranking dashboard — Default: true — Toggles the top-ranked PDH/PDL table
- Highlight bar inside high-confidence zone — Default: true — Adds background emphasis when price is currently trading inside a strong zone
✅ Best Use Cases
- Intraday trading around prior-day liquidity and reaction zones
- Session traders who want objective ranking of PDH/PDL instead of manually judging every level
- Futures, indices, forex, and crypto markets where daily highs and lows act as repeat reaction points
- Confluence trading alongside structure, liquidity sweeps, VWAP, or order-flow tools
- Traders who want non-repainting, evidence-based level scoring instead of static daily levels
⚠️ Limitations
- The model needs resolved touch history before scores become highly informative, so early readings are more neutral
- PDH/PDL relevance depends on symbol behavior, session configuration, and timeframe context
- Very low-liquidity markets or feeds with weak volume data can reduce the usefulness of the volume-spike feature
- This indicator ranks reaction quality at prior-day levels; it does not predict trend direction by itself
- Kalman and NLMS may emphasize different behaviors, so traders should test which model best fits their market
💡 What Makes This Unique
- It does not just plot PDH and PDL — it learns which ones actually matter
- Its labeling process is fully causal, so model updates occur only after the reaction window has completed
- It combines level memory with adaptive inference instead of using a static heuristic score
- It prevents untouched levels from dominating the rankings through trust-weighted prior shrinkage
🔬 How It Works
1. Session Level Creation:
- At each new daily session boundary, the script stores the completed session’s high and low as fresh PDH and PDL levels
- Each level is assigned metadata including age, touch count, score state, and pending-observation slots
2. Touch Feature Capture:
- When price enters a zone from outside, the script records three features: wick rejection ratio, relative volume spike, and 3-bar ATR-normalized approach momentum
- This entry-only logic prevents repeated relabeling while price chops inside the same zone
3. Causal Reaction Resolution:
- After the selected confirmation window expires, the script measures realized rejection strength in ATR units
- That realized move is mapped into a normalized target so the model learns from consistent cross-market observations
4. Adaptive Score Update:
- In NLMS mode, the shared weight vector updates from every resolved observation, then blends the fresh model prediction with that level’s own EMA of realized reactions
- In Kalman mode, each level updates its latent strength estimate using scalar predict-and-correct filtering
5. Display Ranking and Alerts:
- The script converts model output into a 0–100 score, ranks active levels, colors zones by strength, and highlights high-confidence areas
- An alert condition fires when price touches a zone whose score is already above the selected confidence threshold
💡 Note:
This script is designed to be non-repainting and strictly causal. For best results, use it as a level-prioritization engine inside a broader execution framework that includes market structure, trend context, and risk management.
Skrypt open-source
W zgodzie z duchem TradingView twórca tego skryptu udostępnił go jako open-source, aby użytkownicy mogli przejrzeć i zweryfikować jego działanie. Ukłony dla autora. Korzystanie jest bezpłatne, jednak ponowna publikacja kodu podlega naszym Zasadom serwisu.

TradingView Charting w/ Crypto Systems: phenlabs.com
Join our growing community: discord.gg/phen
All content provided by PhenLabs is for informational & educational purposes only. Past performance does not guarantee future results.
Join our growing community: discord.gg/phen
All content provided by PhenLabs is for informational & educational purposes only. Past performance does not guarantee future results.
Wyłączenie odpowiedzialności
Informacje i publikacje nie stanowią i nie powinny być traktowane jako porady finansowe, inwestycyjne, tradingowe ani jakiekolwiek inne rekomendacje dostarczane lub zatwierdzone przez TradingView. Więcej informacji znajduje się w Warunkach użytkowania.
Skrypt open-source
W zgodzie z duchem TradingView twórca tego skryptu udostępnił go jako open-source, aby użytkownicy mogli przejrzeć i zweryfikować jego działanie. Ukłony dla autora. Korzystanie jest bezpłatne, jednak ponowna publikacja kodu podlega naszym Zasadom serwisu.
TradingView Charting w/ Crypto Systems: phenlabs.com
Join our growing community: discord.gg/phen
All content provided by PhenLabs is for informational & educational purposes only. Past performance does not guarantee future results.
Join our growing community: discord.gg/phen
All content provided by PhenLabs is for informational & educational purposes only. Past performance does not guarantee future results.
Wyłączenie odpowiedzialności
Informacje i publikacje nie stanowią i nie powinny być traktowane jako porady finansowe, inwestycyjne, tradingowe ani jakiekolwiek inne rekomendacje dostarczane lub zatwierdzone przez TradingView. Więcej informacji znajduje się w Warunkach użytkowania.