OPEN-SOURCE SCRIPT
Murrey Math [pointalgo]
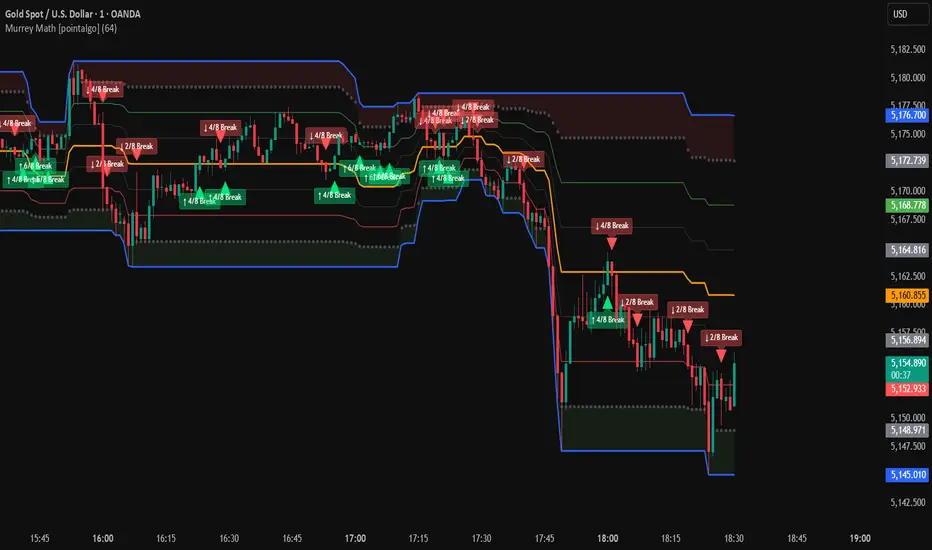
Murrey Math [PointAlgo]
Murrey Math [PointAlgo] is a geometric price structure indicator based on Murrey Math principles.
It automatically divides the selected price range into 8 equal fractal levels to help traders identify key support, resistance, and breakout zones.
How It Works:
The script:
• Calculates the highest high and lowest low over a user-defined Geometric Frame Size
• Divides that range into 8 equal price intervals (0/8 to 8/8)
• Plots dynamic Murrey levels directly on the chart
• Detects breakouts above and below important levels
Key Levels
0/8 & 8/8 → Major support & resistance (frame extremes)
4/8 → Central equilibrium / median level
2/8 & 6/8 → Pivot zones
1/8 & 7/8 → Weak stall levels
3/8 & 5/8 → Trading range levels
Breakout Signals
The script highlights:
✔ Bullish breakouts when price closes above 4/8, 6/8, or 8/8
✔ Bearish breakouts when price closes below 4/8, 2/8, or 0/8
Arrows and labels appear on the chart to show which level was broken.
Settings
Geometric Frame Size – Controls the lookback period used to calculate the Murrey structure.
Larger values create broader structural levels, while smaller values make levels more reactive.
Best Used For
• Identifying structured support & resistance
• Breakout confirmation
• Range trading environments
• Multi-timeframe structure analysis
Important Notes:
This indicator is for educational and informational purposes only.
It does not provide financial advice.
Always use proper risk management and combine with your own analysis before making trading decisions.
Murrey Math [PointAlgo] is a geometric price structure indicator based on Murrey Math principles.
It automatically divides the selected price range into 8 equal fractal levels to help traders identify key support, resistance, and breakout zones.
How It Works:
The script:
• Calculates the highest high and lowest low over a user-defined Geometric Frame Size
• Divides that range into 8 equal price intervals (0/8 to 8/8)
• Plots dynamic Murrey levels directly on the chart
• Detects breakouts above and below important levels
Key Levels
0/8 & 8/8 → Major support & resistance (frame extremes)
4/8 → Central equilibrium / median level
2/8 & 6/8 → Pivot zones
1/8 & 7/8 → Weak stall levels
3/8 & 5/8 → Trading range levels
Breakout Signals
The script highlights:
✔ Bullish breakouts when price closes above 4/8, 6/8, or 8/8
✔ Bearish breakouts when price closes below 4/8, 2/8, or 0/8
Arrows and labels appear on the chart to show which level was broken.
Settings
Geometric Frame Size – Controls the lookback period used to calculate the Murrey structure.
Larger values create broader structural levels, while smaller values make levels more reactive.
Best Used For
• Identifying structured support & resistance
• Breakout confirmation
• Range trading environments
• Multi-timeframe structure analysis
Important Notes:
This indicator is for educational and informational purposes only.
It does not provide financial advice.
Always use proper risk management and combine with your own analysis before making trading decisions.
Skrypt open-source
W zgodzie z duchem TradingView twórca tego skryptu udostępnił go jako open-source, aby użytkownicy mogli przejrzeć i zweryfikować jego działanie. Ukłony dla autora. Korzystanie jest bezpłatne, jednak ponowna publikacja kodu podlega naszym Zasadom serwisu.

Unlock powerful tools & indicators → pointalgo.com
Wyłączenie odpowiedzialności
Informacje i publikacje nie stanowią i nie powinny być traktowane jako porady finansowe, inwestycyjne, tradingowe ani jakiekolwiek inne rekomendacje dostarczane lub zatwierdzone przez TradingView. Więcej informacji znajduje się w Warunkach użytkowania.
Skrypt open-source
W zgodzie z duchem TradingView twórca tego skryptu udostępnił go jako open-source, aby użytkownicy mogli przejrzeć i zweryfikować jego działanie. Ukłony dla autora. Korzystanie jest bezpłatne, jednak ponowna publikacja kodu podlega naszym Zasadom serwisu.
Unlock powerful tools & indicators → pointalgo.com
Wyłączenie odpowiedzialności
Informacje i publikacje nie stanowią i nie powinny być traktowane jako porady finansowe, inwestycyjne, tradingowe ani jakiekolwiek inne rekomendacje dostarczane lub zatwierdzone przez TradingView. Więcej informacji znajduje się w Warunkach użytkowania.