Trend-Based Fibs: Manual Anchor Logic
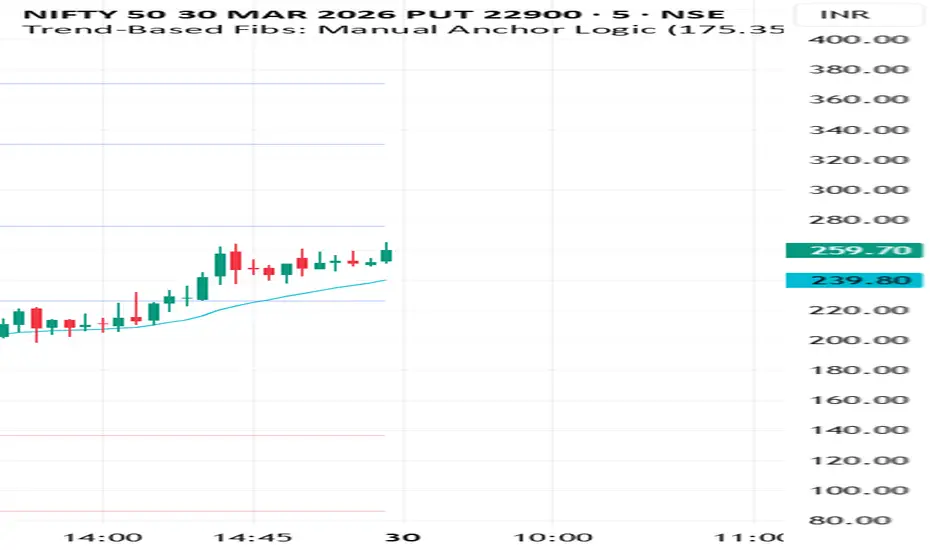
Trend-Based Fibonacci: Manual Anchor Logic
This indicator provides a streamlined way to project Fibonacci extension levels based on a user-defined price range (Anchor A and Anchor B) applied to the opening price of a new period. It is designed for traders who want to quantify "Range Expansion" relative to historical volatility.
How it Works
Unlike standard Fibonacci tools that strictly measure a single move, this script calculates the magnitude of a manual range (e.g., a previous day's high/low) and projects that specific distance from the first candle's close of the current Daily or Weekly session.
Key Features
Manual Anchor Points: Input your own key levels (Support/Resistance or Swing points) to define the base volatility.
Dual-Direction Projections: Automatically plots both Bullish (+) and Bearish (-) extensions (0.236, 0.5, 0.786, 1.0, and 1.618) simultaneously.
Dynamic Session Refresh: Levels automatically reset and recalculate at the start of every New Day or New Week.
Clean Visuals: Includes a "Hide Historical Levels" toggle to keep your charts clutter-free and focused only on the current session's price action.
Built-in EMA: A toggleable 20-period EMA to provide immediate trend context alongside your Fib levels.
How to Use
Identify your Range: Look at a previous significant move or a higher-timeframe candle and note the High/Low prices.
Input Anchors: Enter these prices into the "Anchor Point A" and "B" fields in the settings.
Execute: Use the projected levels as potential take-profit targets, reversal zones, or "measured move" objectives for the current session.
This indicator provides a streamlined way to project Fibonacci extension levels based on a user-defined price range (Anchor A and Anchor B) applied to the opening price of a new period. It is designed for traders who want to quantify "Range Expansion" relative to historical volatility.
How it Works
Unlike standard Fibonacci tools that strictly measure a single move, this script calculates the magnitude of a manual range (e.g., a previous day's high/low) and projects that specific distance from the first candle's close of the current Daily or Weekly session.
Key Features
Manual Anchor Points: Input your own key levels (Support/Resistance or Swing points) to define the base volatility.
Dual-Direction Projections: Automatically plots both Bullish (+) and Bearish (-) extensions (0.236, 0.5, 0.786, 1.0, and 1.618) simultaneously.
Dynamic Session Refresh: Levels automatically reset and recalculate at the start of every New Day or New Week.
Clean Visuals: Includes a "Hide Historical Levels" toggle to keep your charts clutter-free and focused only on the current session's price action.
Built-in EMA: A toggleable 20-period EMA to provide immediate trend context alongside your Fib levels.
How to Use
Identify your Range: Look at a previous significant move or a higher-timeframe candle and note the High/Low prices.
Input Anchors: Enter these prices into the "Anchor Point A" and "B" fields in the settings.
Execute: Use the projected levels as potential take-profit targets, reversal zones, or "measured move" objectives for the current session.

Wyłączenie odpowiedzialności
Informacje i publikacje nie stanowią i nie powinny być traktowane jako porady finansowe, inwestycyjne, tradingowe ani jakiekolwiek inne rekomendacje dostarczane lub zatwierdzone przez TradingView. Więcej informacji znajduje się w Warunkach użytkowania.
Wyłączenie odpowiedzialności
Informacje i publikacje nie stanowią i nie powinny być traktowane jako porady finansowe, inwestycyjne, tradingowe ani jakiekolwiek inne rekomendacje dostarczane lub zatwierdzone przez TradingView. Więcej informacji znajduje się w Warunkach użytkowania.