Wskaźnik
Wskaźniki rozpiętości rynku

Wskaźnik

Percent Pivot DailyIndicatore che aiuta a individuare punti percentuali sul grafico. Nella fatti specie i quarti di punto percentuale
Wskaźnik

Wskaźnik

CHG% watchlist 10+ stocks (within .5%)Im a 15 year old coder/trader and i use CHG% to determine the stocks i trade so i made this indicator to show the Change % whilst in replay mode so i can backtest (:
Wskaźnik

gold longer bulishThe US Dollar (USD) softens after reports that Iran’s Foreign Minister Abbas Araghchi is expected in Islamabad on Friday night, according to Al Arabiya. Iran’s state news agency IRNA said the visit is for talks with Pakistani officials, not with the US for now. Still, the news has slightly improved hopes for future talks, offering some support to Gold.
On the data front, the University of Michigan’s Consumer Sentiment Index fell to 49.8 in April from 53.3 in March. The Consumer Expectations Index also declined to 48.1 from 51.7, pointing to a weaker outlook. Meanwhile, 1-year inflation expectations surged to 4.7% from 3.8% in March, while the 5-year outlook rose to 3.5%, marking the highest level since October 2025.
Wskaźnik

Wskaźnik

Power Trend [Webster]Implements Mike Webster's Power Trend criteria:
Low has to be above 21 EMA for 10 consecutive days
The 21 EMA is above the 50 SMA for at least 5 days
the 50 SMA is in an uptrend
The final criteria:
Power Trend starts on an up day
Is intentionally not included based on commentary in WRO 68.
Rules:
initiation a Power Trend -
When one of the 3 criteria are met, a yellow dot appears.
When two of the 3 criteria are met, an orange dot appears.
When all 3 criteria are met, a green dot appears
when the Power Trend is in danger -
An orange dot appears with a close below the 21 EMA
The power trend shuts off -
When the 21EMA closes below the 50 SMA
Wskaźnik

umbul98-Doji RSI with Divergence🔹 1. Basic Logic
This indicator combines two things:
🕯 Doji candlestick pattern → Indecision/reversal signal
📈 RSI (Relative Strength Index) → Overbought/oversold condition
👉 So instead of a Doji alone:
It produces a more filtered signal with “Doji + RSI position”.
🔹 2. How is a Doji Detected?
The indicator defines a classic Doji as follows:
The candle body is very small.
The upper and lower wicks are close together (balance exists).
In the code:
Body = less than 5% of the total range.
Wicks are approximately equal.
👉 This allows:
True indecision candles are filtered out (junk Dojis are eliminated).
🔹 3. RSI Integration (The most critical part)
It divides Dojis into 3 categories according to RSI:
🟢 1. Lower Boundary Doji (RSI ≤ 30)
Oversold zone
Doji = selling pressure may be weakening
👉 Interpretation: Possibility of an uptrend
🔴 2. Upper Boundary Doji (RSI ≥ 70)
Overbought zone
Doji = buying pressure may be weakening
👉 Interpretation: Possibility of a downtrend
⚪ 3. Neutral Doji (30 < (RSI < 70)
Uncertain market
👉 Comment: Wait / direction unclear
🔹 What does the 4th chart show?
✔️ "D" label on the candle
Marks the bar where a Doji is forming
Meaning changes according to color:
🟢 Green → Possible upward reversal
🔴 Red → Possible downward reversal
⚪ Gray → Undecided
✔️ Background Colors
Green → RSI low + Doji
Red → RSI high + Doji
Gray → Neutral
👉 This is a very good visual filter 👍
✔️ Tooltip (explanation when hovered over)
Each label has a comment:
“May show an upward trend”
“May show a downward trend”
✔️ Alarm System
There are 3 different alarms:
RSI ≤ 30 + Doji
RSI ≥ 70 + Doji
Neutral Doji
👉 Can be linked to TradingView alarm
🔹 5. Purpose of Use
This indicator is especially useful for: Ideal:
✅ Bottom capture (reversal)
RSI below 30 + Doji → strong signal
✅ Top capture
RSI above 70 + Doji → selling opportunity
✅ Fake signal filtering
Confirmation with RSI instead of Doji alone
🔹 6. Strengths
✔ Noise-reduced Doji detection
✔ Smart filtering with RSI
✔ Visually very clear (label + background)
✔ Alarm supported
✔ Simple but effective strategy infrastructure
🔹 7. Weaknesses (Important ⚠️)
❗ If used alone:
Can mislead in trend market
Constantly generates Doji (especially low timeframe)
👉 Therefore, best use:
With EMA trend filter
With support/resistance
Consolidation breakout island
Wskaźnik

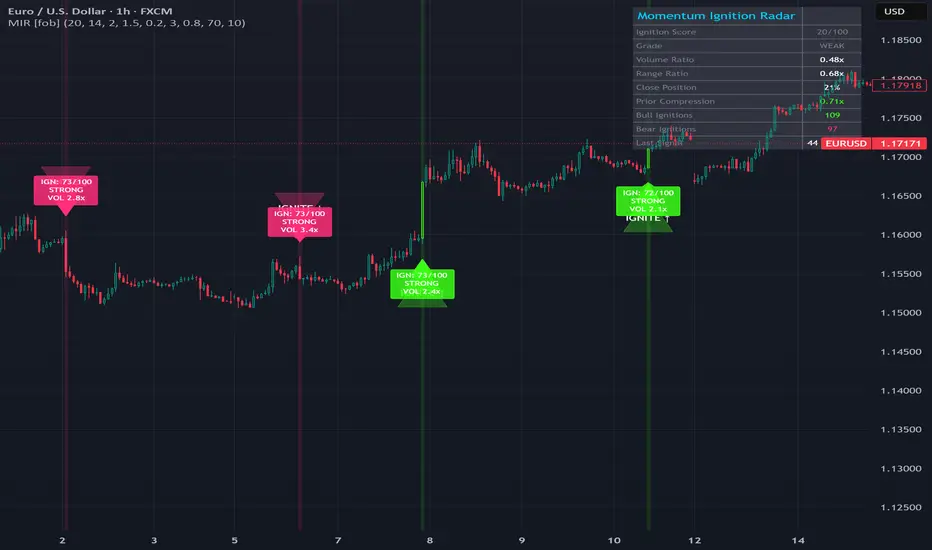
Momentum Ignition Radar [forexobroker]Momentum Ignition Radar detects "ignition events" -- bars where four independent conditions line up simultaneously to produce an explosive directional move. A volume spike, a range expansion, a close at the very edge of the bar, and a compressed prior window all combine into a single 0-100 Ignition Score. When the score breaches the threshold, the bar is classified as BUILDING, STRONG, EXPLOSIVE, or NUCLEAR, and a directional signal fires.
This indicator is designed for momentum traders who want to catch breakouts at their earliest high-conviction bar rather than chasing them several bars later. By scoring four compound factors instead of relying on a single condition, it filters out average breakouts and highlights only the bars where all the ingredients for a sustained move are present.
🔶 CONCEPTS
Sustained momentum moves rarely begin with a random wide bar. They almost always begin with a specific structural signature: the market has been quiet (prior compression), volume suddenly floods in, the range dilates well beyond recent norms, and the bar closes decisively at one of its extremes rather than in the middle. Each of these alone is a weak signal; together they form an ignition. Scoring them additively produces a robust filter that rewards the combination rather than any single ingredient.
🔶 HOW IT WORKS
- Calculates four components, each scored 0-25: Volume Spike, Range Expansion, Close Extreme, Prior Compression
- Sums them into a 0-100 Ignition Score and assigns a grade (BUILDING/STRONG/EXPLOSIVE/NUCLEAR)
- Fires BUY when score >= threshold on a bullish close; SELL when score >= threshold on a bearish close
- Cooldown prevents repeated signals within a user-defined window
- Optional radar-sweep background tints the entire ignition bar
🔶 HOW TO USE
1. Add the indicator -- the ignition dashboard (top-right) updates every bar with current component scores
2. Watch the Ignition Score: BUILDING (40+) shows conditions assembling, EXPLOSIVE (75+) is the prime entry zone
3. Green BUY triangles with "IGNITE ↑" label fire on bullish ignitions; pink SELL triangles on bearish ones
4. The radar-sweep background tints the ignition bar so you can scan history quickly for prior setups
5. Raise the Ignition Score Threshold for only NUCLEAR-grade entries; lower it for more frequent signals on faster timeframes
🔶 FEATURES
- Non-repainting signals (barstate.isconfirmed)
- Works on all timeframes and instruments
- 9 alert conditions with JSON webhook support
- Four-component additive scoring system with live breakdown
- Ignition grade classifier (BUILDING / STRONG / EXPLOSIVE / NUCLEAR)
🔶 SETTINGS GUIDE
- Volume SMA Length -- Baseline for volume spike detection
- ATR Length -- Volatility reference for range expansion and compression measurement
- Volume Spike Multiplier -- Volume must exceed this multiple of SMA to earn full volume score
- Range Expansion Multiplier -- Bar range must exceed this multiple of ATR for full range score
- Close Extreme Threshold -- How close (as fraction of bar range) the close must be to the top/bottom extreme
- Prior Compression Bars -- Number of bars whose average range is checked for prior quietness
- Compression Ratio -- Prior average range must be below this fraction of ATR to earn full compression score
- Ignition Score Threshold -- Minimum 0-100 composite score to trigger signal
- Signal Cooldown Bars -- Minimum bars between consecutive signals
🔶 ALERTS
- MIR Buy Ignition -- Bullish ignition event confirmed
- MIR Sell Ignition -- Bearish ignition event confirmed
- MIR Any Signal -- Any directional ignition
- MIR Nuclear -- Ignition score reaches 90+
- MIR Volume Spike -- Volume exceeds spike multiplier
- MIR Range Expansion -- Range exceeds expansion multiplier
- MIR Compression -- Prior-bar compression detected
- MIR Any Ignition Bar -- Ignition bar detected (before direction filter)
- MIR Webhook JSON -- Generic webhook payload for external automation
🔶 LIMITATIONS & DISCLAIMER
- This is a technical analysis tool, not financial advice. Always use proper risk management.
- Past ignition events do not guarantee future price movements.
- Signals fire on bar close; acting on unconfirmed live bars will introduce repaint risk.
- The Ignition Score is an additive heuristic over four structural factors, not a statistically calibrated probability of a profitable outcome.
Wskaźnik
gold predactionGold (XAU/USD) price recovers some ground on Friday, extending its gains above $4,700 as market sentiment remains upbeat amid headlines from Iran and the US pointing to a resumption of second-round talks aimed at ending the conflict. At the time of writing XAU/USD trades at $4,726, up 0.47%
Middle East headlines kept investors optimistic about a diplomatic end to the war. However, traders must be aware that uncertainty remains high after scheduled talks at the beginning of the week failed as the Iranian delegation didn’t confirm its attendance
Wskaźnik

gold anlysisGold trades modestly higher on the day above $4,700 after having touched a fresh 10-day low below $4,660 earlier in the day, but looks to end the week in negative territory. Intensifying US-Iran tensions over the Strait of Hormuz and the lack of progress in peace talks keep investors on edge. Moreover, reviving inflationary fears temper expectations for a more dovish US Federal Reserve and underpin the US Dollar, which is seen weighing on the yellow metal.
Wskaźnik

MU indicator ict The indicator plots 4 ICT concepts directly on your chart:
1. Fair Value Gaps (FVG)
Colored boxes that appear when there's an imbalance between 3 candles — price tends to come back and fill these. Green = bullish gap, Red = bearish gap.
2. Order Blocks (OB)
Boxes that mark the last candle before a big move — these are areas where institutions placed orders. Blue = bullish OB, Orange = bearish OB.
3. Liquidity Sweeps
Dotted lines at swing highs and lows (where stop losses cluster). When price wicks through one and closes back, it labels it "SWEEP ↑" or "SWEEP ↓" — this signals a potential reversal.
4. Market Structure Shift (MSS)
When price breaks a key swing high or low, it labels it "MSS ▲" or "MSS ▼" — this tells you the trend may be changing direction.
The idea is you look for these concepts to line up — for example, a liquidity sweep into an order block with an FVG nearby, followed by an MSS, is a classic ICT entry signal.
Want me to add anything else to it, like Killzones, NWOG/NDOG, or Premium/Discount zones?
Wskaźnik

RalisLine SpreadRalisLine Spread is a companion histogram for the RalisLine overlay. It measures the percentage gap between the fastest and slowest smoothed moving averages in a 4-SMMA ribbon, rendering that spread as a color-coded histogram below the chart. Gold bars above zero mean the ribbon is fanned out bullish — all four SMAs aligned with the fast line leading upward. Blue bars below zero mean bearish alignment. Gray bars appear when the ribbon is tangled — the inner lines disagree with the outer lines, indicating a regime transition is in progress.
The indicator uses a 3-state regime classification that goes beyond simple spread direction. It's not enough for the fast SMMA to be above the slow one — the two inner lines must also confirm the alignment. This "inconclusive" detection prevents false regime calls during crossover periods when the ribbon is tangled and direction is genuinely uncertain.
A 9-period EMA signal line (magenta) overlays the histogram. When the spread crosses above its signal line, a green triangle marks the crossover — momentum is building and the regime is strengthening. When it crosses below, a red triangle marks the fading — momentum is weakening. These signal line crossovers typically lead regime flips by several bars, giving you early warning before the RalisLine overlay changes color. A MACD-style fill between the spread and signal line shades green when spread is above signal and red when below, making the momentum relationship visible at a glance.
Bar brightness indicates acceleration. When the spread is growing in its current direction — bullish bars getting taller or bearish bars getting deeper — bars render at full brightness. When the spread is shrinking toward zero (regime fading), bars dim to 50% opacity. This means a bright gold bar is a strengthening bull trend, while a dim gold bar is a bull trend losing steam. The dimming often appears several bars before a regime flip, adding another layer of early warning beyond the signal line crossovers.
An optional percentile reference line (off by default, toggle in settings) ranks the current absolute spread against a 120-bar rolling history using ta.percentrank(). This solves the cross-asset comparison problem — a 2% spread on gold means something very different than 2% on a volatile altcoin. The percentile line turns orange above the 80th percentile (spread is extreme for this asset), blue below the 20th (spread is compressed, transition likely), and white in between. The percentile value is always shown in the info table even when the line is hidden.
The info table displays five fields: Regime (BULLISH/BEARISH/NEUTRAL with color-coded background), Spread (current percentage), Momentum (GROWING or FADING based on acceleration), Percentile (rank against rolling history), and Signal (ABOVE or BELOW the signal line). The table can be toggled off in settings for a cleaner pane.
Six alert conditions are available: Signal Cross Up (spread crossed above signal EMA), Signal Cross Down (spread crossed below), Zero Cross Up (spread turned positive — fast SMMA now leading slow), Zero Cross Down (spread turned negative), Regime to Bullish (ribbon aligned bullish from inconclusive or bearish), and Regime to Bearish (ribbon aligned bearish).
Default SMMA lengths are 8/16/24/32 on HL2, matching the RalisLine overlay for synchronized regime reads. For best results, use both indicators on the same chart — RalisLine shows the structural ribbon directly on price while RalisLine Spread shows the momentum and conviction beneath it. The signal line crossovers on the Spread often fire 3–5 bars before the RalisLine flip dots appear on the overlay, giving you a head start on regime transitions.
Works on any asset and any timeframe. No repainting.
Wskaźnik

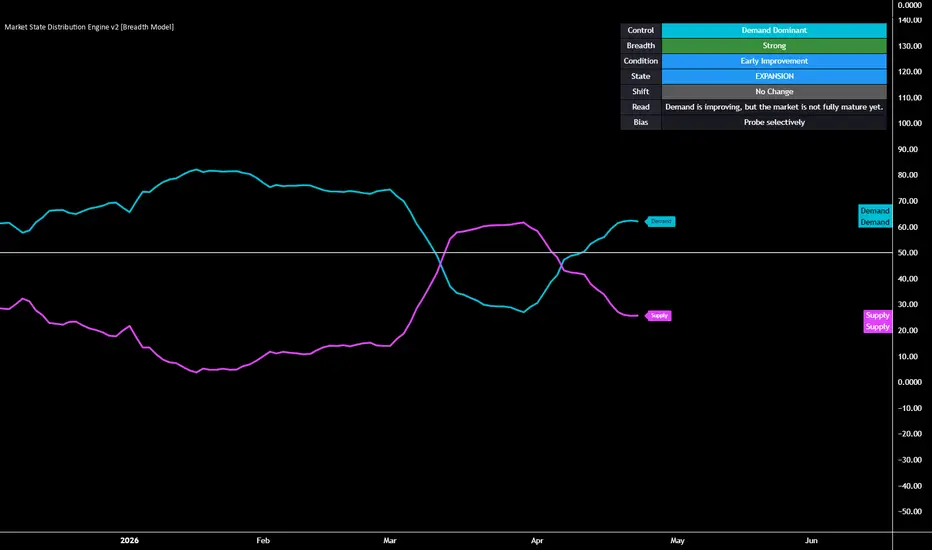
Market State Distribution Engine v2 [Breadth Model]Market State Distribution
Market State Distribution is a breadth-based market internals indicator designed to visualize the balance between demand and supply using underlying participation, structural strength, and leadership behavior.
Rather than relying on price alone, the model aggregates multiple internal components into a normalized framework to help evaluate whether conditions are improving, weakening, or transitioning.
This script is intended for educational and informational purposes only. It does not provide financial advice or standalone trading signals.
________________________________________
Overview
Market State Distribution is built to help evaluate underlying market conditions using internal breadth data.
Instead of focusing on a single metric, the model combines multiple internal inputs into a unified structure. This allows users to assess whether internal conditions appear:
• Supportive
• Weakening
• Mixed or transitional
The goal is to provide a simplified view of broader market conditions.
________________________________________
Quick Read Guide
• Demand > Supply → Internal conditions are more supportive
• Supply > Demand → Internal conditions are weaker
• Crossovers → Potential internal shifts in control
• Expansion state → Early-stage improvement environment
• Trend state → Sustained participation and stronger conditions
• Demand ≈ Supply → Mixed / lower conviction environment
This indicator is designed as a context tool, not a signal generator.
________________________________________
Data Inputs
The model uses breadth-style market internals as its primary inputs. By default, these include:
• Percent of symbols above intermediate-term moving average (INDEX:S5FI)
• Percent of symbols above longer-term moving average (INDEX:S5TH)
• New highs minus new lows (INDEX:NYHL)
These inputs are used to approximate:
• Participation (breadth of strength)
• Structural strength (trend stability)
• Leadership behavior (expansion vs deterioration)
Some data inputs may require specific Trading View subscriptions.
Users may substitute equivalent symbols depending on availability.
________________________________________
Core Model Components
Participation Strength
Measures how broadly strength is distributed across the market using intermediate-term breadth data.
Higher values suggest broader participation; lower values suggest narrowing conditions.
Structural Strength
Represents longer-term trend alignment using broader participation above long-term averages.
Helps assess whether underlying structure is supportive or deteriorating.
Leadership Behavior
Uses new highs vs new lows data to evaluate whether leadership is expanding or weakening.
Provides confirmation beyond participation metrics alone.
________________________________________
State Modeling
The indicator transforms the underlying inputs into normalized components and combines them into a synthetic state model.
The model estimates the relative distribution of:
• Trend
• Expansion
• Decay
• Transition
These are descriptive categories designed to reflect current internal conditions, not predict future price movement.
________________________________________
Demand vs Supply Framework
The core output of the indicator is the relationship between Demand and Supply:
• Demand = Trend + Expansion components
• Supply = Decay component
Interpretation (contextual, not prescriptive):
• Demand > Supply → Internal conditions may be more supportive
• Supply > Demand → Internal conditions may be weaker
• Demand ≈ Supply → Conditions may be mixed or transitional (lower conviction environment)
This framework is intended to help interpret internal market tone.
________________________________________
State Classification
The indicator classifies the current environment into one of four states:
• Trend
• Expansion
• Decay
• Transition
These labels summarize which internal condition appears most dominant.
________________________________________
Shift Detection
The model evaluates changes in the Demand/Supply relationship to identify internal shifts:
• Demand crossing above Supply → Improving conditions
• Supply crossing above Demand → Deteriorating conditions
• No crossover → No significant change
This is designed to highlight internal shifts, not generate trade signals.
________________________________________
Visualization
Primary Lines
• Demand
• Supply
These are plotted in a separate pane to visualize internal strength vs deterioration over time.
Summary Table (Optional)
Provides a structured overview of:
• Control (Demand vs Supply dominance)
• Breadth condition
• Market condition
• State classification
• Shift
• Read (contextual interpretation)
• Bias (contextual framing)
Optional end-of-line labels can be enabled for clarity.
________________________________________
How to Use
This indicator is designed as a market context tool.
A typical workflow may include:
1. Applying the indicator to a broad market index
2. Observing whether Demand or Supply is dominant
3. Reviewing the state table for context
4. Combining insights with price structure, volatility, and risk management
The objective is to support contextual awareness—not replace independent analysis.
________________________________________
Configurable Inputs
Data Sources
• Custom breadth symbols for participation, structure, and leadership inputs
Logic Settings
• Smoothing length
• Control gap threshold
• Demand strength/weakness levels
• Decay dominance level
Display Options
• Show/hide summary table
• Show/hide line labels
• Show/hide reference levels
• Table size customization
________________________________________
Important Notes
• This script is provided for educational and informational purposes only
• It does not provide financial advice or trade recommendations
• It does not execute trades or manage positions
• Outputs are descriptive, not predictive
• Historical behavior does not guarantee future results
• Data availability may vary depending on your Trading View plan
All trading decisions should be made using independent judgment and appropriate risk management.
Wskaźnik
RSI+EMA+WMA📊 RSI Custom EMA 9 & WMA 45 + Extreme Zones
RSI Custom EMA 9 & WMA 45 + Extreme Zones là một chỉ báo động lượng nâng cao, kết hợp giữa RSI truyền thống, đường trung bình động trên RSI (EMA & WMA) và vùng cực trị (Extreme Zones) để giúp trader xác định:
Xu hướng động lượng
Điểm đảo chiều tiềm năng
Phân kỳ (Divergence)
Vùng quá mua / quá bán mở rộng
⚙️ Thành phần chính
1. RSI (Relative Strength Index)
Sử dụng công thức chuẩn của Wilder (RMA-based)
Phản ánh sức mạnh và tốc độ của biến động giá
Các mức quan trọng:
70 → Quá mua
30 → Quá bán
50 → Cân bằng xu hướng
2. EMA 9 trên RSI (Signal Line)
Đường EMA nhanh giúp:
Phát hiện thay đổi momentum sớm
Xác định tín hiệu đảo chiều ngắn hạn
Hoạt động như “trigger line”
3. WMA 45 trên RSI (Trend Line)
Đường WMA chậm hơn, mượt hơn
Dùng để:
Xác định xu hướng chính của RSI
Lọc nhiễu tín hiệu từ EMA
4. Extreme Zones (80 / 20)
Mở rộng vùng quá mua/quá bán:
80–100 → Overbought mạnh
0–20 → Oversold mạnh
Tính năng:
Highlight vùng nền (background zones)
Vạch dọc (vertical highlight) khi RSI chạm vùng cực trị
Màu sắc có thể tùy chỉnh
👉 Đây là vùng thường xuất hiện:
Buying Climax / Upthrust
Selling Climax / Spring
5. Divergence Detection (Phân kỳ)
Tự động phát hiện:
Bullish Divergence
Bearish Divergence
Sử dụng pivot xác nhận (không repaint)
Điều kiện:
Bullish:
Giá tạo Lower Low
RSI tạo Higher Low
Bearish:
Giá tạo Higher High
RSI tạo Lower High
🎯 Cách sử dụng
Xác định xu hướng
RSI > WMA 45 → xu hướng tăng
RSI < WMA 45 → xu hướng giảm
Tín hiệu vào lệnh
BUY Setup
RSI ≤ 20 (Extreme Oversold)
Xuất hiện Bullish Divergence
EMA 9 cắt lên WMA 45
SELL Setup
RSI ≥ 80 (Extreme Overbought)
Xuất hiện Bearish Divergence
EMA 9 cắt xuống WMA 45
Xác nhận nâng cao
Chỉ báo hoạt động hiệu quả hơn khi kết hợp với:
Price Action
Supply / Demand Zones
Volume Analysis (VSA, Wyckoff)
⚡ Điểm nổi bật
✔ RSI chuẩn (Wilder) – độ chính xác cao
✔ Kết hợp EMA + WMA → vừa nhanh vừa ổn định
✔ Extreme Zones giúp phát hiện vùng “quá đà” của thị trường
✔ Divergence không repaint
✔ Tùy chỉnh màu sắc linh hoạt
✔ Phù hợp với scalping, intraday và swing
⚠️ Lưu ý
Không nên sử dụng RSI Extreme như tín hiệu vào lệnh độc lập
Nên kết hợp với cấu trúc thị trường và thanh khoản
Divergence mạnh hơn khi xuất hiện tại vùng 80 / 20
🧠 Tóm tắt tư duy hệ thống
Chỉ báo này hoạt động theo mô hình:
Momentum (RSI) + Trend Filter (WMA) + Signal (EMA) + Exhaustion (Extreme Zones) + Reversal (Divergence)
Wskaźnik

Steph CAMARA Template + EMA100Template nom + EMA 100 intégrée. permet d'affiche un slogan et ton nom sur le graphique avec la moyenne mobile exponentielle 100
Wskaźnik

ETH VWAP ATR Scalper Linesthis is the full ETH VWAP ATR Scalper Lines script, and it includes:
VWAP line.
Entry line.
Stop line.
TP1 line.
TP2 line.
BUY/SELL triangle signals.
Alert conditions.
Info label with ATR, VWAP, entry, stop, and targets.
Small note
This version does not include the stats table or box-style labels. It is the simpler line-and-triangle version you had before. If you want the one you liked best, that was the version with:
box-style BUY/SELL labels,
stats table,
and the same entry/stop/TP lines
Wskaźnik

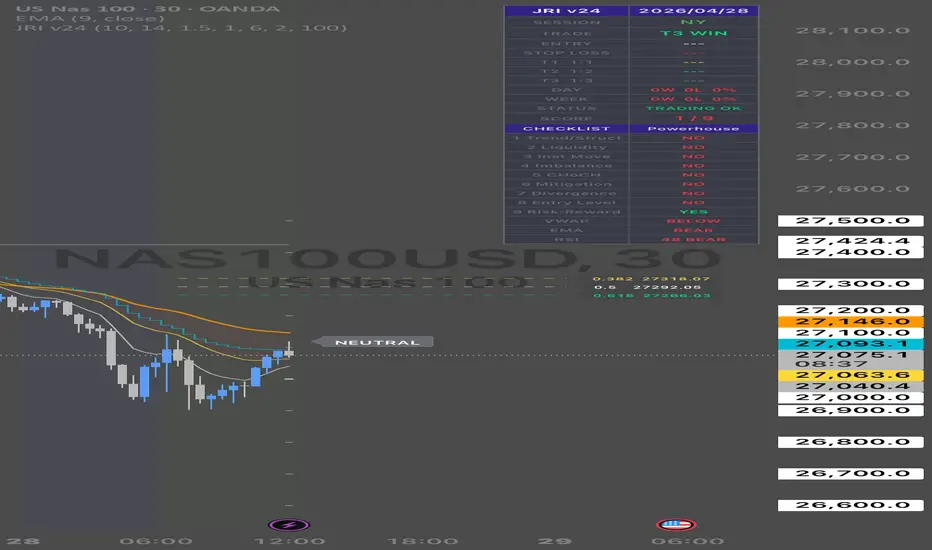
JRI SMC v22THE 7 CONDITIONS YOUR INDICATOR CHECKS
1. Bias — Is the market structure bullish (HH+HL) or bearish (LH+LL)?
2. In Zone — Is price inside a confirmed supply or demand zone?
3. BOS — Did price break a recent structure level in your direction?
4. Retest — Did price come back and test that broken level?
5. vs VWAP — Is price above VWAP for buys, below for sells?
6. EMA Stack — Is EMA 20 above EMA 50 for buys, below for sells?
7. RSI — Is RSI above 50 for buys, below 50 for sells?
All 7 pointing the same direction means institutions are aligned with your trade. That’s when you pull the trigger.
Wskaźnik

JRI SMC v17THE 7 CONDITIONS YOUR INDICATOR CHECKS
1. Bias — Is the market structure bullish (HH+HL) or bearish (LH+LL)?
2. In Zone — Is price inside a confirmed supply or demand zone?
3. BOS — Did price break a recent structure level in your direction?
4. Retest — Did price come back and test that broken level?
5. vs VWAP — Is price above VWAP for buys, below for sells?
6. EMA Stack — Is EMA 20 above EMA 50 for buys, below for sells?
7. RSI — Is RSI above 50 for buys, below 50 for sells?
All 7 pointing the same direction means institutions are aligned with your trade. That’s when you pull the trigger.
Wskaźnik
JRI SMC v15New update YOUR SESSION SCHEDULE
Your primary window is the NY Open — 6:30am PST. This is when the highest volume hits and the cleanest moves happen. Gold (MGC/GC) and NQ are your instruments. Run your top-down analysis the night before or early morning before the open. Have your levels marked, your bias set, your zones identified. When the open hits you’re ready to execute, not still analyzing.
Wskaźnik

JRI SMC v12THE JRI SMART MONEY STRATEGY
Philosophy
You trade with institutions, not against them. Every decision flows from the higher timeframe down to the lower timeframe. You never enter on a lower timeframe without confirmation from above.
STEP 1 — WEEKLY (Big Picture)
Start here every week before you trade anything.
Find the ATH and ATL on the chart. These are your absolute boundaries — price respects these levels hard. Note whether the weekly candle is bullish or bearish. Is price making Higher Highs and Higher Lows (bullish) or Lower Highs and Lower Lows (bearish)? This tells you the macro bias. Only trade in the direction of the weekly trend unless you have an extremely strong counter-trend setup.
STEP 2 — DAILY (Directional Bias)
This is where you determine your bias for the week.
Look for the most recent swing High and swing Low. Mark them. Is price respecting a previous HH or HL? Is it breaking below a HL (bearish shift) or above a LH (bullish shift)? Measure the wick of the previous day’s candle — the wick shows where institutions rejected price. That rejection zone becomes your supply or demand area. The daily bias tells you whether you’re only looking for BUYs or only looking for SELLs on the lower timeframes that day.
STEP 3 — 4 HOUR (Key Levels and Zones)
This is your map for the trading session.
Draw your key psychological levels — on Gold these are every 100 points: 4700, 4800, 4900, 5000. Price always gravitates toward and reacts at these round numbers because that’s where institutions place large orders. Mark your supply zones (areas where price sold off hard from) and demand zones (areas where price bounced hard from). These become your trade locations — you only look to enter when price reaches one of these zones, not in the middle of a range.
STEP 4 — 2 HOUR (Institutional Activity)
This is where you identify what the big players are doing.
Look for institution candles — large body candles that are 2x the average size. These are institutions entering positions. After a large institution candle, price often comes back to mitigate (retest) that candle before continuing. That mitigation point is a high-probability entry. Also look for liquidity sweeps — when price wicks above a recent high or below a recent low and immediately closes back. This is institutions hunting stops before the real move. After a liquidity sweep, the move goes the other direction.
STEP 5 — 1 HOUR (Entry Zone)
Now you’re narrowing down exactly where to enter.
Look for retracements back into the 4H supply or demand zone. If the daily bias is bullish and price pulls back to a 4H demand zone on the 1H, that’s your entry zone. Look for the 1H to show a Break of Structure in your direction — a BOS confirms institutions have shifted. If the trend is already running strong, you can enter on a retest of the broken structure level rather than waiting for a deep pullback.
STEP 6 — 30 MINUTE (Counter Trend Lines and Confirmation)
This refines your entry timing.
Draw a counter trend line against the current move. When price breaks that counter trend line in the direction of your bias, that’s your trigger to prepare for entry. This is also where you confirm SMC concepts — look for a mitigation block, an order block, or a fair value gap that price is filling before continuing your direction.
STEP 7 — 15 MINUTE (Final Entry Confirmation)
Your signal timeframe.
This is where the JRI indicator fires. All 7 conditions need to align — bias, zone, BOS, retest, VWAP, EMA stack, RSI. When the score hits 5, 6, or 7 out of 7 the signal fires. On your funded account only take 6/7 or 7/7. On personal accounts 5/7 is acceptable. The 15m gives you enough detail to see the setup clearly without being too noisy.
STEP 8 — 5 MINUTE and 1 MINUTE (Precision Entry and Scalping)
This is where you time the exact entry.
On the 5m and 1m you’re looking for the same things — liquidity sweeps, institution candles, BOS — but at a micro level. For scalps you enter at the candle HIGH on a BUY or candle LOW on a SELL. Your stop goes below the candle LOW on BUY or above the candle HIGH on SELL with 0.8x ATR buffer. You measure the move in 1:3 risk-reward.
RISK MANAGEMENT RULES — NON NEGOTIABLE
These apply to every single trade no exceptions.
At T1 (1:1 R) — take 50% of your position off. Lock in profit. This is not optional.
At T2 (1:2 R) — move your stop loss to your entry price. You are now in a risk-free trade.
At T3 (1:3 R) — close the remaining position. Full target hit.
Never move your stop loss against you. Never add to a losing position. If you’re in a funded account and the trade hits your SL, that’s the end of that trade. No revenge trading.
THE 7 CONDITIONS YOUR INDICATOR CHECKS
1. Bias — Is the market structure bullish (HH+HL) or bearish (LH+LL)?
2. In Zone — Is price inside a confirmed supply or demand zone?
3. BOS — Did price break a recent structure level in your direction?
4. Retest — Did price come back and test that broken level?
5. vs VWAP — Is price above VWAP for buys, below for sells?
6. EMA Stack — Is EMA 20 above EMA 50 for buys, below for sells?
7. RSI — Is RSI above 50 for buys, below 50 for sells?
All 7 pointing the same direction means institutions are aligned with your trade. That’s when you pull the trigger.
YOUR SESSION SCHEDULE
Your primary window is the NY Open — 6:30am PST. This is when the highest volume hits and the cleanest moves happen. Gold (MGC/GC) and NQ are your instruments. Run your top-down analysis the night before or early morning before the open. Have your levels marked, your bias set, your zones identified. When the open hits you’re ready to execute, not still analyzing.
Wskaźnik

Wskaźnik
