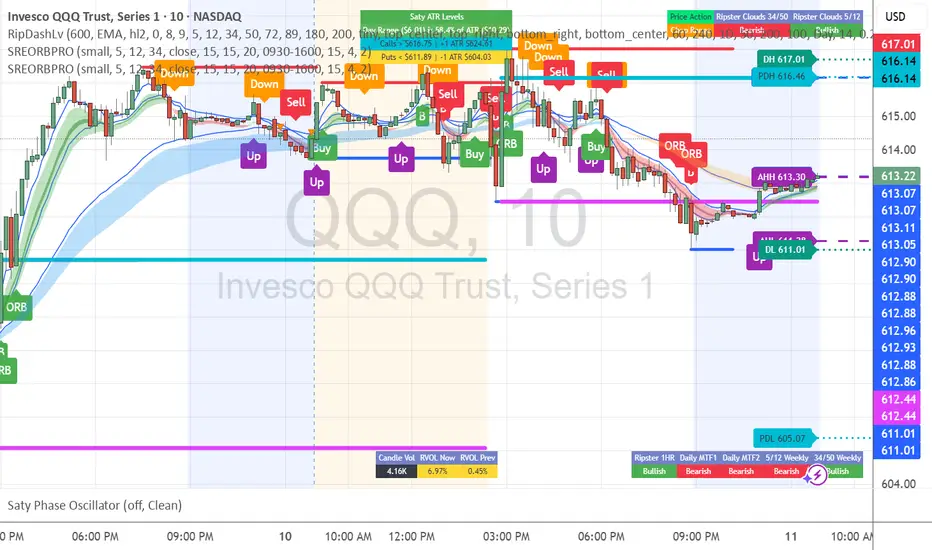
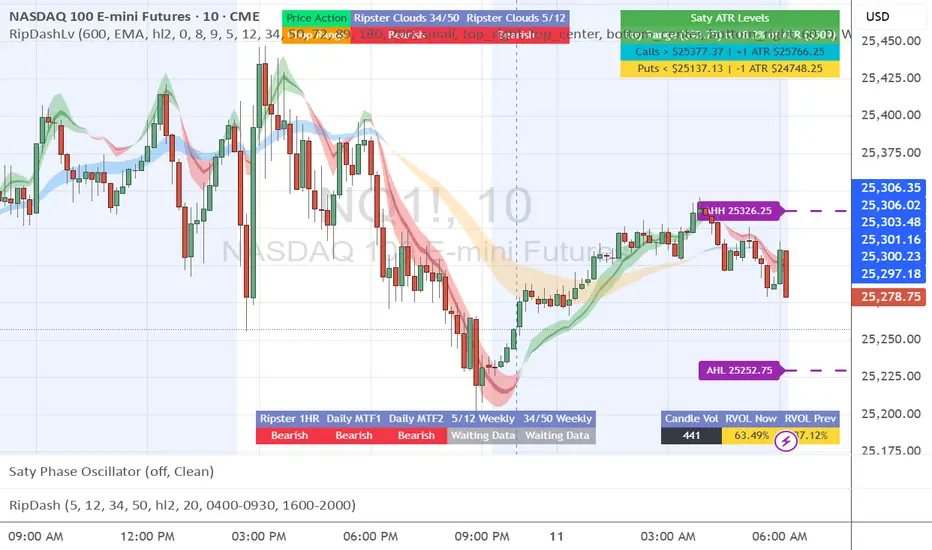
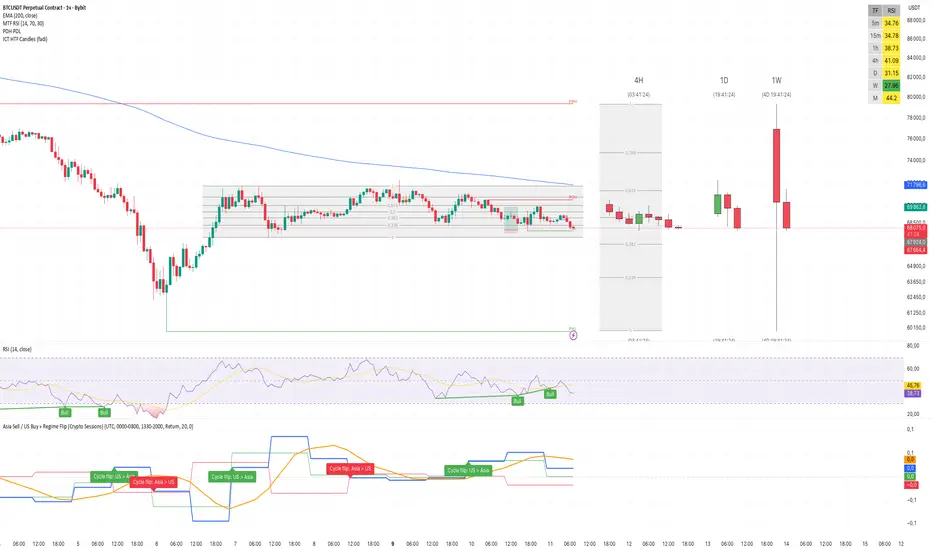
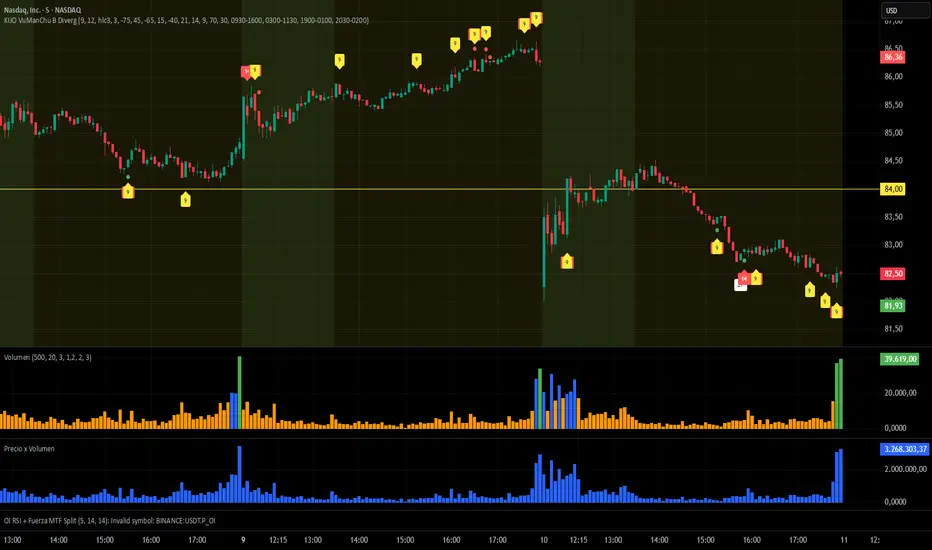
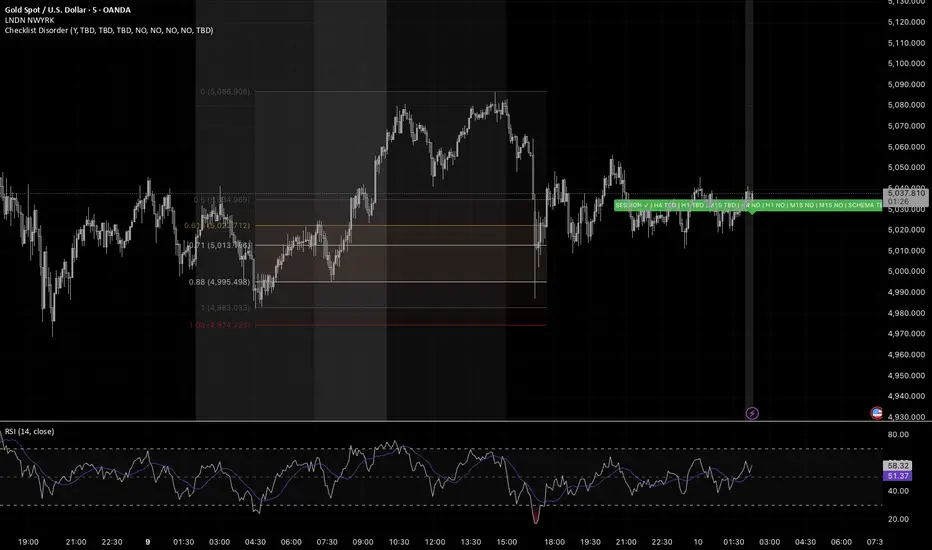
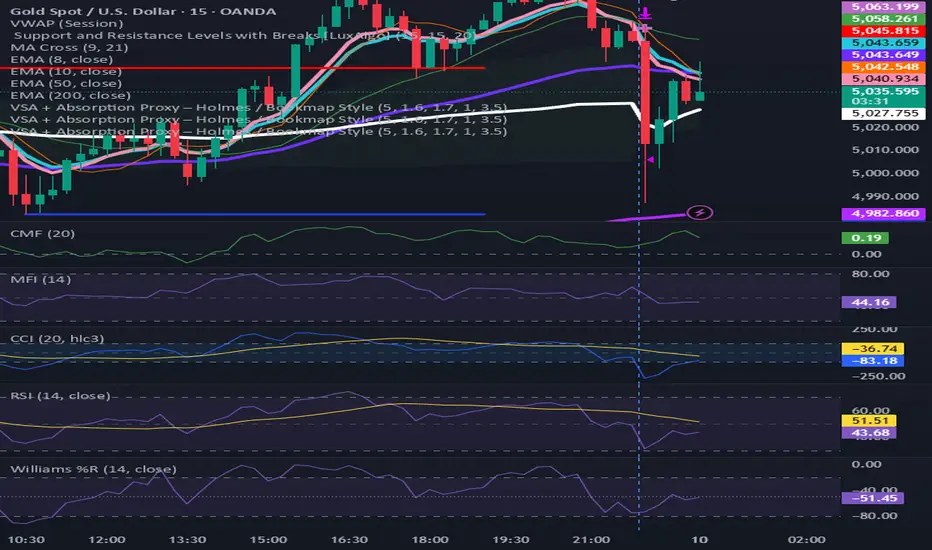
Williams Fractals by YoungAWilliams Fractals - Dynamic Period Indicator
This indicator identifies fractal patterns on the chart based on Bill Williams' fractal theory. A fractal is a price formation where the middle candle has the highest high (for down fractal) or lowest low (for up fractal) compared to surrounding candles.
Key Features:
- Customizable period - set any number of bars on each side (n=1 for 3-bar fractal, n=2 for 5-bar fractal, etc.)
- Down Fractal (▼) - white triangle above the bar indicates a local hig
Wskaźnik