Quantum Trend Matrix Pro AIQuantum Trend Matrix Pro AI
Quantum Trend Matrix Pro AI is a professional trend intelligence indicator developed by Forex_Market_Insights to help traders identify, measure, and understand market trends with greater confidence. Instead of relying on a single moving average or a basic crossover, this indicator combines multiple analytical engines into one complete trading framework that evaluates trend direction, trend quality, momentum strength, volatility conditions, market compression, breakout potential, and higher-timeframe confirmation.
The objective of this indicator is not simply to tell traders whether the market is bullish or bearish, but to provide a complete picture of the current market environment. It continuously analyzes price behavior and converts complex market information into an easy-to-read dashboard, intelligent scoring system, adaptive signals, and visual trend structure.
Whether you trade Forex, Gold, Indices, Crypto, Commodities, or Stocks, Quantum Trend Matrix Pro AI is designed to simplify market analysis while providing institutional-style trend confirmation and professional-grade visualization.
Why This Indicator Was Created
Many traditional EMA indicators only generate crossover signals without considering the quality of the trend. These signals often produce false entries during sideways markets because they ignore trend strength, momentum, volatility, and higher-timeframe confirmation.
Quantum Trend Matrix Pro AI was developed to solve these problems by introducing a multi-layer analytical framework.
Instead of asking only:
"Did the EMAs cross?"
this indicator asks much more important questions:
Is the trend actually strong?
Is momentum increasing or weakening?
Is the market preparing for a breakout?
Is volatility expanding or contracting?
Are higher timeframes supporting the trend?
Is the current trend mature or just beginning?
Is the market trending or simply ranging?
Only after evaluating these conditions does the indicator calculate the overall market bias and generate intelligent signals.
The goal is to reduce unnecessary trades while improving decision quality.
Core Philosophy
Every trend passes through different stages:
Trend Formation
Trend Confirmation
Trend Expansion
Trend Continuation
Trend Exhaustion
Trend Reversal
Most indicators only recognize one or two of these stages.
Quantum Trend Matrix Pro AI continuously monitors every stage and provides real-time information about where the market currently stands within the complete trend cycle.
Triple EMA Quantum Ribbon
The foundation of the indicator is a three-layer EMA system consisting of:
• Fast EMA
• Medium EMA
• Slow EMA
These moving averages work together to build a dynamic trend ribbon.
Instead of displaying three simple lines, the ribbon visually represents:
Trend direction
Trend strength
Trend alignment
Market structure
Ribbon expansion
Ribbon compression
When all EMAs align in the same direction, the market is considered healthy and trending.
When EMAs begin compressing together, the indicator recognizes weakening momentum and possible consolidation.
Dynamic Ribbon Coloring
The ribbon automatically changes appearance depending on market conditions.
Bullish trends display a green gradient.
Bearish trends display a red gradient.
Neutral markets gradually lose color intensity.
This allows traders to identify trend strength visually without studying numerical values.
Smart Trend Score (0–100)
One of the most powerful features is the Smart Trend Score.
Instead of simply showing bullish or bearish conditions, the indicator calculates a complete trend confidence score between 0 and 100.
The score is generated by combining multiple independent analytical models including:
EMA Alignment
EMA Slopes
Trend Persistence
Price Position
Momentum
Ribbon Spread
Market Stability
Volatility Context
The final score represents the overall quality of the current trend.
Higher scores indicate stronger bullish conditions.
Lower scores indicate stronger bearish conditions.
Values near the center suggest uncertainty or ranging markets.
This allows traders to judge trend quality instead of reacting only to moving average crosses.
Trend Grade Classification
The numerical score is converted into an easy-to-understand Trend Grade.
Possible grades include:
Very Weak
Weak
Moderate
Strong
Very Strong
Extreme
This classification helps traders quickly understand the current market condition without interpreting raw numbers.
Momentum Intelligence Engine
Momentum is one of the biggest drivers of market movement.
Quantum Trend Matrix Pro AI continuously measures whether momentum is:
Expanding
Contracting
Accelerating
Decelerating
Shifting
Becoming Exhausted
Rather than relying on traditional oscillators alone, momentum is evaluated alongside trend alignment and volatility.
This provides much more reliable confirmation.
EMA Spread Analytics
The indicator measures the distance between all three EMAs.
This spread reflects the health of the current trend.
A widening ribbon usually indicates:
Increasing trend strength
Healthy momentum
Strong directional movement
A narrowing ribbon often indicates:
Weakening trend
Consolidation
Possible reversal
Market compression
This information is displayed both visually and inside the dashboard.
Squeeze & Compression Engine
Markets alternate between periods of expansion and contraction.
The Squeeze Engine detects when volatility contracts and the ribbon becomes compressed.
During these periods the dashboard identifies:
Active Compression
Compression Start
Compression End
Breakout Ready
Expansion Phase
This helps traders prepare before major price movements occur rather than reacting after the breakout.
Multi-Timeframe Trend Matrix
One of the most valuable features is the Multi-Timeframe Matrix.
The indicator simultaneously evaluates multiple higher timeframes.
By default it analyzes:
15 Minutes
1 Hour
4 Hour
Daily
For every timeframe it displays:
Trend Direction
EMA Spread
Trend Grade
This enables traders to determine whether the current chart is aligned with the broader market.
Trading in the direction of higher timeframes generally increases the probability of successful trades.
Intelligent Signal Engine
Instead of generating basic crossover alerts, Quantum Trend Matrix Pro AI produces adaptive signals based on several confirmation layers.
Signal categories include:
Strong Buy
Buy
Weak Buy
Strong Sell
Sell
Weak Sell
Trend Continuation
Trend Reversal
Every signal is filtered using multiple analytical conditions before appearing on the chart.
This significantly reduces low-quality signals during sideways markets.
Premium Dashboard
The integrated dashboard summarizes all important market information in one location.
It displays:
Current Trend
Trend Score
Market Zone
Squeeze Status
Trend Grade
Trend Quality
Multi-Timeframe Analysis
Bias Direction
EMA Spread
Momentum State
Number of Trend Bars
The dashboard is designed to eliminate the need for multiple separate indicators.
Trend Background
The chart background automatically changes according to the dominant market condition.
This provides instant visual awareness without distracting from price action.
Alert System
The indicator includes multiple alert conditions for automated trading workflows.
Alerts include:
EMA Cross Up
EMA Cross Down
Trend Changes
Momentum Shift
Trend Score Threshold
Compression Start
Expansion Phase
Buy Signals
Sell Signals
Trend Reversals
Strong Trend Detection
These alerts allow traders to monitor opportunities without continuously watching the charts.
Non-Repainting Design
Quantum Trend Matrix Pro AI has been designed with non-repainting principles.
Signals are generated using confirmed candle data, and multi-timeframe calculations use confirmed higher-timeframe values. This helps ensure that historical signals remain consistent after candles close.
Who Can Use This Indicator?
Quantum Trend Matrix Pro AI is suitable for:
Forex Traders
Gold Traders
Crypto Traders
Stock Traders
Index Traders
Swing Traders
Intraday Traders
Day Traders
Position Traders
Primary Objectives
This indicator was developed to help traders:
Identify high-quality trends.
Measure trend strength objectively.
Filter weak EMA crossover signals.
Detect compression before breakouts.
Confirm trends across multiple timeframes.
Improve trade confidence through quantitative scoring.
Reduce emotional decision-making.
Simplify complex market analysis into one integrated tool.
Important Disclaimer
This indicator is designed exclusively for educational, analytical, and research purposes. It does not constitute financial advice, investment recommendations, or guaranteed trading performance. Financial markets involve substantial risk, and all trading decisions remain the sole responsibility of the user. Always perform independent analysis and apply sound risk management before entering any trade.
Verification & Clarification
This indicator is an original research and software development project created exclusively by Forex_Market_Insights. Every algorithm, calculation, mathematical model, trend engine, momentum engine, scoring methodology, visualization technique, dashboard component, signal generation process, alert framework, user interface, configurable setting, optimization method, and overall analytical workflow has been independently designed, programmed, tested, and refined specifically for this project.
While the indicator incorporates widely recognized technical analysis concepts such as Exponential Moving Averages (EMA), trend alignment, momentum evaluation, volatility analysis, multi-timeframe confirmation, crossover detection, statistical weighting, and trend-strength assessment, the complete implementation represents an independent and original development by Forex_Market_Insights. The architecture, calculation sequence, feature integration, dashboard design, signal logic, scoring framework, filtering methods, and visual presentation are unique to this indicator.
No proprietary source code, copyrighted implementation, protected trading system, premium indicator, private algorithm, confidential software, or restricted intellectual property belonging to any third party has been copied, reverse-engineered, redistributed, or incorporated into the development of this project. All calculations have been independently programmed in Pine Script using publicly known market principles combined with original analytical techniques and custom software engineering.
This publication has been created solely for educational, analytical, and research purposes. It should not be interpreted as financial advice, investment guidance, portfolio management, or a guarantee of profitable trading results. Trading and investing involve substantial financial risk, and users are responsible for conducting their own market analysis and applying appropriate risk management before making any trading decisions.
By publishing this script, Forex_Market_Insights confirms that Quantum Trend Matrix Pro AI represents an independently developed software project produced through original research, independent programming, extensive testing, continuous optimization, and ongoing refinement. To the best of the author's knowledge, this publication complies with TradingView's Script Publishing Rules and House Rules regarding originality, independent development, and responsible script publication. Wskaźnik

Wskaźnik

Strong ETF Screener | ProjectSyndicateStrong ETF Screener turns dozens of charts into a single institutional-style dashboard, ranking a curated universe of the 40 largest US-listed ETFs by performance across six timeframes and scoring each one on professional-grade risk metrics — Beta, Sharpe, Sortino, Omega, Z-Score, and Kelly — so you can find the market's leaders and weigh their risk-adjusted quality at a glance, all on one clean, sortable panel. Every figure is computed live on the daily timeframe from real price history, not hard-coded, so the board reflects the market as it actually is right now.
📊 Curated Top-40-by-AUM Universe — the screener watches the 40 biggest US-listed ETFs by assets under management in one place: broad-market and S&P 500 cores (VOO, SPY, IVV, VTI), growth and tech (QQQ, VUG, VGT, XLK, SMH), international and emerging markets (VEA, IEFA, VXUS, VWO, IEMG), bonds (BND, AGG, TLT, BNDX, VCIT), factor and income (SCHD, VYM, VIG, QUAL, JEPI, RSP), and alternatives like gold (GLD) and spot Bitcoin (IBIT). Instead of flipping through forty charts, you see every fund's performance and risk profile side by side and immediately spot which sleeve of the market is leading and which is rolling over.
🗓️ Six-Timeframe Performance — each ETF is tracked across Week, Month, Quarter, 6-Month, 12-Month, and Year-to-Date returns, so you can separate a one-week move from a genuine long-run trend and see momentum building or fading across horizons in a single row.
🧮 Institutional Risk Metrics, Done Properly — beyond raw returns, every fund is scored on Sharpe (excess return per unit of total volatility), Sortino (return per unit of downside risk only), Omega (probability-weighted gains versus losses above the risk-free threshold), Z-Score (how stretched the recent move is in standard deviations), and the Kelly fraction (a theoretical optimal-sizing read from return and variance). The stats are annualized from daily returns over a rolling one-year window with a configurable risk-free rate, so the risk picture is consistent and comparable across the whole list — letting you line a high-flying tech fund up against a steady bond ETF on the same footing.
🎯 Basket-Relative Beta — Beta is measured against an equal-weight basket of the 40 ETFs in the screener, so it tells you how a fund moves relative to this specific top-40 cohort rather than a single broad index. Beta above 1 swings harder than the group; below 1 is steadier — an instant read on which names amplify the market and which cushion it. You control the lookback length used for the beta and correlation calculation.
🌡️ Annualized Weekly Volatility — a dedicated Wk Vol column annualizes the standard deviation of recent weekly returns, giving you a fast read on how violent each fund's price action is before you size into it — so a leveraged-feeling growth or crypto ETF never gets mistaken for a sleepy aggregate-bond fund.
🔀 Dynamic Sorting — sort the entire board by any of the six performance columns, or by static AUM rank, with a single setting. Rank by YTD to find the year's leaders, by Week to catch what is moving on fresh flows, or by any horizon in between — the table re-ranks instantly.
🎨 Bloomberg-Amber Theme with Color-Coded Strength — a clean amber-on-black dashboard with a multi-level gradient that runs from bright amber on the strongest gains through to deep red on the steepest losses, so strength and weakness jump out the moment you look at the panel.
🧩 Fully Customizable Dashboard — place the table anywhere on the chart (Top / Middle / Bottom paired with Left / Center / Right), choose your text size (Tiny / Small / Normal / Large), set the sort column, the beta length, and the risk-free rate and periods — all from the settings menu, no code editing required. The 40-ticker list is a single, clearly labeled block in the source, so refreshing the universe as AUM rankings shift is a quick edit.
🔒 Daily-Timeframe Lock — the screener is built for daily data and will prompt you to switch if you load it on a lower timeframe, so the returns, volatility, and ratios are always calculated on the basis they are designed for.
⚡ Lightweight and Efficient — the whole 40-name board is built from a tight, well-organized script that runs smoothly on TradingView, with a clean merged title heading and an alternating-row layout for easy reading. Delisted or halted tickers degrade gracefully to blank rows rather than breaking the panel.
🎯 Why this is different — most watchlists show you price and maybe a percentage move. This screener puts performance and a full institutional risk stack — Sharpe, Sortino, Omega, Z-Score, Kelly, Beta, and annualized volatility — for the forty largest ETFs on one sortable, color-coded panel, so you are ranking opportunities by risk-adjusted quality, not just chasing the biggest green number.
🚀 Where to use it — apply it to any daily chart to monitor the ETF leadership landscape as a whole. Use it for top-down asset-allocation and rotation ideas, cross-sleeve comparison (equity vs bond vs commodity vs crypto), and risk screening before you drill into an individual fund's chart for entry timing.
⚠️ Important — this is a research and decision-support dashboard, not a buy/sell system, and it makes no performance guarantees. The 40-name universe is a snapshot of the current largest ETFs by AUM and will drift over time; the board re-ranks live, but membership is fixed until you update the ticker list. All figures are historical and descriptive, computed from past price data, and say nothing certain about the future. Risk metrics like Sharpe, Sortino, Omega, Z-Score, and Kelly are simplified, assumption-based estimates and should inform your judgment, not replace it. Always pair the screener with your own analysis and risk management. Wskaźnik

Session Intelligence Matrix ProSession Intelligence Matrix Pro
Session Intelligence Matrix Pro is a professional institutional-style session analytics indicator designed to reveal what each major Forex trading session historically contributes to the market. Instead of simply highlighting trading sessions with colored boxes, this indicator performs statistical analysis on hundreds of previous sessions and displays the probability, behavior, volatility, and smart-money characteristics of every session in one professional dashboard.
The primary objective of this indicator is to help traders understand which session is statistically strongest, which session usually creates the daily high or low, where volatility is most likely to appear, and when institutional activity is historically at its highest.
Whether you trade Forex, Gold, Indices, Crypto, or CFDs, Session Intelligence Matrix Pro allows you to make decisions based on historical session behavior rather than assumptions.
Why This Indicator Was Created
Most traders know the names of the major trading sessions:
Asia
London
New York AM
New York Lunch
New York PM
However, very few traders actually know:
Which session usually creates the largest move?
Which session most often sets the High of the Day?
Which session usually creates the Low of the Day?
Which session generates the largest Fair Value Gaps?
Which session contributes the highest percentage of daily volume?
Which session normally produces continuation after the previous session?
These statistics are extremely valuable for intraday traders, yet TradingView does not provide them.
Session Intelligence Matrix Pro was developed to solve this problem by collecting historical session statistics and presenting them in an easy-to-read institutional dashboard.
How the Indicator Works
The indicator automatically separates each trading day into five major sessions:
Asia Session
London Session
New York AM
New York Lunch
New York PM
For every completed session, it records important market information including:
Price range
ATR percentage
Candle size
Volume contribution
Bullish or bearish close
Highest price of the day
Lowest price of the day
Fair Value Gap creation
Session percentile
Over time, these records build a statistical database that is used to calculate historical averages and probabilities.
The dashboard is continuously updated as new market data becomes available.
Dashboard Metrics Explained
Average Range
Shows the average number of price points traveled during each session.
This helps identify which sessions normally produce the biggest market movement.
Large average range generally means:
Better trading opportunities
Higher volatility
Larger profit potential
Average ATR %
Displays how large each session is relative to the Daily ATR.
Instead of showing raw price movement, this metric compares every session against the market's normal daily volatility.
Higher values indicate stronger expansion.
Volume Share %
Shows how much of the entire day's trading volume is generated during each session.
This quickly reveals where institutional participation is strongest.
Average Candle Size
Calculates the average size of candles printed during every session.
Larger candles usually indicate:
Strong momentum
Institutional participation
Aggressive buying or selling
Highest Range
Displays the largest range ever recorded for that session within the available historical dataset.
Useful for understanding maximum expansion potential.
Lowest Range
Displays the smallest recorded range for every session.
This helps traders recognize when markets are historically quiet.
Bullish Session %
Shows how often each session closes bullish.
Example:
London Bullish Session = 54%
This means London has historically closed bullish approximately 54% of the recorded sessions.
High Of Day %
One of the most useful statistics.
Shows how frequently a session creates the day's highest price.
For example:
NY PM = 72%
This means that historically, the New York PM session has produced the High of the Day in 72% of the analyzed periods.
Low Of Day %
Shows how often each session creates the day's lowest price.
This helps traders anticipate where reversals or trend completions are most likely to occur.
Average FVG Count
Counts the average number of Fair Value Gaps created during every session.
Higher values indicate more institutional imbalance and stronger Smart Money activity.
Live Percentile
This feature compares the current session against historical data.
For example:
Live Percentile = 75%
This means the current session is already larger than 75% of previous sessions.
This allows traders to instantly understand whether today's market is:
Normal
Weak
Exceptionally volatile
Session Visualization
The indicator also draws colored session boxes directly on the chart.
Each box clearly highlights:
Session start
Session end
Session range
Session identification
This allows traders to quickly recognize where important moves occurred during the trading day.
Designed For
Session Intelligence Matrix Pro can be used on:
Forex
Gold (XAU/USD)
Silver
Crypto
Indices
CFDs
Futures
It is especially valuable for:
Intraday Traders
Scalpers
Smart Money Traders
ICT Traders
Session-Based Traders
Price Action Traders
Institutional Strategy Traders
Key Benefits
Automatically analyzes every major trading session.
Tracks historical session performance.
Displays institutional-quality statistics in a professional dashboard.
Identifies where volatility is historically concentrated.
Shows which session most frequently creates the High and Low of the Day.
Measures average volatility and ATR expansion.
Calculates volume contribution for each session.
Tracks Fair Value Gap frequency.
Displays live session percentile against historical data.
Helps traders trade with statistical confidence instead of emotion.
Disclaimer
This indicator is designed as a market analysis and statistical decision-support tool. Historical probabilities do not guarantee future market performance. Traders should always combine session statistics with proper market structure analysis, confirmation, and sound risk management before entering any trade.
Verification
Verified Original Script
Developed, programmed, and independently published by Forex_Market_Insights
This script represents original work created specifically for this TradingView publication and is not intended to copy or reproduce another author's proprietary implementation.
Clarification
Forex_Market_Insights is the original creator and developer of the concepts, analytical methodology, and overall trading framework reflected in this indicator.
This publication has been created with full acknowledgment of the original research and development behind the project. The verification reference to Forex_Market_Insights is included solely to recognize the origin of the analytical concepts and development process associated with this work.
The inclusion of Forex_Market_Insights in the verification section is intended as proper attribution and acknowledgment of the original creator's contribution to the methodology presented in this indicator. Wskaźnik

Live Market Probability Matrix ProLive Market Probability Matrix Pro
Live Market Probability Matrix Pro is an advanced Pine Script® v6 indicator developed to provide a real-time probability-based view of market strength, momentum, trend direction, and overall buying versus selling pressure in a single visual dashboard.
Unlike traditional indicators that rely on only one calculation such as RSI, MACD, or Moving Averages, this indicator combines multiple market components into a unified probability engine that continuously evaluates live market conditions and displays them in an easy-to-read visual format.
The purpose of this indicator is to simplify market analysis by converting complex market data into a dynamic probability system that helps traders understand which side of the market currently has stronger control, how confident that control is, and whether the existing trend has enough strength to continue or weaken.
This indicator was designed for traders who prefer visual market analysis instead of interpreting multiple separate indicators.
Why This Indicator Was Created?
Most trading indicators only measure one aspect of the market.
For example:
• RSI measures momentum.
• ATR measures volatility.
• Volume measures participation.
• Moving averages measure trend.
• Structure analysis measures swing direction.
However, professional traders rarely make decisions based on only one indicator.
The market is driven by multiple factors simultaneously.
This indicator was created to combine several important market components into one intelligent probability model that continuously updates as new candles are formed.
Instead of forcing traders to switch between several indicators, all important information is displayed in one organized interface.
Live Market Probability Engine
The core of this indicator is its probability engine.
Every incoming candle updates multiple internal calculations including trend strength, momentum, volatility, structure, candle behavior, relative volume, and directional pressure.
These values are blended together to estimate which side currently has greater probability of controlling price.
Rather than giving random Buy or Sell labels, the indicator continuously measures changing market conditions.
As market conditions improve for buyers, bullish probability increases.
As selling pressure strengthens, bearish probability increases.
The calculations update automatically with every new candle.
Dynamic Bullish & Bearish Probability Circles
One of the most distinctive features of this indicator is the pair of dynamic circular probability diagrams displayed near the end of the chart.
These circles visually represent:
• Bullish Strength
• Bearish Strength
Their size changes dynamically according to the calculated probabilities.
When bullish pressure dominates, the bullish circle becomes larger while the bearish circle contracts.
When sellers gain control, the bearish circle expands while the bullish circle becomes smaller.
Above each circle, the current live probability percentage is displayed, allowing traders to quickly identify the dominant market side without reading numerical data.
This creates an intuitive visual representation of market sentiment.
Dynamic Buy & Sell Strength Bars
Below the circular probability diagrams, the indicator displays two vertical strength bars.
These bars represent:
• Buy Strength
• Sell Strength
The height of each bar changes continuously based on the current market probability.
Higher bars indicate stronger participation from that side of the market.
Lower bars indicate weakening pressure.
Because the bars update in real time, traders can instantly see whether buying or selling momentum is increasing or fading.
Live Probability Dashboard
A fully integrated dashboard is displayed in the corner of the chart.
The dashboard provides continuously updated information including:
• Overall Probability
• Bull Strength
• Bear Strength
• Trend Score
• Momentum Score
• Volatility Score
• Volume Score
• Structure Score
• Candle Score
• Moving Average Score
• Market State
• Current Trend
• Current Bias
• Overall Signal
• Buy Probability
• Sell Probability
• ATR
• Volume Status
Every value is recalculated automatically as new market data becomes available.
This gives traders a complete snapshot of current market conditions without needing multiple separate indicators.
Trend Analysis
The indicator continuously analyzes market direction.
Instead of only identifying whether price is moving higher or lower, it also evaluates the quality of the trend.
Factors such as higher highs, lower lows, directional consistency, and price progression contribute to the trend score.
A stronger trend produces higher confidence within the probability engine.
Weak or sideways markets naturally reduce overall confidence.
Momentum Evaluation
Momentum measures the speed and strength of price movement.
Rapid directional movement increases momentum scores.
Slowing momentum gradually reduces bullish or bearish confidence.
This helps traders distinguish between healthy trends and exhausted moves.
Volatility Measurement
Volatility is monitored continuously.
Periods of expanding volatility often indicate increasing participation and stronger price movement.
Low volatility environments generally produce lower conviction because price lacks directional energy.
The volatility score contributes to the overall probability calculation.
Volume Analysis
The indicator also evaluates relative trading volume.
Higher participation generally strengthens confidence in directional movement.
Lower participation reduces confidence because fewer market participants are supporting the move.
The volume score helps improve the overall quality of the probability model.
Market Structure Analysis
Price structure remains one of the most important components of technical analysis.
The indicator evaluates recent swing highs, swing lows, trend progression, and structural consistency.
Healthy bullish structure increases bullish confidence.
Healthy bearish structure increases bearish confidence.
Structural weakness reduces probability.
Candle Strength Analysis
Individual candle characteristics are also evaluated.
The indicator analyzes factors such as:
• Candle body size
• Wick proportion
• Closing strength
• Directional conviction
Stronger candles contribute more positively to probability calculations than weak or indecisive candles.
Overall Market State
After combining all internal calculations, the indicator determines the current market condition.
Possible conditions may include:
Trending
Ranging
Neutral
Transition
These classifications help traders understand the broader context before making trading decisions.
Overall Signal
The Overall Signal summarizes the combined output of all analytical components.
Depending on market conditions, it may indicate:
Bullish
Bearish
Neutral
Since this result is generated using multiple independent calculations rather than a single indicator, it provides a broader view of current market sentiment.
Works on All Markets
The indicator is designed to work across all TradingView-supported markets, including:
• Forex
• Gold
• Silver
• Cryptocurrency
• Indices
• Commodities
• Futures
• CFDs
Because the calculations are based on price behavior and market activity, the indicator can adapt to different asset classes.
Compatible with All Timeframes
The indicator functions across all TradingView timeframes.
Examples include:
• 1 Minute
• 3 Minutes
• 5 Minutes
• 15 Minutes
• 30 Minutes
• 1 Hour
• 4 Hour
• Daily
• Weekly
Lower timeframes provide faster updates for intraday trading, while higher timeframes offer a broader view of market conditions.
Typical Workflow
A common way to use this indicator is:
Observe the Bullish and Bearish probability circles.
Compare Buy and Sell strength bars.
Review the dashboard scores.
Identify the current market state.
Confirm whether multiple components align in the same direction.
Combine the information with your own trading strategy, market structure analysis, and risk management before making any trading decisions.
Key Features
✔ Live probability engine
✔ Dynamic Bullish probability visualization
✔ Dynamic Bearish probability visualization
✔ Real-time percentage calculations
✔ Adaptive probability circles
✔ Dynamic Buy & Sell strength bars
✔ Live market dashboard
✔ Trend analysis
✔ Momentum analysis
✔ Volatility analysis
✔ Relative volume evaluation
✔ Market structure analysis
✔ Candle strength scoring
✔ Market state classification
✔ Overall probability calculation
✔ Supports all TradingView markets
✔ Compatible with all timeframes
✔ Lightweight visual interface
Important Note
This indicator is designed as a probability-based market analysis and visualization tool. It does not predict future price movements, guarantee profitable trades, or provide financial advice. The displayed probabilities represent analytical estimates derived from multiple technical components and are intended to help traders better understand current market conditions. For best results, this indicator should be used alongside your own technical analysis, trading plan, and disciplined risk management.
Originality & Author Verification
Live Market Probability Matrix Pro is an original Pine Script® v6 indicator independently designed, developed, and authored by Forex_Market_Insights. The concept, probability model, dashboard design, visualization system, scoring methodology, and implementation are based on the author's own research and development. No proprietary or copyrighted code has been copied or reused from third-party scripts. This publication is intended to comply with TradingView House Rules by accurately describing the indicator's functionality and acknowledging its original authorship. Wskaźnik

Liquidity Sweep Detector ProLiquidity Sweep Detector Pro with Smart Trade Setups
Overview
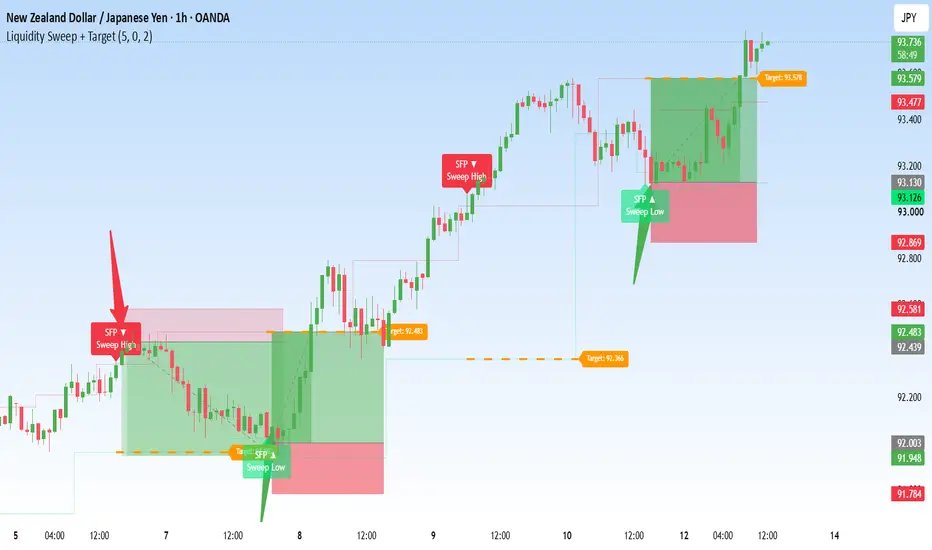
Liquidity Sweep Detector Pro with Smart Trade Setups is an advanced Pine Script® v6 indicator designed to identify one of the most important institutional price action concepts in modern financial markets: Liquidity Sweeps.
Instead of relying on traditional indicators that simply react to price movement, this indicator focuses on how liquidity is collected around swing highs and swing lows, how false breakouts occur, and where institutions may trigger stop-loss orders before reversing price.
The indicator automatically detects Buy-Side Liquidity, Sell-Side Liquidity, confirmed liquidity sweeps, and then generates a structured trade setup complete with Entry, Stop Loss, and Take Profit zones. Every sweep is evaluated using a proprietary scoring system that combines multiple market factors into a single confidence score.
The purpose of this indicator is not to predict the future, but to organize liquidity-based market behavior into a clear visual framework that helps traders identify high-quality reversal opportunities and potential institutional activity.
---
Why This Indicator Was Created
Most liquidity indicators only highlight swing highs and swing lows or draw simple liquidity lines. They often leave traders with the difficult task of manually deciding whether a sweep is genuine, whether the rejection is strong enough, and where a logical trade setup should be placed.
Liquidity Sweep Detector Pro was created to automate this entire workflow.
Instead of requiring multiple indicators, it combines liquidity detection, sweep confirmation, scoring, trend filtering, session filtering, dynamic trade setup generation, and live market statistics into a single comprehensive tool.
The objective is to simplify institutional liquidity analysis while keeping the chart clean, organized, and easy to interpret.
---
How the Indicator Works
The indicator continuously scans the chart for confirmed swing highs and swing lows.
These swing points become potential liquidity pools where market participants commonly place stop-loss orders.
Once a sufficient number of highs or lows cluster together, the indicator identifies them as:
• Buy-Side Liquidity
• Sell-Side Liquidity
These liquidity areas remain active until price interacts with them.
When price temporarily moves beyond one of these liquidity pools but quickly closes back inside the previous range, the indicator identifies this behavior as a Liquidity Sweep rather than a genuine breakout.
After confirmation, the sweep is analyzed using multiple filters before being displayed on the chart.
---
Buy-Side & Sell-Side Liquidity Detection
The indicator automatically marks important liquidity locations throughout the market.
Buy-Side Liquidity
Buy-Side Liquidity represents areas above previous highs where stop-loss orders from short positions and breakout buy orders commonly accumulate.
When price briefly trades above these highs but immediately returns back below them, the indicator identifies a Bearish Liquidity Sweep.
The chart labels these levels as:
Buy Side Liq
---
Sell-Side Liquidity
Sell-Side Liquidity represents areas below previous lows where stop-loss orders from long positions are typically concentrated.
When price temporarily trades below these lows before rapidly reversing back upward, the indicator identifies a Bullish Liquidity Sweep.
The chart labels these levels as:
Sell Side Liq
---
Liquidity Sweep Confirmation
A sweep is not confirmed simply because price trades beyond a previous high or low.
Several confirmation filters are applied before the signal becomes valid.
These include:
• ATR displacement confirmation
• Relative volume confirmation
• Market structure validation
• Candle rejection strength
• Liquidity cluster quality
• Session filtering
• Trend filtering (optional)
Only when these conditions align does the indicator generate a confirmed liquidity sweep.
This helps reduce false signals while focusing on stronger market reactions.
---
Smart Strength Score
Every detected sweep receives a proprietary Strength Score ranging from 0 to 100.
The score is calculated using multiple components including:
• Liquidity quality
• Number of liquidity touches
• ATR displacement
• Relative volume
• Rejection candle strength
• Market structure
• Age of the liquidity level
Higher scores indicate stronger technical confirmation.
The indicator also displays a star rating to provide an instant visual assessment of signal quality.
Example:
★★★★★ Elite
★★★★ Strong
★★★ Good
★★ Moderate
★ Weak
This allows traders to prioritize higher-confidence setups.
---
Automatic LONG & SHORT Trade Setups
One of the most unique features of this indicator is its ability to automatically generate a complete trade setup immediately after a confirmed liquidity sweep.
After a Bullish Liquidity Sweep
When the indicator detects that Sell-Side Liquidity has been swept, it automatically builds a LONG setup.
The setup includes:
• Entry Zone
• Stop Loss Zone
• Target Zone
• Risk-to-Reward calculation
---
After a Bearish Liquidity Sweep
When the indicator detects that Buy-Side Liquidity has been swept, it automatically builds a SHORT setup.
The setup includes:
• Entry Zone
• Stop Loss Zone
• Target Zone
• Risk-to-Reward calculation
This provides traders with a structured trade framework instead of only highlighting the sweep itself.
---
Automatic Risk Management Visualization
Each generated setup includes clearly displayed trading zones.
The indicator automatically draws:
• Green Target Zone
• Red Stop Loss Zone
• Entry Price
• Stop Loss Price
• Target Price
These zones remain visible on the chart, allowing traders to easily evaluate the trade structure and monitor price progression after the sweep.
---
Liquidity Zones
Following each confirmed sweep, the indicator creates a liquidity reaction zone.
These zones represent the area where institutional rejection occurred.
Users can configure how these zones behave after price revisits them.
Available options include:
• Extend
• Fade
• Delete
This provides flexibility depending on individual trading preferences.
---
Trend Filter
An optional trend filter helps align liquidity sweeps with the broader market direction.
Supported filters include:
• EMA 50
• EMA 200
• EMA 50 + EMA 200
When enabled, the indicator prioritizes sweeps that occur in alignment with the selected trend.
---
Session Filter
The indicator can restrict sweep detection to specific Forex trading sessions.
Supported sessions include:
• Sydney
• Tokyo
• London
• New York
Users can analyze liquidity behavior only during preferred institutional trading hours.
---
Dashboard
A real-time dashboard summarizes important market statistics, including:
• Bullish Sweeps Today
• Bearish Sweeps Today
• Strong Sweeps
• Weak Sweeps
• Average Strength Score
• Highest Score
• Current Market Trend
• Active Trading Session
This allows traders to quickly evaluate current market conditions without manually reviewing the entire chart.
---
Alerts
The indicator includes alert conditions for:
• Bullish Liquidity Sweep
• Bearish Liquidity Sweep
• Strong Sweep
• Elite Sweep
• Liquidity Zone Filled
• LONG Setup Created
• SHORT Setup Created
• Target Hit
• Stop Loss Hit
These alerts allow traders to monitor liquidity events without continuously watching the chart.
---
Works on Any Market
Although designed primarily for institutional Forex trading, the indicator also performs effectively on:
• Forex
• Gold
• Silver
• Indices
• Futures
• Commodities
• Cryptocurrency
• CFDs
• Stocks
Because liquidity exists in every actively traded market, the underlying methodology remains applicable across multiple asset classes.
---
Works on Any Timeframe
The indicator automatically adapts to every TradingView timeframe, including:
• 1 Minute
• 3 Minute
• 5 Minute
• 15 Minute
• 30 Minute
• 1 Hour
• 4 Hour
• Daily
• Weekly
Lower timeframes are generally more suitable for scalping and intraday liquidity analysis, while higher timeframes provide broader institutional market context.
---
Typical Trading Workflow
A common workflow using this indicator is:
1. Allow the indicator to identify Buy-Side and Sell-Side Liquidity.
2. Wait for a confirmed liquidity sweep.
3. Review the Strength Score and star rating.
4. Confirm the setup using your preferred market analysis.
5. Use the automatically generated LONG or SHORT setup as a structured trading framework.
6. Monitor the trade using the predefined Entry, Stop Loss, and Target zones.
7. Manage risk according to your personal trading plan.
---
Key Features
✔ Automatic Buy-Side Liquidity Detection
✔ Automatic Sell-Side Liquidity Detection
✔ Liquidity Sweep Confirmation
✔ Proprietary Strength Score (0–100)
✔ ATR Confirmation
✔ Relative Volume Confirmation
✔ Market Structure Confirmation
✔ Session Filter
✔ Trend Filter
✔ Automatic LONG Setup Generation
✔ Automatic SHORT Setup Generation
✔ Entry, Stop Loss & Target Visualization
✔ Dynamic Liquidity Zones
✔ Real-Time Dashboard
✔ Custom Alerts
✔ Fully Customizable Inputs
✔ Supports All Markets
✔ Compatible with All Timeframes
✔ Clean Institutional Chart Visualization
---
Important Note
This indicator is designed as a liquidity and market structure analysis tool. It does not guarantee profitable trades, predict future market direction, or provide financial advice. All automatically generated trade setups are based on predefined liquidity sweep conditions and should be used alongside your own technical analysis, market context, and disciplined risk management.
---
Originality & Author Verification
Liquidity Sweep Detector Pro with Smart Trade Setups is an original Pine Script® v6 implementation independently researched, designed, and developed by Forex_Market_Insights.
The complete concept, indicator architecture, liquidity workflow, visualization, scoring methodology, trade setup generation, dashboard design, user interface, confirmation logic, and overall implementation were created specifically for this project from first principles.
This script is not a clone, copy, conversion, or modification of any existing TradingView publication. While concepts such as liquidity, swing highs/lows, ATR, volume, market structure, and price action are widely known within technical analysis, the way they are combined, processed, scored, and presented in this indicator represents an original implementation developed by the author.
Author: Forex_Market_Insights
Pine Script® Version: v6
Implementation: Original
Concept & Design: Original
Algorithm: Original
Visualization: Original
Trading Workflow: Original
Developed by: Forex_Market_Insights Wskaźnik

Market Session Matrix ProForex Session Matrix Pro with Volume
Overview
Forex Session Matrix Pro with Volume is an original Pine Script® v6 indicator designed to provide a structured view of the four major Forex trading sessions directly on the chart. Instead of displaying only session timings, this indicator combines session visualization, dynamic session range tracking, session high/low identification, and directional volume analysis into a single workspace.
The primary objective of this indicator is to help traders understand when institutional liquidity enters the market, how price behaves during each session, where important highs and lows are created, and which side (buyers or sellers) dominated the session.
This implementation was independently designed and developed by Forex_Market_Insights and is intended to improve market structure analysis without relying on external libraries or copied logic.
Why This Indicator Was Created
Most session indicators simply draw colored rectangles on the chart. While they identify session timing, they provide very little information about what actually happened during that trading session.
This indicator extends traditional session visualization by combining several analytical components:
Individual session boxes
Automatic session labels
Session High and Low tracking
Independent color customization
Fully editable session timings
Buyer vs Seller Volume histogram beneath every session
Overlap support
Clean visualization suitable for all markets and all timeframes
The goal is not only to show when a session occurred, but also how that session behaved.
Major Forex Sessions
The indicator supports the four primary Forex trading sessions:
• Sydney Session
• Tokyo Session
• London Session
• New York Session
Each session is displayed using its own independent colored box, making it easy to distinguish institutional trading periods throughout the trading day.
Every session's start time and end time are fully customizable from the indicator settings.
Session Boxes
As each trading session begins, the indicator automatically creates a colored session box.
The box expands dynamically while the session is active.
During the session it continuously updates:
Highest price reached
Lowest price reached
Session boundaries
Once the session ends, the completed box remains visible for historical reference.
This allows traders to quickly compare volatility between different sessions.
Automatic Session Labels
Every session box automatically displays its name at the top.
Examples include:
Sydney
Tokyo
London
New York
These labels remain attached to the corresponding session, making historical analysis much easier without needing to remember trading hours.
Session High and Low Tracking
Every session continuously records:
Session High
Session Low
These price levels are marked directly on the session box.
Many institutional traders monitor previous session highs and lows because they often become:
Liquidity pools
Breakout levels
Reversal zones
Stop hunt locations
Trend continuation points
Having these levels displayed automatically eliminates the need for manual marking.
Buyer vs Seller Volume Analysis
One of the unique features of this indicator is the session volume visualization shown beneath the price chart.
Instead of displaying standard exchange volume, the indicator separates session activity into bullish and bearish participation.
Green bars represent buying pressure.
Red bars represent selling pressure.
This allows traders to quickly evaluate which side controlled the session.
For example:
A session with mostly green volume bars suggests buyers dominated trading activity.
A session with mostly red volume bars indicates sellers controlled the market.
Although Forex is a decentralized market and TradingView volume represents broker feed activity rather than centralized exchange volume, relative volume still provides valuable information regarding market participation and directional strength.
Why Volume Is Displayed Below Each Session
Volume alone does not indicate direction.
Price alone does not indicate participation.
By combining both, traders can better understand the quality of a market move.
Examples:
Strong bullish movement with strong buying volume often indicates healthy participation.
Strong bullish movement with weak volume may indicate reduced conviction.
Strong bearish movement supported by increasing seller volume often suggests stronger downside momentum.
This additional layer of confirmation helps traders judge whether a move is supported by market activity.
Customizable Session Times
Different brokers use different server times.
To solve this issue, every session timing can be modified from the settings.
Users may customize:
Sydney Start
Sydney End
Tokyo Start
Tokyo End
London Start
London End
New York Start
New York End
This makes the indicator compatible with virtually any TradingView chart regardless of broker timezone.
Customizable Colors
Every session uses its own independent color.
Users can customize:
Session box color
Border color
Transparency
Text color
This makes the indicator suitable for both light and dark TradingView themes.
Session Overlap Analysis
The indicator naturally displays overlapping trading sessions when customized timings intersect.
This is particularly useful because market volatility frequently increases during major session overlaps.
Examples include:
London–New York Overlap
Sydney–Tokyo Overlap
These periods often experience increased liquidity and stronger market movements.
Works on Any Market
Although designed primarily for Forex, the indicator also works effectively on:
Gold
Silver
Indices
CFDs
Cryptocurrency
Commodities
Futures
Any TradingView symbol
Since sessions are time-based rather than symbol-specific, the logic remains applicable across multiple markets.
Works on Any Timeframe
The indicator automatically adapts to every TradingView timeframe.
Examples include:
1 Minute
3 Minutes
5 Minutes
15 Minutes
30 Minutes
1 Hour
4 Hour
Daily
Lower timeframes provide more detailed session development, while higher timeframes offer a broader institutional perspective.
Typical Trading Workflow
A common way to use this indicator is:
Observe which session is currently active.
Monitor how price behaves inside that session.
Watch where the session creates its High and Low.
Compare buyer and seller volume beneath the session.
Evaluate whether price is accepting or rejecting important session levels.
Use this information alongside your existing trading strategy for additional market context.
Key Features
✔ Automatic Forex session detection
✔ Independent session boxes
✔ Automatic session labels
✔ Session High tracking
✔ Session Low tracking
✔ Buyer vs Seller volume visualization
✔ Fully customizable session timings
✔ Custom colors
✔ Historical session visualization
✔ Supports all TradingView markets
✔ Compatible with all timeframes
✔ Clean and lightweight chart display
Important Note
This indicator is intended as a market structure and session analysis tool. It does not generate buy or sell signals, predict future price direction, or provide financial advice. Instead, it organizes session-based price action and relative buying/selling activity into a clear visual framework that traders can combine with their own analysis, risk management, and trading methodology. This description accurately reflects the indicator's functionality and aligns with TradingView's expectation that script descriptions explain what the script does, how it works, and how it should be used.
Originality & Authorship
This indicator was independently designed and developed by Forex_Market_Insights.
The overall concept, implementation, visualization, session management logic, volume presentation, configurable settings, user interface, and workflow were created specifically for this project. The script represents an original implementation written in Pine Script® v6 and was developed to provide traders with a practical session-based market analysis tool.
This publication is not a copy, clone, or re-upload of another TradingView script. It was created from the ground up using the author's own design approach and programming implementation. Any standard market concepts referenced in this indicator—such as Forex trading sessions, session highs/lows, and volume analysis—are widely recognized trading concepts, while the software implementation, visualization, and integration presented here are original to this script.
Author: Forex_Market_Insights
Thank you for using this indicator. I hope it helps make session analysis clearer, more organized, and easier to interpret within your own trading workflow. Wskaźnik

Drawdown [WynTrader]Drawdown
Hello my friend
Before trading an unfamiliar asset, it's worth seeing how it survived its toughest moments — including major market crashes. This indicator reveals every significant decline a security has experienced: how far it dropped, and how long it took. Seeing a past drawdown of -54% over 13 months makes the next correction far less intimidating.
Use it to measure real risk, set realistic expectations, and trade with more confidence.
█ CONCEPTS
A drawdown is the decline from a price peak to the lowest point that follows. The indicator automatically detects every peak and trough, filtering out noise to keep only declines at or above your chosen threshold (default: 20%).
█ FEATURES
Threshold — Set the minimum decline to display, so only meaningful crashes appear.
Boxes & Labels — Each drawdown is highlighted on the chart from peak to trough, labeled with its duration and amplitude (e.g., 13M -54%).
History Table — Lists every recorded drawdown with start/end dates, span, and decline %. Sortable and adjustable in size.
█ CONCLUSION
Before investing, check an asset's drawdown history: how deep, how long, did it recover? These questions reveal its true volatility and resilience. A chart without this history tells only half the story.
█ WYNTRADER
I'm not a Pine Script programmer — just a trader building tools for my own analysis. A few rough edges may remain. Enjoy!
WynTrader Wskaźnik

Momentum Pulse SignalsMomentum Pulse Signals
This indicator generates Buy/Sell badges from a simple momentum score (the "pulse"), then automatically manages an ATR-based stop loss and a risk:reward-based take profit for each signal, showing the resulting entry/stop/target levels directly on the chart.
The pulse is just two common indicators added together. RSI is re-centred so 50 becomes 0 and the range becomes −1 to +1. The MACD histogram is divided by its own recent standard deviation and clipped to the same −1 to +1 range, so it scales itself to whatever the instrument's normal histogram size happens to be. The two are blended with an adjustable weight. When the blended value pushes past a positive trigger level the state flips bullish; when it pushes past the negative trigger level it flips bearish. A badge prints on the flip. That's the whole idea.
Key Features
Blended RSI + MACD-histogram score generates the base Buy/Sell signal, with an optional candle-confirmation requirement (close beyond open in the signal direction).
The MACD part is normalised by its own rolling standard deviation, so the same trigger level works across instruments without rescaling.
A trigger level with a dead zone around zero means the state only flips on a decisive move, not on every wiggle across zero.
Optional slope filter: the pulse must also be moving in the signal's direction over the last few bars.
Automatic ATR-based stop loss and configurable Risk:Reward take profit are calculated for every new signal, with intermediate take-profit levels plotted when Risk:Reward is greater than 1.
On-chart entry / stop-loss / take-profit lines and an SL distance (in points) label, both toggleable.
Take-profit, stop-loss, and "invalidated" (opposite signal fired before target/stop was hit) markers are plotted separately so you can see how each trade idea played out.
Optional baseline plot coloured by whether the pulse is positive or negative.
Real-price calculation via request.security() keeps signals consistent regardless of chart type (Heikin Ashi, Renko, etc.).
A full set of alertcondition() calls for Buy/Sell signals, take-profit hits, stop-loss hits, and invalidated entries.
How to Use
Start with the defaults. Raise the Pulse Trigger Level if you want fewer badges, lower it if you want more.
Shorten the Normalization Length to make the MACD side react faster, lengthen it to make it steadier.
Move the RSI Weight toward 1 to lean on RSI, toward 0 to lean on MACD.
Turn the slope filter off if you want signals the moment the level is crossed rather than waiting for agreement.
Watch the on-chart entry/SL/TP lines to track an open idea's risk and progress.
Set alerts on "Buy/Sell Signal", "Entry Signal", "Take Profit Hit", "Stop Loss Hit", or "Entry Invalidated" depending on which events you want. Wskaźnik

RSI Market Structure Zones ProPlease read how to use it. red before use.
RSI Momentum Zones Pro
Professional RSI Confirmation Indicator for Trend, Reversal & Scalping
Author: Forex_Market_Insights
Overview
RSI Momentum Zones Pro is a professional momentum analysis indicator developed to simplify RSI interpretation by dividing market momentum into four institutional trading zones instead of relying solely on the traditional overbought and oversold approach.
Rather than treating RSI as a simple oscillator, this indicator classifies momentum into Over Bought, Resistance, Support, and Over Sold regions to help traders understand where price is statistically more likely to continue, slow down, reject, or reverse after receiving price action confirmation.
The indicator is designed for discretionary traders who combine momentum analysis with candlestick confirmation instead of using RSI crossovers alone.
It is suitable for scalping, intraday trading, swing trading and multi-timeframe analysis.
Core Concept
Traditional RSI indicators only highlight the 70 and 30 levels, which often generate premature or unreliable signals during strong market trends.
This indicator expands RSI interpretation by introducing four structured momentum zones:
Over Bought (80)
Resistance (68)
Support (35)
Over Sold (20)
These additional zones allow traders to evaluate market strength in greater detail before making trading decisions.
Instead of assuming every overbought or oversold condition will immediately reverse, the indicator encourages confirmation through actual price behavior.
Indicator Structure
The RSI panel contains four clearly defined institutional-style levels:
OVER BOUGHT (80)
Represents an extreme bullish momentum zone.
Price entering this area suggests that buying pressure has become unusually strong.
This does not automatically indicate a sell signal.
Instead, traders should wait for bearish confirmation before considering a short position.
RESISTANCE (68)
Represents an upper momentum resistance area.
Momentum is considered strong, but not yet at an extreme.
This zone is useful for identifying potential exhaustion during bullish trends while still allowing trend continuation if buying pressure remains strong.
SUPPORT (35)
Represents a lower momentum support area.
Momentum has weakened but has not yet reached extreme bearish conditions.
This area frequently serves as an early accumulation zone where buyers may begin regaining control.
OVER SOLD (20)
Represents an extreme bearish momentum condition.
Selling pressure has reached unusually high levels.
Rather than immediately buying, traders should wait for bullish confirmation from price before entering a long position.
Dynamic RSI Visualization
The RSI line changes color according to momentum direction.
Green RSI Line
Indicates that RSI is rising and bullish momentum is strengthening.
Red RSI Line
Indicates that RSI is falling and bearish momentum is increasing.
This dynamic visualization allows traders to recognize momentum shifts without relying solely on numerical RSI values.
Trading Algorithm
The indicator does not generate trading signals simply because RSI reaches a certain level.
Instead, it follows a confirmation-based workflow.
Bullish Setup
A potential Buy opportunity is considered when:
RSI reaches the Support zone (35) or the Over Sold zone (20).
A strong bullish candle closes after momentum stabilizes.
Price confirms that buyers are beginning to regain control.
This confirmation-based approach helps reduce entries during ongoing bearish momentum.
Bearish Setup
A potential Sell opportunity is considered when:
RSI reaches the Resistance zone (68) or the Over Bought zone (80).
A strong bearish candle closes after bullish momentum weakens.
Price confirms increasing selling pressure.
This helps filter out false reversals during strong uptrends.
Momentum Confirmation Philosophy
One of the primary design goals of this indicator is to avoid trading solely based on RSI values.
Instead of assuming:
RSI reached 20 → Buy
or
RSI reached 80 → Sell
the indicator expects traders to combine RSI zones with actual market structure and candlestick confirmation.
This confirmation-first methodology is intended to reduce low-probability entries.
Hidden Momentum Concept
Momentum reversals do not always occur simultaneously on price and RSI.
Occasionally:
Price may create a new swing low while RSI does not.
RSI may create a new swing low while price remains relatively stable.
Likewise, the same behavior can occur near market highs.
These situations often indicate weakening momentum and can provide early evidence that trend strength is fading.
This indicator is designed to help traders visually identify these momentum shifts while combining them with price action confirmation before executing trades.
Multi-Timeframe Usage
Although the indicator performs well on lower timeframes such as the 1-minute chart, its underlying momentum framework is applicable across all TradingView-supported timeframes.
Many traders use:
1 Minute for scalping
5 Minute for intraday trading
15 Minute for short-term trend trading
Higher timeframes for broader market context
Using higher timeframe trend direction together with lower timeframe RSI confirmations may improve trade selection.
Practical Trading Workflow
A typical workflow may include:
Observe which RSI zone the market is approaching.
Wait for price action confirmation.
Confirm momentum direction using the RSI line color.
Enter only after the confirmation candle closes.
Manage risk using appropriate stop-loss placement and position sizing.
The indicator is intended to assist discretionary decision-making rather than automate entries.
Best Market Conditions
The indicator is particularly useful during:
Intraday trading
Scalping
Trending markets
Pullback trading
Momentum continuation setups
Reversal confirmation
Multi-timeframe analysis
Risk Notice
No technical indicator can predict future price movement with certainty.
RSI Momentum Zones Pro is designed as a decision-support tool and should be used alongside sound risk management, price action analysis, and overall market context.
It is not intended to be used as a standalone trading system, and traders should always confirm setups before entering positions.
Original Development
RSI Momentum Zones Pro has been independently designed and implemented by Forex_Market_Insights. The indicator combines structured RSI zoning, dynamic momentum visualization, and confirmation-based trading principles into a single workflow intended to improve momentum interpretation while remaining intuitive for discretionary traders. Wskaźnik

Fair Value Gap MarkerFair Value Gap Marker
Overview
Fair Value Gap Marker is a configurable market imbalance visualization tool designed to automatically detect, evaluate, and manage Fair Value Gaps (FVGs) using a three-candle price imbalance model. While the Fair Value Gap concept is widely recognized in technical analysis, this implementation expands the basic detection model by introducing adaptive volatility filtering, quantitative strength scoring, multi-timeframe analysis, and automated zone lifecycle management.
The objective of the indicator is not to display every possible imbalance, but to help traders focus on higher-quality Fair Value Gaps by filtering insignificant gaps and providing additional contextual information about each detected zone.
---
What is a Fair Value Gap?
A Fair Value Gap represents a temporary market inefficiency created when price moves aggressively enough that little or no trading occurs within a specific price range.
Such rapid displacement can leave an imbalance between buyers and sellers. Many traders monitor these areas because price may revisit them later before continuing its trend or establishing a reversal.
Rather than manually inspecting charts for these imbalances, Fair Value Gap Marker continuously scans completed candles and automatically identifies qualifying bullish and bearish Fair Value Gaps.
---
# Detection Algorithm
The indicator evaluates every completed three-candle sequence.
A Bullish Fair Value Gap is identified when the current candle's low remains above the high of the candle two bars earlier.
A Bearish Fair Value Gap is identified when the current candle's high remains below the low of the candle two bars earlier.
Only confirmed candle data is evaluated, ensuring that detected Fair Value Gaps remain stable once created.
---
# Adaptive Minimum Gap Filtering
Not every Fair Value Gap has equal analytical value.
Very small gaps frequently occur during normal market fluctuations and may simply represent insignificant price noise.
To reduce unnecessary chart clutter, this indicator offers two independent filtering methods.
### Percentage Filter
The minimum acceptable gap size can be defined as a percentage of the current market price.
Only Fair Value Gaps exceeding the specified percentage threshold are displayed.
This mode is useful for traders who prefer a fixed proportional filter across different assets.
---
### ATR Adaptive Filter
The second filtering method compares the gap size against the current Average True Range (ATR).
Instead of relying on a fixed gap width, every imbalance must exceed a configurable multiple of current market volatility.
Because ATR expands during volatile conditions and contracts during quieter markets, this approach automatically adapts the minimum acceptable Fair Value Gap size without requiring constant manual adjustment.
This helps maintain more consistent filtering across different symbols, sessions, and market environments.
---
# Fair Value Gap Strength Score
One of the primary enhancements introduced in this implementation is the Fair Value Gap Strength Score.
Rather than assuming all detected imbalances have equal significance, every Fair Value Gap is assigned a numerical score ranging from 0 to 100.
The score combines two independent measurements.
## 1. Gap Size Analysis
The script compares the width of the Fair Value Gap with the current ATR.
Larger displacement moves generally indicate stronger directional momentum and therefore contribute more heavily to the final score.
---
## 2. Relative Volume Analysis
The volume of the candle responsible for creating the Fair Value Gap is compared against its recent moving average.
Higher-than-average participation suggests stronger market commitment and increases the confidence score.
---
## Final Strength Score
The final Strength Score blends volatility expansion and relative participation into a single numerical value.
Higher scores generally represent Fair Value Gaps created by stronger market displacement accompanied by relatively stronger trading activity.
Users may also define a minimum acceptable Strength Score, allowing weaker Fair Value Gaps to be filtered automatically.
This provides an additional quality layer beyond simple price imbalance detection.
---
# Multi-Timeframe Fair Value Gap Detection
The indicator supports optional Higher Timeframe (HTF) analysis.
When enabled, the script independently evaluates completed candles from the selected higher timeframe using the same Fair Value Gap detection algorithm.
Detected higher-timeframe Fair Value Gaps are projected directly onto the active chart using a dedicated color scheme.
This enables traders to monitor institutional imbalance zones from larger market structures while executing analysis on lower timeframes.
The higher-timeframe feature removes the need to switch between multiple charts during analysis.
---
# Automatic Zone Management
Each detected Fair Value Gap becomes an independent price zone.
Once created, every zone is continuously monitored as new market data becomes available.
Users may choose between two operating modes.
### Persistent Mode
Fair Value Gaps remain visible regardless of future price action.
This mode is useful for historical analysis.
---
### Automatic Mitigation Mode
When enabled, the script continuously checks whether price has fully traded back into the imbalance.
Once a Fair Value Gap has been completely mitigated, its corresponding zone is automatically removed from the chart.
This helps reduce clutter while keeping attention focused on active market inefficiencies.
---
# Dynamic Zone Extension
Every active Fair Value Gap extends forward automatically.
As new candles appear, existing zones continue projecting into future price action until mitigation occurs or the configured extension period expires.
This allows traders to monitor future interactions between price and previously identified imbalance zones without manually updating chart objects.
---
# Visualization
The indicator includes multiple visualization options.
Users may display:
• Bullish Fair Value Gaps
• Bearish Fair Value Gaps
• Higher-Timeframe Fair Value Gaps
Zones may use either fixed bullish/bearish colors or rotate through a customizable color palette, making consecutive imbalance zones easier to distinguish during periods of increased market activity.
Strength Scores may also be displayed directly inside each Fair Value Gap box.
---
# Available Settings
The indicator includes configurable options for:
• Bullish Fair Value Gap visibility
• Bearish Fair Value Gap visibility
• Percentage-based minimum gap filtering
• ATR-based adaptive filtering
• ATR Length
• ATR Multiplier
• Strength Score display
• Minimum Strength Score threshold
• Volume Average Length
• Multi-Timeframe detection
• Higher-Timeframe selection
• Automatic mitigation removal
• Zone extension length
• Fixed colors
• Palette cycling
• Complete visual customization
---
# Suggested Workflow
One possible workflow is:
1. Determine the primary market trend using your preferred methodology.
2. Enable Higher-Timeframe Fair Value Gap detection if broader market context is required.
3. Wait for new Fair Value Gaps that satisfy the selected filtering criteria.
4. Evaluate the Strength Score.
5. Monitor future price interaction with active imbalance zones.
6. Combine Fair Value Gap analysis with your own confirmation techniques such as market structure, liquidity sweeps, order blocks, break of structure (BOS), change of character (CHoCH), volume analysis, or personal risk management rules before making trading decisions.
The indicator intentionally does not generate automated buy or sell signals.
Its purpose is to provide an objective framework for identifying and monitoring price imbalance zones.
---
# Original Design Philosophy
This implementation was developed to extend the traditional Fair Value Gap workflow beyond simple imbalance detection.
Instead of displaying every possible gap, the indicator integrates multiple analytical layers—including adaptive ATR-based filtering, quantitative Strength Scoring, configurable minimum quality thresholds, automatic mitigation management, dynamic zone extension, and optional multi-timeframe confluence—to help traders organize Fair Value Gaps according to both market volatility and relative participation.
The design philosophy focuses on improving clarity, reducing low-quality signals, and providing a flexible analytical framework suitable for different trading styles and market conditions.
---
## Disclaimer
This indicator is an analytical charting tool designed to assist technical analysis.
It does not predict future price movement, guarantee profitable trades, or provide financial or investment advice.
Trading decisions should always be based on independent analysis, proper risk management, and the trader's own methodology.
Wskaźnik

Macro Panel - Risk-On 0-8 [Galin]Macro Panel - Risk-On 0-8
What it does
Turns "how's the market feeling?" into a number, computed the same way every single day: eight binary rules, one point each. 8/8 = everything supports risk. 0/8 = nothing does. The panel shows the full checklist with a pass/fail mark per rule and a color-coded header; the score is also plotted as a stepline - a historical regime curve, so you can scroll back and see every transition of the past years. The indicator is symbol-independent: add it to any chart (a daily SPY chart is the natural home) and it reads the market, not the chart.
Why it matters
Setups don't fail because they were bad setups - they fail because they were taken in the wrong market. Position sizing needs a systematic input, and "feel" drifts exactly when it matters most: after a winning streak and during a scary tape. A fixed eight-rule score can't drift. It also can't be argued with at 9:31 AM.
The eight rules - one point each
1. SPY above its 20-day SMA - tactical trend
2. SPY above its 50-day SMA - intermediate trend
3. QQQ above its 20-day SMA - growth participating
4. IWM above its 50-day SMA - small-cap risk appetite
5. RSP beating SPY over 1 month - breadth beneath the megacaps
6. VIX below a threshold (default 20, adjustable) - volatility calm
7. HYG above its 50-day SMA - credit not stressed
8. SPY 1-month return positive - momentum
Four trend rules, one breadth, one volatility, one credit, one momentum - each catches a different way markets break. Oil, gold, the dollar and rates are deliberately NOT in the score: they are context, not gates. A real macro shock shows up through VIX and SPY anyway - counting it twice double-weights fear.
Reading it
The total is the throttle; the composition is the story. A 6/8 missing its trend points (SPY, QQQ) is a different market from a 6/8 missing its insurance points (VIX, HYG): the first says the tape is broken, the second says the tape is fine and the nerves haven't signed off yet. The panel shows you which mark is missing - that's why it displays all eight rows instead of just the sum.
Suggested bands: 7-8 full risk | 5-6 selective | 3-4 half size | 0-2 no new longs. One rule overrides the total: rule 1 off (SPY below its 20-day) = no new entries, whatever the sum says.
Alerts
Three built in: Kill switch - SPY lost its 20-day | Score dropped to 4 or below | Score entered the 7-8 band. The regime calls you; you don't have to check it.
Settings
VIX calm threshold (default 20) | checklist panel on/off | panel position.
Notes
Chart indicator, designed for daily charts. The score plots with dotted band lines at the 7-8 / 5-6 / 3-4 boundaries. Not intended for the Pine Screener - it needs six data requests and the screener allows five. Wskaźnik

Multi-Oscillator Divergence Scanner [Quantum Algo]Multi-Oscillator Divergence Scanner
====================================================
🔶 OVERVIEW
Multi-Oscillator Divergence Scanner is a confluence-based divergence indicator that scans up to seven classic oscillators simultaneously — Relative Strength Index, Moving Average Convergence Divergence, Stochastic Oscillator, Commodity Channel Index, On Balance Volume, Money Flow Index, and Momentum — and displays the result on two synchronized canvases at once. Divergence lines, graded labels, and reaction zones are drawn directly on the price chart, while a dedicated pane below plots a Composite Oscillator built from every enabled engine, with the same divergence lines mirrored onto the composite itself. You see both slopes of every divergence — price disagreeing with momentum — in one glance.
The problem this script solves is selective divergence trading. Any single oscillator produces frequent divergences, and most of them fail. Requiring multiple mathematically independent engines — momentum-based, volume-based, and volatility-normalized — to diverge at the same confirmed swing filters the noise down to setups where disagreement between price and participation is broad, not incidental.
🔶 WHAT IS A DIVERGENCE?
A divergence occurs when price prints a new extreme but an oscillator refuses to confirm it. A regular bullish divergence forms when price makes a lower low while the oscillator makes a higher low — a classic reversal condition. A regular bearish divergence forms when price makes a higher high while the oscillator makes a lower high. Hidden divergences are the continuation counterparts: price makes a higher low while the oscillator makes a lower low (hidden bullish), or price makes a lower high while the oscillator makes a higher high (hidden bearish). This scanner detects all four types on confirmed swing pivots.
🔶 WHAT IS THE COMPOSITE OSCILLATOR?
The Composite Oscillator is the consensus reading of every engine you enable. Bounded oscillators (Relative Strength Index, Stochastic, Money Flow Index) contribute their native zero-to-one-hundred values; unbounded engines (Moving Average Convergence Divergence histogram, On Balance Volume, Momentum) are range-normalized over a configurable lookback; the Commodity Channel Index is rescaled onto the same axis. The average of all enabled engines plots as a single gradient line with overbought and oversold guides, a midline fill, and divergence lines drawn directly on it — so the pane shows aggregate momentum from the same engines that vote on every signal, not a separate calculation.
🔶 WHY THIS SCRIPT IS ORIGINAL
1. True multi-engine confluence. Divergences are not detected on one oscillator and decorated with others. All seven engines are evaluated independently at every confirmed pivot, and a signal only exists when the minimum confluence count you set is reached.
2. Dual-canvas mirroring. Every qualified divergence is drawn twice: on price, and on the Composite Oscillator in the pane, connected at the same two pivots. Both slopes of the disagreement are visible simultaneously — the visual proof that defines a divergence.
3. Consensus composite pane. The pane line is not one more oscillator; it is the averaged, normalized voice of the exact engines doing the scanning, colored by a gradient between the oversold and overbought guides.
4. Full transparency on every label. Each signal prints its strength as a diamond meter and lists the exact oscillators that diverged (for example: RSI · OBV · MFI). You always know why a signal exists — nothing is a black box.
5. Strength-scaled visuals. Divergence lines thicken with confluence on both canvases, and signals reaching the Strong threshold upgrade to the accent color, so chart hierarchy communicates quality instantly.
6. Reaction zones with a life cycle. Every regular divergence projects a volatility-sized zone around its pivot (measured in Average True Range). Zones gray out automatically the moment price invalidates them, so the chart always distinguishes live zones from dead ones.
7. Divergence pressure gauge. A decaying pressure model accumulates bullish and bearish divergence weight over time, giving a one-glance read on which side has been stacking disagreement with price.
🔶 HOW IT WORKS
Pivot scanning: Swing highs and swing lows are confirmed with a symmetric pivot lookback. All divergence checks are evaluated on closed bars at pivot confirmation, so historical signals do not repaint. Confirmation lag equals the right-side pivot length by design.
Confluence evaluation: At each confirmed pivot, every enabled oscillator's value at that pivot is compared against its value at the previous same-side pivot. The four divergence types are tested independently per oscillator, and contributions are counted.
Signal grading: Signals meeting the Minimum Oscillator Confluence print with strength diamonds (one per contributing oscillator). Signals reaching the Strong Signal Threshold upgrade to the accent color and thicker geometry on both the price chart and the composite pane.
Composite rendering: The pane plots the consensus line with a gradient fill to the midline, dashed overbought and oversold guides, tinted extreme bands, triangle marks at divergence bars, and the mirrored divergence lines.
Reaction zones: Each regular divergence projects a box around its pivot sized by Average True Range, extended a configurable number of bars. A bullish zone grays out when price closes below it; a bearish zone grays out when price closes above it.
Dashboard: A fully themeable panel on the price chart shows the last signal, a live divergence pressure meter, and one row per engine with its live value — color-coded for overbought, oversold, or directional state — plus each engine's most recent divergence side. Text size (four steps), position, and every color (title band, background, frame, grid, header, body, muted) are adjustable.
Chart hygiene: The number of divergences kept is capped by input, on both canvases. Older lines, labels, and zones are deleted automatically, keeping the chart readable and the auto-scale anchored to current price.
🔶 HOW TO USE IT
1. Works on any market — cryptocurrency, forex, gold, indices, stocks, futures — and any timeframe. Higher timeframes produce fewer, larger-structure signals.
2. Start with Minimum Oscillator Confluence at 2 and the Strong threshold at 4. Raise the minimum to 3 for a strict, low-frequency reversal tool; lower it to 1 to study single-oscillator behavior.
3. Read the pane and the chart together: a valid signal shows price sloping one way and the composite sloping the other, connected at the same pivots.
4. Regular divergences are reversal-oriented: treat them as exhaustion evidence at swing extremes, strongest when the composite is also inside an overbought or oversold band.
5. Hidden divergences are continuation-oriented: treat them as trend re-entry evidence during pullbacks, and do not read them like reversal signals.
6. Use the reaction zone as the decision area: a live zone holding on retest supports the signal; a grayed zone means the divergence failed.
7. The pressure meter is context, not a trigger — persistent one-sided pressure alongside fresh strong signals is the highest-quality condition.
🔶 SETTINGS
- Pivot Left / Right Length — swing size; larger values scan bigger structures.
- Independent toggles and lengths for all seven oscillator engines.
- Composite pane: normalization lookback, overbought and oversold levels, pane marks, and mirrored divergence lines toggle.
- Regular and hidden divergence toggles, minimum confluence, strong threshold.
- Reaction zone height (Average True Range ratio) and extension.
- Divergences To Keep — caps historical drawings on both canvases for chart cleanliness and stable auto-scale.
- Dashboard with adjustable text size, position, live oscillator values, and full color theming.
- Full color customization for all chart drawings and pivot markers.
🔶 ALERTS
- Bullish Divergence / Bearish Divergence — a regular divergence met the confluence minimum.
- Hidden Bullish Divergence / Hidden Bearish Divergence — a continuation divergence met the minimum.
- Strong Divergence — a regular divergence reached the strong threshold.
🔶 FREQUENTLY ASKED QUESTIONS
Does the indicator repaint? No. Divergences are evaluated only on confirmed pivots at bar close. The trade-off is intentional confirmation lag equal to the right-side pivot length.
Why does a pane divergence line sometimes start slightly off the composite's visual peak? Divergence is measured at price structure points. The line connects the composite's values at the two confirmed price pivots, which is the correct comparison even when the composite made its own extreme a bar or two away.
Why do some obvious divergences not print? Either the confluence minimum was not reached, the oscillator involved is disabled, or the swing did not confirm as a pivot under the current lengths.
Which oscillators should I enable? The default set mixes momentum and volume perspectives, which is the point of confluence: independent evidence, not seven copies of the same math.
Is a Strong signal a guaranteed reversal? No. Strength counts agreement between engines; it is a transparency measure, not a probability of profit.
🔶 CREDITS
This script builds its scanning and composite engine on classic, public-domain oscillators, and gratefully credits their creators: the Relative Strength Index by J. Welles Wilder Jr. (1978), Moving Average Convergence Divergence by Gerald Appel, the Stochastic Oscillator popularized by George C. Lane, the Commodity Channel Index by Donald Lambert (1980), On Balance Volume by Joseph Granville (1963), and the Money Flow Index by Gene Quong and Avrum Soudack. All oscillator calculations use standard built-in formulas. Drawing divergence lines on an oscillator is a long-established charting convention popularized by many community authors, acknowledged here as shared prior art. The multi-engine confluence scanner, the consensus Composite Oscillator, the dual-canvas mirroring, transparency labeling, strength grading, reaction zone life cycle, pressure model, and all code in this script are original work — no third-party or open-source script code was reused.
🔶 LIMITATIONS
Divergence can persist or fail entirely during strong trends; regular divergences against a powerful trend are the weakest application. Volume-based engines (On Balance Volume, Money Flow Index) are less meaningful on symbols with unreliable volume reporting. The composite's normalized components depend on the normalization lookback. Pivot confirmation introduces intentional delay. No indicator replaces independent analysis.
🔶 DISCLAIMER
This script is provided strictly for educational and informational purposes. It is not financial advice, an investment recommendation, or a solicitation to buy or sell any financial instrument. Past behavior of any signal does not guarantee future results. Trading involves substantial risk. Always do your own research and manage risk independently.
Wskaźnik

Dynamic Buying and Selling Power (ADTM)
什么是 ADTM?
ADTM(Dynamic Buying and Selling Power Indicator,动态买卖气指标)是一种经典的动量与反转量化指标。它通过对比开盘价的跃升与下挫,精确量化开盘后多空双方的推进力度(即爆发力),并将这种力量对比归一化在 的固定区间内。
与传统单纯依赖收盘价(Close)的振荡指标不同,ADTM 更加关注 开盘价(Open)相对于前一交易日的位置以及当日极值(High/Low)的延伸空间 ,从而能够更敏锐地捕捉到市场资金的日内异动。
---
为什么使用它?
在波诡云谲的市场中,单纯的均线或 lagging 指标容易产生钝化。ADTM 的优势在于:
无量纲化区间:其输出被严格限制在 之间,避免了绝对数值对趋势研判的干扰。
日内真实动能:通过计算买方动态能量(DTM)和卖方动态能量(DBM),能够更早地在左侧识别出多空力量的衰竭点。
极佳的反转提示:特别适合配合超买超卖边界进行逆势(反转)波段的卡点操作。
---
怎么用?
本指标的使用逻辑非常直观,默认参数为经典配置: N = 23(求和周期),M = 8(信号均线周期)。
左侧买点(超卖区):
当蓝色 ADTM 曲线跌破 -0.5 时,意味着市场短期内空头宣泄极快,进入超卖状态。这通常是极佳的左侧分批布局或观察止跌反转的买点。
左侧风险(超买区):
当蓝色 ADTM 曲线突破 +0.5 时,意味着多头短期冲锋过急,进入超买状态。此时应防范多头力竭回撤,注意锁定利润或降低仓位。
中轴信号:
0轴为多空分界线。当 ADTM 在 0 轴上方运行时,多头占优;反之,空头占优。
均线交叉:
蓝色主线(ADTM)与橙色信号线(MA_ADTM)的黄金交叉与死亡交叉,可作为右侧动能确认的辅助信号。
---
在哪里用?
本指标采用纯粹的价格几何结构算法,具有极强的普适性:
适用市场:广泛适用于 A 股、美股、加密货币、商品期货以及外汇等主流交易市场。
适用周期:在日线(Daily)及以上大周期中表现尤为稳定,能够有效过滤盘整期的日内噪音;在小周期(如 1H/4H)中,配合趋势背景亦可用于日内波段捕捉。
---
原创与致谢声明
指标原创作者: 本指标的核心算法源自经典量化分析领域的经典设计。
脚本重构与发布: 由本人进行 Pine Script v6 的标准化重构、算法优化与开源发布。
风险提示: 任何技术指标都无法百分之百预测市场。建议将 ADTM 融入自身的交易系统中,结合量价结构、关键支撑阻力位以及严谨的资金管理共同使用。
---
What is ADTM?
ADTM (Dynamic Buying and Selling Power Indicator) is a classic momentum and reversal quantification tool. It precisely quantifies the offensive strength (i.e., explosive power) of both bulls and bears after the market opens by comparing the upward jumps and downward drops of the opening price, and normalizes this power comparison within a fixed range of .
Unlike traditional oscillators that rely solely on the closing price (Close), ADTM places greater emphasis on the opening price (Open) relative to the previous trading day's position, as well as the extension space of the day's extremes (High/Low) , enabling it to more keenly capture intraday anomalies in market capital flow.
---
Why Use It?
In volatile and unpredictable markets, simple moving averages or lagging indicators are prone to desensitization (flattening). The advantages of ADTM are:
Dimensionless interval: Its output is strictly confined within , eliminating the interference of absolute price levels on trend assessment.
Intraday true momentum: By calculating Dynamic Buying Momentum (DTM) and Dynamic Selling Momentum (DBM), it can identify exhaustion points of bullish/bearish power earlier on the left side.
Excellent reversal signals: Particularly well-suited for contrarian (reversal) swing trading by utilizing overbought/oversold boundaries.
---
How to Use It?
The usage logic of this indicator is highly intuitive, with default parameters set to the classic configuration: N = 23 (Summation Period), M = 8 (Signal MA Period).
Left-side Buy Signal (Oversold Zone):
When the blue ADTM line drops below -0.5, it indicates that bearish forces have been excessively unleashed in the short term, entering an oversold state. This is typically an excellent opportunity for left-side accumulation or observing for a bullish reversal.
Left-side Risk Signal (Overbought Zone):
When the blue ADTM line rises above +0.5, it indicates that bullish forces have pushed too aggressively in the short term, entering an overbought state. At this point, one should be cautious of bullish exhaustion and pullbacks, and consider locking in profits or reducing positions.
Zero-Line Signal:
The 0.0 axis serves as the bull-bear dividing line. When ADTM is above 0, bulls are in control; when below 0, bears are in control.
Moving Average Crossover:
The golden cross and death cross between the blue main line (ADTM) and the orange signal line (MA_ADTM) can serve as auxiliary signals for right-side momentum confirmation.
---
Where to Use It?
This indicator employs a pure geometric price-structure algorithm, offering strong universality:
Applicable Markets: Widely applicable to A-shares, U.S. stocks, cryptocurrencies, commodity futures, forex, and other major trading markets.
Applicable Timeframes: Performs particularly well on Daily and higher timeframes, effectively filtering out intraday noise during consolidation periods. On lower timeframes (e.g., 1H/4H), it can also be used for intraday swing trading when combined with the broader trend context.
---
Acknowledgments & Originality Statement
Original Author: The core algorithm of this indicator originates from classic designs in the field of quantitative analysis.
Script Re-engineering & Release: This script has been fully refactored, optimized, and released as open-source by myself.
Risk Disclaimer: No technical indicator can predict the market with 100% accuracy. It is strongly recommended to integrate ADTM into your own trading system, combining it with volume-price structure, key support/resistance levels, and strict risk management practices. Wskaźnik

FVG Support & ResistanceAuto FVG Target (1:2 RR)
This indicator automatically detects bullish and bearish Fair Value Gaps (FVGs) and helps traders visualize potential trade setups using a fixed Risk-to-Reward framework.
Features
Automatic detection of Bullish and Bearish Fair Value Gaps.
Clear FVG box visualization on the chart.
Entry signals based on price rejecting the Fair Value Gap and closing outside the zone.
Fixed Stop Loss calculated using the gap size (1× gap).
Automatic Take Profit based on a fixed 1:2 Risk-to-Reward ratio.
Buy and Sell labels for easy signal identification.
Configurable display settings for FVG visualization.
Designed to work across multiple markets and timeframes.
How It Works
A bullish Fair Value Gap is identified when the current candle's low is above the high of two candles earlier. A bearish Fair Value Gap is identified when the current candle's high is below the low of two candles earlier.
The indicator monitors these imbalance zones and waits for price to interact with them. When price rejects an FVG and closes outside the zone, a potential trade setup is generated. The stop loss is based on the size of the Fair Value Gap, while the take-profit target is automatically set to a fixed 1:2 Risk-to-Reward ratio.
Intended Use
This indicator is designed as a chart analysis tool to assist with identifying Fair Value Gap opportunities. It does not predict future price movement or guarantee profitable trades. Users should always combine its signals with their own analysis, risk management, and trading plan.
Notes
Works on all timeframes.
Suitable for Forex, Crypto, Indices, Commodities, and Stocks.
Best used alongside market structure, liquidity concepts, or other confirmation tools.
Historical results and plotted signals should not be considered a guarantee of future performance. Wskaźnik

Wskaźnik

Wskaźnik

Trend-Reset Cumulative Delta [ChartPrime]Trend-Reset Cumulative Delta
🔶 OVERVIEW
Standard Cumulative Delta indicators track the net difference between buying and selling volume from a fixed starting point (like the start of the day). While useful, they often become skewed by historical data that is no longer relevant to the current market trend.
The Trend-Reset Cumulative Delta solves this by using a Volatility-Based Reset Mechanism . It utilizes an ATR (Average True Range) envelope to define the current trend; the moment price breaks out of this envelope, the Cumulative Delta "resets." This ensures you are only seeing the volume pressure relevant to the active trend.
🔶 THE RESET LOGIC: ATR BANDS
The indicator tracks a central EMA surrounded by volatility bands. This creates a "dynamic corridor" for price:
Bullish Trend: When price closes above the Upper ATR Band , the trend turns bullish and the Delta counter resets to 0.
Bearish Trend: When price closes below the Lower ATR Band , the trend turns bearish and the Delta counter resets to 0.
By resetting at every major trend shift, the indicator highlights the "fresh" volume entering the move, making it easier to spot exhaustion or trend strength without the baggage of old data.
🔶 KEY FEATURES
Z-Score Pivot Filter: Not all pivots are equal. This indicator uses a Z-Score calculation to identify "outlier" volume events. It highlights pivots where the Cumulative Delta is significantly higher (statistically) than the recent average.
Trend Summary Labels: At the end of every trend cycle, a label appears summarizing the Total Volume and Net Delta of that specific move. This allows you to compare the "effort vs. result" of previous trends side-by-side.
Dual-Chart Projection: Filtered volume pivots can be projected directly onto the price chart, showing you exactly which candle saw a statistical volume extreme.
Dynamic Column Coloring:
* Bright Colors: Volume is increasing in the direction of the trend.
* Faded Colors: Volume pressure is slowing down (potential divergence/exhaustion).
🔶 TRADING APPLICATIONS
Effort vs. Result (Divergence): If price is making new trend highs but the Trend-Reset Delta columns are becoming smaller or fading in color, it indicates that the "effort" (volume) is not supporting the move.
Institutional Absorption: Look for the Z-Score Pivot markers (▼/▲). When these appear at structural support or resistance, it signifies that a massive amount of volume was transacted, often indicating institutional absorption.
Trend Strength Comparison: Use the Trend Summary Labels to look back at previous cycles. If the previous Bullish trend had a Net Delta of +1M and the current Bullish trend only has +200k, the current move is significantly more fragile.
🔶 CONCLUSION
The Trend-Reset Cumulative Delta provides a cleaner, more actionable view of volume flow. By stripping away irrelevant historical volume and focusing on the current volatility-defined trend, it helps traders identify when a trend is being fueled by fresh capital—or when it's simply running on fumes. Wskaźnik

Liquidity Sweep + TargetLiquidity Sweep + Target
This indicator detects liquidity sweeps — moments where price wicks beyond a recent swing high or low to trigger stops/liquidity, then closes back inside the range (a classic stop-hunt / SFP pattern). Once a sweep is confirmed, the indicator automatically plots a target level for the expected reversal move.
How it works:
Identifies swing highs and lows using an adjustable pivot lookback.
Bearish Sweep: price wicks above the last swing high but closes back below it → signals potential downside reversal, target plotted below.
Bullish Sweep: price wicks below the last swing low but closes back above it → signals potential upside reversal, target plotted above.
Target calculation: choose between (1) the next opposite-side liquidity level (previous swing point) or (2) a fixed risk:reward multiple of the sweep range — fully configurable in settings.
Features:
Clean sweep labels (bullish/bearish) plotted directly on the chart
Dashed target lines with price labels
Adjustable pivot sensitivity, wick threshold, and RR multiple
Built-in alert conditions for both bullish and bearish sweeps
How to use it:
Wait for a sweep label to print, then look for confirmation (structure shift, momentum candle, or your own entry trigger) before acting on the plotted target. This tool identifies liquidity grabs — it does not predict direction with certainty, so always combine with proper risk management. Wskaźnik

Liquidity Sweep & Golden Zone [StrixEDGE]Overview
Liquidity Sweep & Golden Zone is a multi-timeframe structural analysis tool built for traders who use Smart Money Concepts (SMC) and ICT methodology. It identifies liquidity sweeps at confirmed swing levels, maps the Fibonacci Golden Zone (OTE), and presents a real-time confluence dashboard across 15-minute, 1-hour, 4-hour, and daily timeframes.
The indicator answers three questions at a glance: where is the liquidity?, has it been swept?, and do multiple timeframes agree on direction?
How It Works
Liquidity Sweep Detection
The engine tracks confirmed swing highs and swing lows using pivot detection. These pivots represent resting liquidity pools — areas where stop-loss orders accumulate:
- Buy-Side Liquidity (BSL) sits above swing highs, where short sellers place their stops. When price wicks above a swing high and closes back below, a BSL sweep is triggered — signaling that buy-side stops were hunted. This typically precedes bearish continuation.
- Sell-Side Liquidity (SSL) sits below swing lows, where long traders place their stops. When price wicks below a swing low and closes back above, an SSL sweep is triggered — signaling that sell-side stops were hunted. This typically precedes bullish reversal.
Each sweep event displays the estimated volume in USDT at the moment of the sweep. This is calculated as `volume × close` on the sweep bar and serves as a proxy for the magnitude of liquidations that occurred. Higher volume sweeps tend to produce stronger reversals.
After a sweep, the level is updated to the new extreme — preventing duplicate signals and establishing a fresh liquidity reference.
Support & Resistance (Pivot-Based)
Active (un-swept) pivot levels are drawn on the chart as structural Support and Resistance:
- A line extending from the bar where the pivot formed to the current price area
- A zone band (ATR × 0.15) around the level, representing the area of influence
- Origin labels showing "Buy-Side Liquidity SWEEP" or "Sell-Side Liquidity SWEEP" with the USDT volume
- Price labels on the right edge for quick reference
These levels update dynamically: when a new pivot is confirmed, the line starts from the new origin. When a sweep occurs, the level shifts to the sweep bar.
Golden Zone (Fibonacci OTE: 0.618 – 0.786)
The Golden Zone represents the Optimal Trade Entry area — the 61.8% to 78.6% Fibonacci retracement of the most recent price range. Unlike pivot-based calculations, this indicator uses a **lookback-based approach**: it finds the highest high and lowest low over a configurable number of bars, then derives the zone from that range.
The zone is visualized with:
- A filled box between the 0.618 and 0.786 levels (transparency adjustable)
- Dashed border lines at 0.618 and 0.786
- A dotted midline at the 0.702 level
- Price labels showing exact values
- A centered "GOLDEN ZONE" tag
This approach produces a stable, always-visible zone that doesn't depend on individual pivot detection, making it reliable across all market conditions.
Multi-Timeframe Heatmap
The core of this indicator is a 7-column heatmap table that evaluates market conditions across four timeframes simultaneously:
| Column | What It Shows | Bullish | Bearish |
|--------|--------------|---------|---------|
| SWEEP | Recent liquidity sweep direction | ● BULL (SSL swept) | ● BEAR (BSL swept) |
| GZ | Price position relative to Golden Zone | ▲ ABOVE | ▼ BELOW |
| S/R | Price position vs. pivot S/R midpoint | ▲ BULLISH | ▼ BEARISH |
| BIAS | EMA 21/50 trend direction | ▲ BULL | ▼ BEAR |
| RSI | RSI(14) value with decimal precision | Color-coded by zone | Color-coded by zone |
| SIGNAL | Composite of all conditions | LONG ▲ | SHORT ▼ |
Signal Logic: The SIGNAL column counts four conditions per timeframe — RSI above/below 50, price in/above the Golden Zone, price above/below the S/R midpoint, and EMA bias direction. When 3 or more conditions align bullish, the signal reads LONG. When 3 or more align bearish, it reads SHORT. Otherwise, NEUTRAL.
A confluence bar at the bottom aggregates all timeframes. When the majority of conditions across all four timeframes agree, it displays STRONG BULLISH or STRONG BEARISH CONFLUENCE.
RSI Color Coding
| RSI Range | Color | Meaning |
|-----------|-------|---------|
| > 70 | Orange | Overbought |
| 50 – 70 | Green | Bullish momentum |
| 30 – 50 | Red | Bearish momentum |
| < 30 | Blue | Oversold |
Settings
Structure Settings
| Setting | Default | Description |
|---------|---------|-------------|
| Pivot Lookback Length | 5 | Bars left and right to confirm a swing pivot. Higher values produce fewer but stronger levels |
| Sweep Active Memory | 10 | How many bars a sweep signal remains active on the heatmap after detection |
Golden Zone
| Setting | Default | Description |
|---------|---------|-------------|
| Lookback Period | 20 | Number of bars to find highest high and lowest low for Fibonacci calculation |
| Show Golden Zone | On | Toggle zone visibility on chart |
| Fill Golden Zone | On | Shade the area between 0.618 and 0.786 |
| Fill Transparency | 88 | Opacity of the filled zone (50–98) |
| Golden Zone Color | Gold | Color for all Golden Zone elements |
Support & Resistance
| Setting | Default | Description |
|---------|---------|-------------|
| Show S/R on Chart | On | Toggle S/R lines, zone bands, and labels |
| Support Color | Teal | Color for support level and SSL elements |
| Resistance Color | Red | Color for resistance level and BSL elements |
| Line Width | 2 | Thickness of S/R lines (1–4) |
| Line Style | Solid | Solid, Dashed, or Dotted |
| Show Price Labels | On | Display price values at the right edge of each level |
Sweep Event Labels
| Setting | Default | Description |
|---------|---------|-------------|
| Show Sweep Labels | On | Toggle sweep event markers on chart |
| Bullish Sweep Color | Green | Color for SSL sweep labels (bullish reversal) |
| Bearish Sweep Color | Red | Color for BSL sweep labels (bearish reversal) |
Heatmap Table
| Setting | Default | Description |
|---------|---------|-------------|
| Show Heatmap Table | On | Toggle the entire dashboard |
| Table Position | Top Right | 9 position options across the chart |
| Table Cell Size | Normal | Tiny, Small, Normal, Large, or Auto |
Alerts
Five alert conditions are built in and ready to use:
1. Bullish Liquidity Sweep — SSL swept, potential bullish reversal
2. Bearish Liquidity Sweep — BSL swept, potential bearish reversal
3. Bull Sweep + Golden Zone — SSL swept while price is inside the OTE zone (high-probability long)
4. Bear Sweep + Golden Zone — BSL swept while price is inside the OTE zone (high-probability short)
5. Price in Golden Zone — Price enters the 0.618–0.786 zone on any bar
Disclaimer
This indicator is a technical analysis tool designed to assist in identifying potential areas of interest based on market structure and liquidity concepts. It does not constitute financial advice. The USDT volume figures are approximations, not verified liquidation data. Always use proper risk management and combine this tool with your own analysis. Past performance of any signal or pattern does not guarantee future results. Trade at your own risk. Wskaźnik

EMA + Supertrend + OBV [StrixEDGE]Trend Engine EMA + Supertrend + OBV is a multi-timeframe trend scoring system that combines EMA structure, Supertrend direction, and OBV volume flow into a single overlay with a detailed heatmap dashboard. It evaluates four timeframes simultaneously and presents the results in a color-coded, section-organized table directly on the chart.
The indicator answers three questions per timeframe: Is the structure bullish or bearish? Is the directional signal confirmed? Is volume supporting the move? It then aggregates these into a confluence score and cross-timeframe alignment reading.
Components
EMA Stack (21 / 50 / 200)
Three exponential moving averages forming a structural hierarchy. The scoring logic evaluates both the EMA order and price position:
| Condition | Score | Label |
|---|---|---|
| 21 > 50 > 200, price above all | +2 | FULL BULL ▲▲ |
| 21 > 50 > 200 | +1 | BULLISH ▲ |
| Price above 200 but EMAs not ordered | +1 | BULLISH ▲ |
| No clear alignment | 0 | MIXED ◆ |
| Price below 200 but EMAs not ordered | −1 | BEARISH ▼ |
| 21 < 50 < 200 | −1 | BEARISH ▼ |
| 21 < 50 < 200, price below all | −2 | FULL BEAR ▼▼ |
The 200 EMA is separately tracked as "Price/200" in the heatmap, since institutional participants widely use this level as the dividing line between bull and bear regimes.
On the chart, all three EMAs turn green when bull-stacked and red when bear-stacked. A ribbon fill between the fast and mid EMA visualizes alignment strength. Golden Cross (50 above 200) and Death Cross events are marked with "GC" and "DC" labels.
Supertrend (10, 3)
An ATR-based trailing stop that produces a binary directional signal. When the Supertrend line is below price, it scores +1 (BULLISH). When above, it scores −1 (BEARISH). The line also serves as a dynamic stop-loss level. Triangle markers appear at each flip point.
OBV with 20-period SMA
On Balance Volume is calculated cumulatively — adding volume on up-closes, subtracting on down-closes. The heatmap evaluates two dimensions independently: OBV position relative to its SMA (above or below) and the SMA slope direction (rising, falling, or flat). This produces six distinct flow states:
| OBV vs MA | Slope | Label | Meaning |
|---|---|---|---|
| Above | Rising | ACCUM ▲ | Active accumulation — institutional buying |
| Above | Flat | ABOVE MA | Holding above average — neutral positive |
| Above | Falling | WEAKENING | Position eroding despite being above MA |
| Below | Rising | BUILDING | Recovery underway — improving flow |
| Below | Flat | BELOW MA | Holding below average — neutral negative |
| Below | Falling | DISTRIB ▼ | Active distribution — institutional selling |
OBV scores +1 when above MA and rising, −1 when below MA and falling, and 0 for all intermediate states.
The MTF Heatmap
The heatmap table is organized into four color-coded sections:
STRUCTURE (blue header) — EMA Stack alignment and Price vs EMA 200 for each timeframe. Shows whether the market's structural foundation is bullish, bearish, or mixed.
DIRECTION (purple header) — Supertrend signal per timeframe. A clean binary reading of whether the trailing stop is bullish or bearish.
VOLUME FLOW (teal header) — OBV flow state per timeframe. Shows whether volume is confirming the price trend, diverging from it, or transitioning.
CONFLUENCE (gold header) — The aggregated output:
- Score: total from −4 to +4 per timeframe
- Strength: visual dot bar (● ● ● ● ○) representing signal intensity
- Regime: classification label (STRONG BULL BULLISH NEUTRAL BEARISH STRONG BEAR )
At the bottom, an MTF Alignment summary shows how many timeframes agree (e.g., "▲ 3/4 BULLISH — Strong alignment www.tradingview.com or "◆ SPLIT 2/2 — No clear bias www.tradingview.com).
Every cell uses heatmap coloring — bright green for strong bullish, through gray for neutral, to deep red for strong bearish — providing an instant visual scan of market conditions.
| Component | Max bullish | Neutral | Max bearish |
|---|---|---|---|
| EMA Stack | +2 | 0 | −2 |
| Supertrend | +1 | — | −1 |
| OBV Flow | +1 | 0 | −1 |
| **Total** | +4 | 0 | −4 |
Classification per timeframe:
- +3 to +4 → STRONG BULL
- +1 to +2 → BULLISH
- 0 → NEUTRAL
- −1 to −2 → BEARISH
- −3 to −4 → STRONG BEAR
Reading the heatmap
The heatmap's primary value is showing cross-timeframe agreement at a glance:
All columns green — Full alignment across timeframes. This is the highest-probability environment for trend-following trades.
Higher TFs green, lower TFs red — A pullback within a larger uptrend. The structural trend is intact; the short-term weakness may represent an entry opportunity.
Lower TFs green, higher TFs red — A rally within a larger downtrend. Unless the higher timeframes are shifting, this is likely a counter-trend bounce.
Mixed colors — No clear directional edge. Reduce position size or wait for alignment to develop.
Section-level reading — If STRUCTURE and DIRECTION are green but VOLUME FLOW is red, the trend lacks volume confirmation and may be fragile. If VOLUME shows ACCUM but DIRECTION is bearish, smart money may be accumulating before a reversal.
Alerts
Seven alert conditions are available:
- Strong bullish trend detected (current TF)
- Strong bearish trend detected (current TF)
- Golden Cross — EMA 50 crosses above EMA 200
- Death Cross — EMA 50 crosses below EMA 200
- Supertrend flip bullish
- Supertrend flip bearish
- Any trend classification change
Disclaimer: This indicator is a technical analysis tool for educational and informational purposes. It does not constitute financial advice or a recommendation to buy or sell any security. No trading indicator can predict future price movements. Past performance is not indicative of future results. Always conduct your own analysis and consider your risk tolerance before making trading decisions. Wskaźnik

Wskaźnik

Momentum Consensus Heatmap [StrixEDGE]█ MOMENTUM CONSENSUS HEATMAP
A multi-timeframe momentum aggregation system that scans 6 oscillators across 4 customizable timeframes and fires high-conviction BUY/SHORT signals only when a critical mass of indicators reach overbought or oversold consensus simultaneously.
█ CONCEPT
Most momentum-based strategies rely on a single oscillator on a single timeframe — a setup prone to false signals and noise. This indicator solves that by requiring cross-timeframe and cross-indicator agreement before generating a signal.
The core logic works in two layers:
Layer 1 — Timeframe Consensus (per indicator):
Each oscillator is evaluated across 4 timeframes (default: 15m, 1H, 4H, 1D). An indicator only qualifies as "Overbought" or "Oversold" when at least 3 out of 4 timeframes agree (configurable: 2/4, 3/4, or 4/4).
Layer 2 — Indicator Consensus (overall signal):
A chart signal fires only when a user-defined number of indicators (default: 4 out of 6) have all independently reached Layer 1 consensus in the same direction.
This dual-filter architecture dramatically reduces noise and isolates moments of genuine, broad-based momentum exhaustion.
█ OSCILLATORS USED
• RSI (Relative Strength Index) — Classic momentum oscillator measuring speed and magnitude of price changes. Default OB/OS: 70/30.
• Stochastic RSI — Stochastic formula applied to RSI values, more sensitive to short-term momentum shifts than raw RSI. Default OB/OS: 80/20.
• Stochastic Oscillator — Compares closing price to the high-low range over a lookback period. Independent from Stoch RSI. Default OB/OS: 80/20.
• CCI (Commodity Channel Index) — Measures deviation from the statistical mean. Unbounded, making it useful for detecting extreme momentum. Default OB/OS: +100/−100.
• Williams %R — Reflects where the current close sits relative to the highest high. Inverted scale (−100 to 0). Default OB/OS: −20/−80.
• MFI (Money Flow Index) — Volume-weighted RSI. Adds a volume confirmation dimension that pure price-based oscillators lack. Default OB/OS: 80/20.
█ HEATMAP TABLE
The on-chart heatmap table provides a real-time dashboard of all 24 data points (6 indicators × 4 timeframes):
• Each cell shows the live oscillator value with color-coded background:
🔴 Red = Overbought zone
🟢 Green = Oversold zone
⚫ Gray = Neutral
• SCORE column shows how many timeframes agree for each indicator (e.g., "3/4 OB").
• SIGNAL column shows whether that individual indicator has reached consensus ("SHORT ▼" / "BUY ▲" / "—").
• CONSENSUS row at the bottom shows the overall verdict with a percentage score of indicator agreement.
Table position and text size are fully customizable through the settings panel.
█ CHART SIGNALS
When the overall consensus threshold is met:
▲ Green triangle below bar = BUY signal (oversold consensus)
▼ Red triangle above bar = SHORT signal (overbought consensus)
Signals fire only on the first bar of a new consensus event (no repeated signals while conditions persist). A subtle background color flash highlights the signal bar.
█ OPTIONAL TREND FILTER (EMA)
When enabled, signals are filtered by an EMA trend bias:
• BUY signals require price above the EMA (buying in an uptrend)
• SHORT signals require price below the EMA (shorting in a downtrend)
This is disabled by default to keep the indicator pure momentum-based, but can significantly improve signal quality in trending markets.
█ SETTINGS OVERVIEW
⏱ Timeframes — All 4 timeframes are independently configurable.
⚙ Indicator Lengths — Full control over each oscillator's lookback period.
📊 OB/OS Thresholds — Adjust overbought/oversold levels for every oscillator independently.
🎯 Signal Rules:
• Min TF Consensus: How many timeframes must agree per indicator (2-4, default 3).
• Min Indicators: How many indicators must reach consensus for a chart signal (1-6, default 4).
🎨 Table Appearance — Position, size, and full color customization (OB color, OS color, neutral, header, text).
🔔 Alerts — Native TradingView alerts with detailed messages including ticker, timeframe, and consensus count.
█ HOW TO USE
1. Apply the indicator to any chart (works on all instruments and timeframes).
2. The heatmap table updates in real time — use it as a momentum dashboard.
3. Watch for chart signals:
• When 4+ indicators show oversold consensus across 3+ timeframes → BUY signal.
• When 4+ indicators show overbought consensus across 3+ timeframes → SHORT signal.
4. Set up TradingView alerts to get notified when signals fire.
5. For higher conviction:
• Increase "Min Indicators" to 5 or 6 (fewer but stronger signals).
• Require 4/4 timeframe agreement instead of 3/4.
• Enable the EMA trend filter.
█ IMPORTANT NOTES
• This indicator uses request.security() to fetch multi-timeframe data. On the current timeframe, values update in real time. Higher timeframe values reflect the last closed bar of that timeframe.
• Signals are non-repainting once the bar closes. Intrabar, the table values and potential signals update as new ticks arrive (expected behavior for a real-time dashboard).
• This tool is designed for identifying momentum exhaustion zones. It does not predict direction — use it in confluence with price action, support/resistance, and your broader trading plan.
• Past performance is not indicative of future results. Always use proper risk management.
█ CREDITS & LICENSE
Open source under Mozilla Public License 2.0.
Built with Pine Script™ v6. Wskaźnik