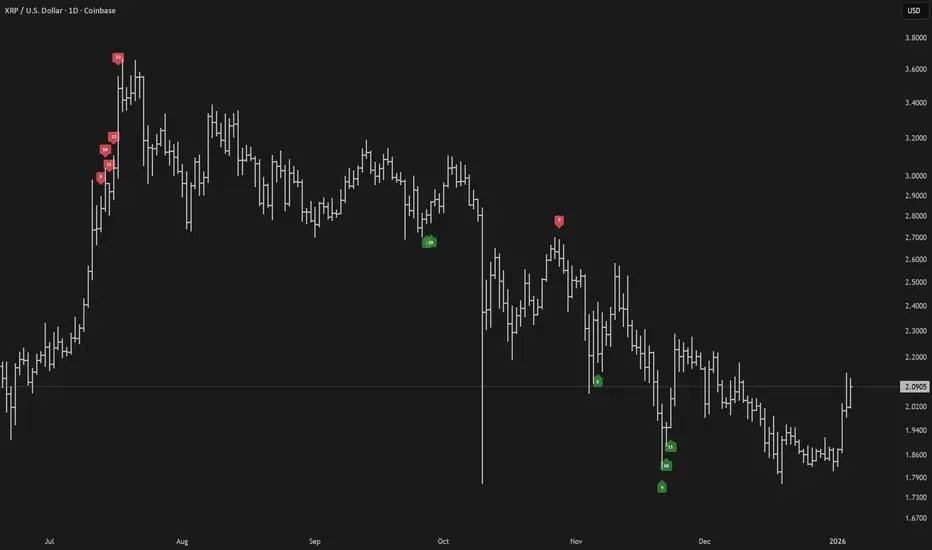
1-Year High/Low Mean (Daily Anchored)This indicator calculates the highest high and lowest low over the past year using daily candles, then plots the mean (midpoint) between those two levels. The result is a clean, stable structural reference line that helps traders understand where current price sits within its yearly range.
What It Shows
1‑Year High – the highest daily high over the lookback period
1‑Year Low – the lowest daily low over the same period
1‑Year Mean – the midpoint between the yearly high and low
These
Wskaźnik