Historical Events for DXYИсторические события для DXY для NZT Индикатор сырой, хотелось бы доработать с вашей помощьюWskaźnikod askhat_balguzhinZaktualizowano 259
EMA MTF Watchlist Alert ScannerEMA MTF Watchlist Alert Scanner with customizable table and alert creation Recommended Settings EMA Length = 13 Match Mode = All Enabled Timeframes Scan Direction = Either Use TF1 = 5 Use TF2 = 15 Use TF3 = 60 Use TF4 = 240 Use TF5 = OFF Use TF6 = OFFWskaźnikod olujojomofe41
EMA MTF Watchlist ScannerMulti Timeframe Ticker Scanner -By Olu_777 Give ability to scan multiple tickers on your watchlist for certain conditions and then trigger alerts when conditions are met - See Eg below: Recommended Settings EMA Length = 13 Use TF1 = ON → 5 Use TF2 = ON → 15 Use TF3 = ON → 60 Use TF4 = ON → 240 Use TF5 = OFF Use TF6 = OFF Required Timeframes Aligned = 4 Match Mode = All Enabled Timeframes Scan Direction = EitherWskaźnikod olujojomofeZaktualizowano 13
Heikin Ashi RSI Fade - Short IndicatorHeikin Ashi RSI Fade — Short Indicator 🔷 What it does: This is a signal-only indicator that mirrors a fade-the-strength short workflow. It tracks one virtual short position at a time and fires webhook-ready alerts on three discrete events: a short entry confirmed by dual filters across two timeframes, a take-profit close when price drops a fixed percentage below entry, and a stop-loss close when price rises a fixed percentage above entry. No backtest engine — the indicator is built to drive a lWskaźnikod 3Commas440
VIGAX/VVIAX 10Y & 15Y Detrended Z-ScoresThis indicator measures how stretched U.S. large-cap growth is versus U.S. large-cap value by analyzing the VIGAX/VVIAX ratio. Because VIGAX represents large-cap growth and VVIAX represents large-cap value, a rising ratio means growth is outperforming value, while a falling ratio means value is outperforming growth. The script calculates the ratio, converts it to log scale, and then fits rolling 10-year and 15-year regression trends. It plots the residual z-score of the ratio relative to those Wskaźnikod jlamadehe21
Gap FinderThis indicator automatically detects and highlights significant price gaps using semi-transparent boxes. It draws a precise zone from the previous close to the current open, giving you an immediate visual representation of the gap area. Key Features: Customizable Sensitivity: Set your own minimum gap size (default is 3%). Visual Precision: Clear green (Gap Up) and red (Gap Down) boxes explicitly mark the empty price action space without hiding future candles. Adjustable Length: Choose howWskaźnikod martinschlosinger22
Previous Session Range + Projected Candles + BOS/CHOCH Protected Overview: Previous Session Range + Projected Candles + BOS/CHOCH Protected is a multi-feature price action framework designed to combine session context, market structure, and protected liquidity logic into a single overlay. The indicator builds and extends the previous session range across the active session, projects both the previous and current session candles for quick visual comparison, and tracks BOS (Break of Structure) and CHOCH (Change of Character) events using swing-based structurWskaźnikod getakabu106
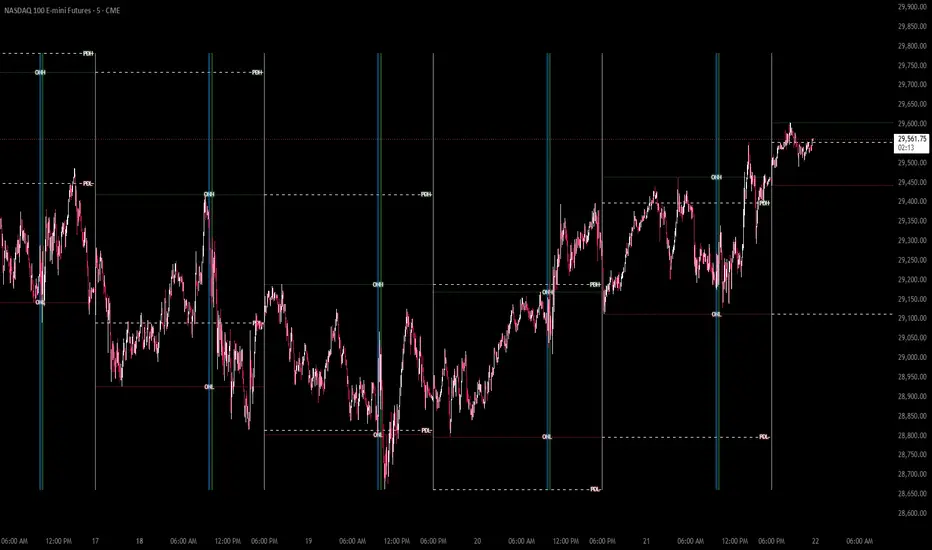
[Tiestobob] Previous Day and Overnight Highs/Lows** Previous Day and Overnight Highs/Lows** This indicator plots two of the most widely watched price levels used by intraday traders — the **Previous Day High/Low (PDH/PDL)** and the **Overnight High/Low (ONH/ONL)** — directly on your chart, automatically adjusted for New York time (EST/EDT). --- **📌 What It Does** - **Previous Day H/L** — Draws dashed white lines at the prior trading day's high and low (6:00 PM – 4:00 PM ET session) - **Overnight H/L** — Draws dotted green/red lines markinWskaźnikod TiestobobZaktualizowano 50
Futures HTF 10-Level ToolkitSMA 50 on the 1hr, 4hr, and daily SMA 200 on the 1hr, 4hr, and daily premarket ORB 9:30-10 ORB asia ranges.. NY AM rangeWskaźnikod okstateofmindZaktualizowano 21
ZenFlow LiquidityZenFlow Liquidity Institutional-style liquidity mapping and ICT-inspired market structure overlay for futures and intraday traders. Features: Liquidity sweep detection PDH / PDL reactions Asia & London session highs/lows Pullback & reversal watch states Order-flow proxy scoring VWAP + EMA structure Trade confidence grading Lightweight dashboards Designed to help traders identify: smart-money reactions continuation zones reversal conditions higher-probability execution areas Optimized for: Wskaźnikod TradingFoodie608
XAU Grid - Long IndicatorXAU Grid — Long Indicator 🔷 What it does: This is a signal-only indicator that mirrors a price-grid long workflow between two fixed bounds. It tracks up to 48 independent virtual slots between a configurable High and Low — each slot fires a webhook-ready buy signal when price crosses down through it, and a paired sell signal when price subsequently crosses up through the slot immediately above. The indicator computes a running average entry, total deployed capital, and open PnL from the live slWskaźnikod 3Commas130
XAU Grid Bot - Long StrategyXAU Grid Bot — Long Strategy 🔷 What it does: This is a long-only price-grid strategy that operates between two fixed bounds and harvests volatility through repeated round-trips on a pre-defined ladder of price levels. Each level is an independent slot: when price crosses down through a level, the strategy buys one slot; when price crosses up through the level immediately above, that slot is closed for a fixed profit. The grid is generated geometrically by default (constant percent step), so theStrategiaod 3Commas58
Yield Spread MacroYield Spread Macro — Indicator Guide What it does This indicator compares the interest rate differential between two countries against the actual FX price of their currency pair, both plotted on the same normalised scale so they can be directly compared. The core idea is that exchange rates are fundamentally driven by the difference in yields between two economies — when one country's rates are significantly higher than another's, capital tends to flow toward the higher-yielding currency, pushinWskaźnikod Wrangly11
Shift Share - 5-Model Production MatrixThe 5-Model Stock Breakdown: A Beginner Guide Imagine you are looking at a single stock—let us call it SuperEco Corp—and its price just jumped up by 10 percent over the last few weeks. If you ask a regular person why it went up, they might say, "Because it is a good stock!" But a seasoned investor knows that a stock price does not move in a vacuum. It is being pulled and pushed by different invisible forces. This guide explains how our tracking tool uses a method called Regression to break dowWskaźnikod Stephen_F14
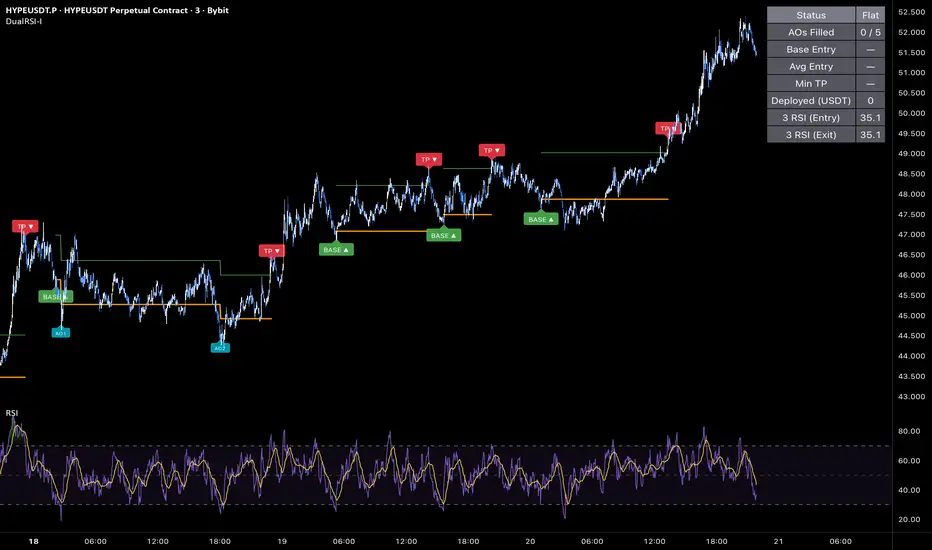
Dual RSI DCA - Long IndicatorDual RSI DCA — Long Indicator 🔷 What it does: This is a signal-only indicator that mirrors a dollar-cost averaging long workflow with a dual RSI confirmation system. It identifies oversold reversal entries on the host chart using a lower-timeframe RSI cross-up, tracks a virtual position with up to five averaging fills on a deviation ladder, and fires the exit when the lower-timeframe RSI crosses down from overbought — but only after a minimum profit threshold from the running average entry has Wskaźnikod 3Commas2451
Brewberry Funding Rate TrendWhat it shows: Histogram bars — the raw funding rate per 8-hour interval. Color-coded: bright red above 0.05%, orange above 0.03%, faded green for mild positive, blue for negative. The visual weight makes the current regime immediately obvious. Yellow line (7-day MA) — this is the important one. The course says repeatedly that a single reading means nothing — it's the trend over 3-7+ days that tells you whether the structure is fragile. This line is that trend. Purple line (21-day MA) — structurWskaźnikod Barleybrew3
NEWS [Ordinary Trader]# NEWS NEWS by Ordinary Trader marks high-impact USD economic news events on your chart — CPI, NFP, FOMC, PCE, GDP, and the rest of the red-folder calendar — both past and upcoming. Part of the Ordinary Trader family alongside **EMAs**, **FVGs**, **KEY LEVELS**, **ZONES**, and **STRATEGY (LITE / PRO)**. The methodology calls for standing aside during high-impact news; this indicator makes those events impossible to miss. ## Visuals Each event produces a **full-height vertical column** at tWskaźnikod Ordinary-TraderZaktualizowano 185
Dual RSI DCA - Long StrategyDual RSI DCA — Long Strategy 🔷 What it does: This is a long-only DCA framework that combines two independent RSI conditions on a low timeframe — one gates the base entry (oversold reversal), one arms the take-profit (overbought rotation) — with a bounded five-level averaging-order ladder for adverse price action. The structure is built for assets that move in fast oversold-overbought oscillations on intraday timeframes (mid-cap altcoins, meme-class tokens, DEX-flow pairs), where the goal is to Strategiaod 3Commas6513
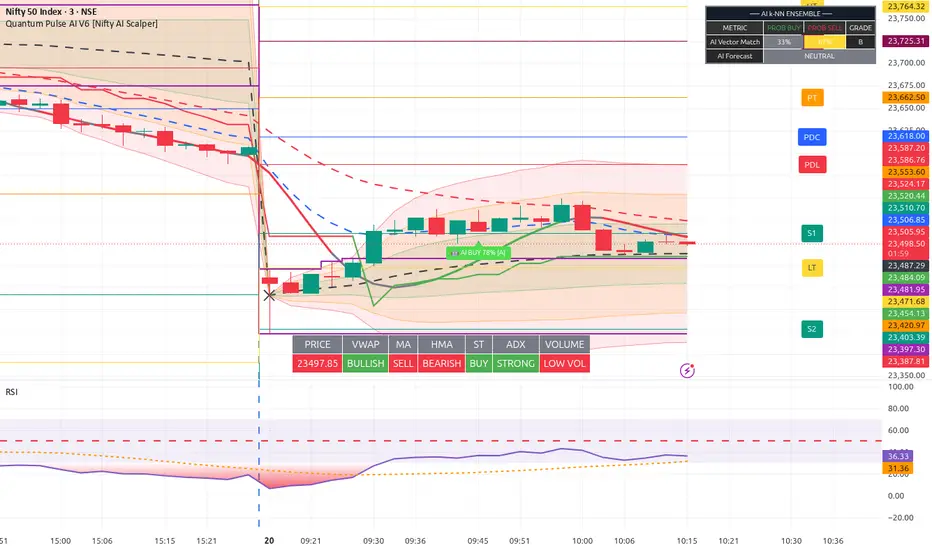
Quantum Pulse AI V6 [Nifty AI Scalper]High-Level Overview This script is a hybrid trading system that combines traditional trend-following indicators with a k-Nearest Neighbors (k-NN) Machine Learning engine. Instead of relying solely on hardcoded crossovers, it looks at the current market conditions, searches its historical memory for similar moments, and predicts the next move based on what happened in the past. 1. The Technical Foundation (Base Features) Before the AI even kicks in, the script tracks a robust baseline of instituWskaźnikod Harry_Bhullar163
Quantum Pulse AIHigh-Level Overview This script is a hybrid trading system that combines traditional trend-following indicators with a k-Nearest Neighbors (k-NN) Machine Learning engine. Instead of relying solely on hardcoded crossovers, it looks at the current market conditions, searches its historical memory for similar moments, and predicts the next move based on what happened in the past. 1. The Technical Foundation (Base Features) Before the AI even kicks in, the script tracks a robust baseline of institWskaźnikod Harry_Bhullar42
[3Commas] UNI Vault Grid - UNI - Indicator UNI Vault Grid — UNI — Indicator 🔷 What it does: This indicator is the visual + signal-only companion to the static geometric grid strategy for Uniswap (UNI/USDT). It draws all 57 grid levels on the chart, fires Buy and Sell signals on each close-cross event, tracks a virtual P&L card (simulating what the matching strategy would have done), and ships webhook alerts for routing signals to a connected grid bot. Use it when you want the grid logic running on your chart without strategy.* engine —Wskaźnikod 3Commas216
[3Commas] UNI Vault Grid - UNI/USDT UNI Vault Grid — UNI/USDT 🔷 What it does: This strategy implements a static geometric grid trading system for Uniswap (UNI), designed to capture range-bound oscillations between a configurable High and Low price boundary. It pre-computes 57 price levels using geometric spacing (≈ 0.61% step), buys at each level on close-cross-down, and sells at the next level up on close-cross-up. Unlike adaptive grid variants with trailing logic, this version stays locked to the original range — no auto-shiftStrategiaod 3Commas114
Daily/Weekly/Monthly Levels## Daily/Weekly/Monthly Levels Automatically draws horizontal levels where consecutive opposite candles meet on Daily, Weekly, and Monthly timeframes. When a bullish candle is followed by a bearish candle (or vice versa), a level is plotted at their shared close/open — the exact price where momentum reversed. ### Features - **Multi-timeframe**: Independent levels from Daily, Weekly, and Monthly candles - **Remove on touch**: Levels automatically disappear once price revisits them - **Merge neWskaźnikod Parcels_A115
[3Commas] Ether Vault Grid - Indicator Ether Vault Grid — ETH — Indicator 🔷 What it does: This indicator visualizes a static geometric grid trading system for Ethereum, designed to capture range-bound oscillations between a configurable High and Low price boundary. It pre-computes 28 price levels using geometric spacing (≈ 1.23% step), tracks a virtual deal lifecycle as price crosses through levels, and displays a live on-chart stats card with virtual P&L, drawdown, fill count, win rate, and profit factor. Unlike adaptive grid variWskaźnikod 3Commas4