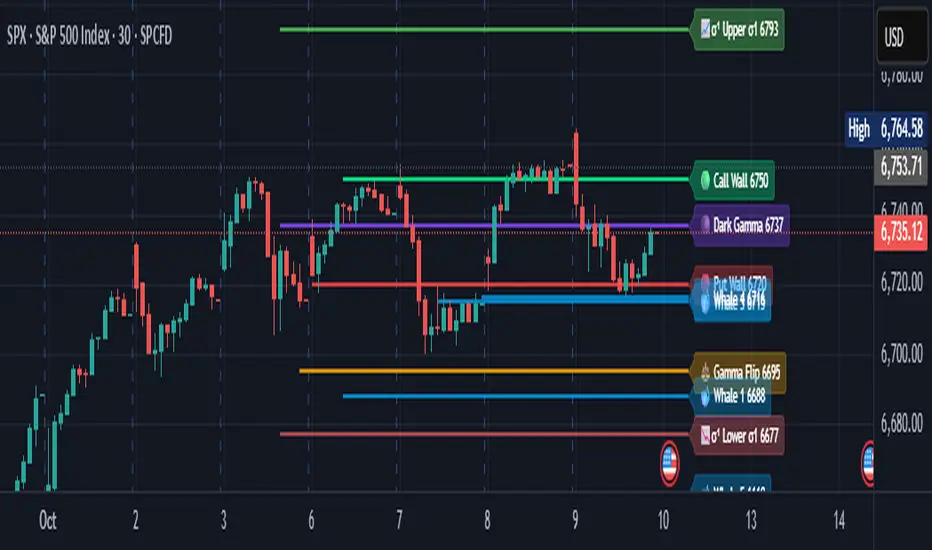
quantedOptions Levels [qO]Official quantedOptions Levels Script.
quantedOptions Levels draws options-positioning levels on any chart from one pasted line of text: the call wall and put wall, the gamma flip, the builder's call-side and put-side gamma maxima (Gamma C / P), the largest positive and negative delta-exposure strikes (DEX C / P), the five largest net-gamma strikes, a shaded zone between the walls, and the strike profile itself as a ladder on the right edge of the chart, one bar per strike sized by net gamma.
HOW TO USE
1. Copy a levels line from a quantedOptions dashboard (quantedTrader for QQQ, SPY and other tickers; quantedGamma for SPX) with "Copy for TradingView".
2. Open this indicator's settings and paste the line into "Paste from quantedOptions".
3. The levels appear with a header showing the ticker, expiry cohort, time and the price at that time. Levels are a snapshot of that moment. Paste again to refresh.
CONVERSION
On the ticker's own chart the levels are drawn as they are. On a related instrument they are rescaled live: QQQ levels on NQ, MNQ or NDX; SPY on ES, MES or SPX; SPX on ES or MES; IWM on RTY or M2K; DIA on YM or MYM; GLD on GC or MGC; SLV on SI or SIL; USO on CL, MCL or QM. Ratios are sampled only on bars where the ETF traded, so an overnight futures move does not shift the lines. Cash-index levels on their futures use the basis instead of a ratio. "Fixed ratio" lets you set your own factor; "Off" draws everything 1:1. Each label shows the level in the chart's price and the original strike.
DISPLAY
Levels that share a strike are drawn once with the names joined, so nothing overlaps. Each group of levels can be switched off. Glow, line start, ladder length and label size are adjustable. Three alert conditions are included: price crossing the call wall, the put wall and the gamma flip.
TRY IT
Paste this line to see the indicator work on a QQQ chart, or on NQ to see the conversion. It is QQQ's front expiry at 11:00 Central on 2026-09-04:
qo1|QQQ|2026-09-04|11:00|717.62|0DTE|net=291.1|cw=720|pw=718|flip=724.53|gc=720|gp=718|dc=715|dp=720|top=720,718,717,722,716|p=682:-0.6,683:-0.7,684:-1.5,685:-2.3,686:-0.8,687:-1.3,688:-1.9,689:-1.7,690:-3.8,691:-2.7,692:-2.0,693:-1.5,694:-3.0,695:-6.4,696:-2.2,697:-3.6,698:-3.6,699:-2.8,700:-20.7,701:-2.8,702:-5.3,703:-9.8,704:-5.8,705:-32.5,706:-7.9,707:-16.1,708:-29.6,709:-19.8,710:-51.3,711:-36.0,712:-35.6,712.5:-26.0,713:-58.2,714:-7.7,715:49.9,716:-135.7,717:-232.0,717.5:5.9,718:-308.2,719:45.3,720:432.7,721:88.5,722:186.0,722.5:111.9,723:36.0,724:83.5,725:126.5,726:20.3,727:19.1,727.5:7.2,728:27.4,729:6.7,730:44.2,731:11.2,732:10.9,732.5:1.5,733:3.6,734:3.3,735:40.7,736:3.4,737:2.2,737.5:0.7,738:0.8,739:2.1,740:4.5,741:4.8,742:0.5,742.5:0.5,743:0.6,744:0.5,745:1.5,746:0.5,747:0.5,748:1.4,749:0.2,750:2.7,751:1.8,752:0.2,753:0.3
NOTES
Nothing is sent anywhere. The only input is the text you paste, and the only data requested are the reference prices of the related tickers for conversion. The levels are derived from listed options open interest and Greeks. They describe where positioning sits; they are not a signal. Wskaźnik

GEX Levels - Dealer Gamma Exposure GEX DAILY LEVELS — Dealer Gamma Exposure Levels
This indicator plots dealer gamma exposure (GEX) levels as horizontal lines, computed from index option chain data and supplied via a compact text string. It is designed for NQ/NDX but works with any instrument given matching data.
█ METHODOLOGY
The levels follow the standard "naive" dealer positioning convention (dealers long calls, short puts). Per-strike net GEX = gamma × open interest × contract multiplier × spot² × 1%, summed with calls positive and puts negative.
- Call Wall / Put Wall — strikes holding the maximum positive / most negative net GEX across expiries. Dealer hedging around these strikes dampens moves toward them in positive gamma (pinning) and defines major resistance/support.
- 0DTE Walls — the same computation restricted to the current session's expiry, isolating the most reactive intraday hedging flows.
- Gamma Flip — the spot level where aggregate dealer gamma changes sign, obtained by recomputing Black-Scholes gamma across a grid of hypothetical spot prices. Above it, hedging is mean-reverting; below it, hedging amplifies moves.
- Expected Move — the at-the-money straddle price for the nearest expiry: the move the options market is pricing for the day. Fractional bands (e.g. ±50%, ±150% of the straddle) are included because the straddle approximates 0.8 standard deviations, giving each band a defined statistical meaning.
- 1D Min/Max — the one-day range implied by annualized ATM volatility (IV/√252), a complementary volatility-based estimate.
- Max Pain — the strike minimizing total option holder payout at the nearest expiry.
- G+/G− — remaining top strikes ranked by absolute net GEX.
█ WHY A TEXT STRING INPUT
Open interest is static intraday, so gamma levels are constant for the session. Injecting them as data rather than recomputing on chart makes the indicator repaint-free, lookahead-free and provider-agnostic: any gamma data source, or your own option-chain computation, can feed it.
Format: price,label,kind;price,label,kind;...
Kind codes: res, sup (walls) · res0, sup0 (0DTE walls) · flip · emh, eml (expected move) · emb (fractional bands) · ivh, ivl (1D range) · mpain · gpos, gneg
Example: 21100.0,Call Wall,res;20950.5,Gamma Flip,flip;20800.0,Put Wall,sup
█ FEATURES
- Per-family styling: visibility, color, width (1–5), line style for each level type
- Alerts on price crossing walls, 0DTE walls or the gamma flip
- Proximity table showing the nearest level above and below current price with distances
- Label size, offset and price display options
█ LIMITATIONS
Levels are a pre-session snapshot; walls do not move intraday since open interest is settled overnight. The gamma flip may legitimately be absent in strongly positive gamma regimes. Educational tool; nothing here is financial advice. Wskaźnik

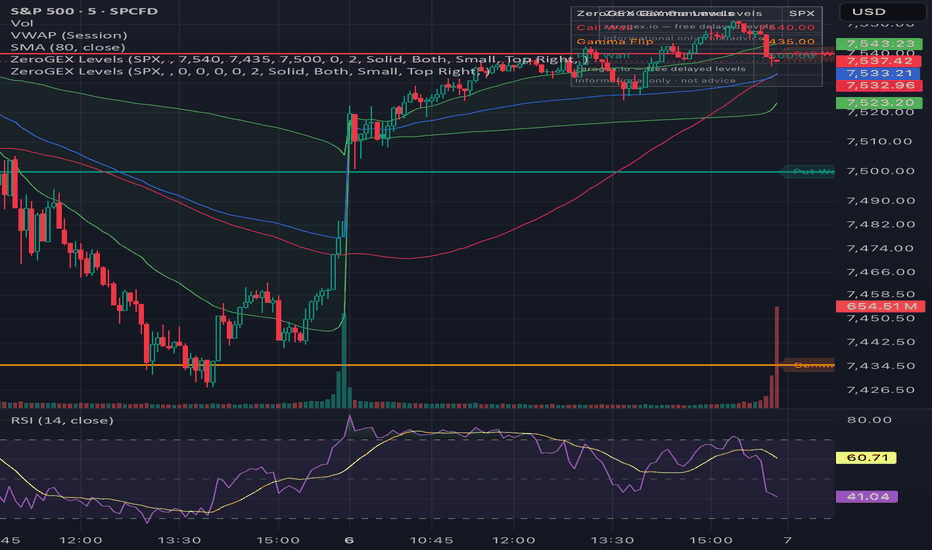
ZeroGEX Daily Gamma LevelsManually plot key options-positioning levels on your chart: Gamma Flip,
Call Wall, Put Wall, and Max Gamma / Pin.
These levels are used by SPY, SPX, and QQQ traders to identify potential
support, resistance, pinning zones, and volatility-regime shifts.
HOW TO USE
1. Add the indicator.
2. Open Settings and enter today's Gamma Flip, Call Wall, Put Wall, and
Max Gamma / Pin. Each draws as a horizontal line with a price label,
plus an on-chart info box. Set any level to 0 to hide it. Optional
price-cross alerts are included.
This script is manual-entry only — it does not pull data. Daily gamma
levels are published for free at zerogex.io.
For informational and educational purposes only. Not financial advice. Wskaźnik
Gamma Exposure (GEX) Levels - JMerc567Here's how to use it effectively:
Setting Up (Daily Pre-Market Routine)
Get your GEX data from one of these free/paid sources:
SpotGamma — best for SPX/SPY
Market Chameleon — free options data
SqueezeMetrics — DIX/GEX for SPY
Then open the indicator Settings and fill in:
Field What to enter
Gamma Flip Strike The price where dealers flip from positive to negative gamma
Call Gamma Wall Strike with the most call open interest / highest positive gamma
Put Gamma Wall Strike with the most put open interest / highest negative gamma
Levels L1–L8 Other high-OI strikes you want to watch
Reading the Dashboard
Regime (most important):
POSITIVE GEX (price above flip) → dealers are short gamma → they buy dips and sell rips → expect mean reversion, low volatility, price pinning near strikes
NEGATIVE GEX (price below flip) → dealers are long gamma → they buy drops and sell bounces acting as amplifiers → expect trending, higher volatility, larger moves
Environment label:
PINNING (low vol) — price tends to gravitate toward high-OI strikes, great for range strategies
TRENDING (high vol) — price can move fast and far, momentum strategies work better
Dist to Flip % — how far price is from the regime change level. Under 0.5% = watch closely.
Key Levels
Call Gamma Wall (green line) = strong resistance — dealers hedge by selling as price approaches
Put Gamma Wall (red line) = strong support — dealers hedge by buying as price drops here
GEX Flip (yellow dashed) = the most important level — crossing it signals a regime change
Alerts
Set these up via TradingView's Alert dialog (clock icon):
GEX Regime Change — flip cross, potential trend shift
Price Near Flip ±0.25% — watch for acceleration or reversal
Price Near Call/Put Wall — key S/R test incoming
High-Volume GEX Event — diamond marker on chart, potential unpin
Tips
Update levels daily pre-market — GEX resets on each expiration (especially 0DTE Fridays)
The GEX Proxy oscillator (in the dashboard) is volume-based — not real GEX, but useful as a directional bias confirmation
On opex weeks (monthly expiration), GEX effects are strongest Wskaźnik

Precision Price Gamma [PGamma]Here's the full updated description with all the fixes — car analogy corrected, image captions added, ready to copy:
Precision Price Gamma (PGamma) is a second-derivative momentum indicator that measures the acceleration of momentum, not momentum itself.
━━━━━━━━━━━━━━━━━━━━━━━━━━
WHY PGAMMA IS DIFFERENT
━━━━━━━━━━━━━━━━━━━━━━━━━━
Most momentum indicators tell you how strong a move is. PGamma tells you whether that strength is increasing or fading — going one step further by measuring whether momentum is strengthening or weakening. This allows PGamma to identify changes in market pressure before many trend-following indicators respond.
━━━━━━━━━━━━━━━━━━━━━━━━━━
THE FOUR STATES
━━━━━━━━━━━━━━━━━━━━━━━━━━
Γ↑ Accelerating — Bullish momentum is positive and still strengthening.
Γ⌃ Bull Weakening — Bullish momentum remains positive, but buying pressure is beginning to fade.
Γ↓ Bear Pressure — Bearish momentum is dominant and selling pressure continues to strengthen.
Γ⌄ Bear Exhaustion — Bearish momentum remains negative, but selling pressure is beginning to weaken.
━━━━━━━━━━━━━━━━━━━━━━━━━━
HOW IT WORKS
━━━━━━━━━━━━━━━━━━━━━━━━━━
PGamma smooths the source series, then computes the slope of that smoothed series — the first derivative, or Momentum. It then smooths Momentum and computes its slope — the second derivative, or Price Gamma. The four states are determined by the sign of both values simultaneously.
Momentum determines the current direction of market pressure. Gamma determines whether that pressure is strengthening or weakening. They often disagree near turning points — and those disagreements are often the most informative signals PGamma produces.
Think of it like driving a car. Momentum is your speed. Gamma is whether you are pressing the gas or the brake. You can be moving backward while pressing the brake — still moving backward, but slowing. That is negative momentum with positive gamma. In market terms, price may still be making lower lows, but each push down is losing force. That often precedes consolidation, a bounce, or a reversal.
Two examples of this disagreement are illustrated in the first two snapshots — a red candle during a green Gamma Timeline, and a green candle during an amber Gamma Timeline. The third snapshot illustrates when Momentum and Gamma align, showing a green candle with a green Gamma Timeline during Accelerating state.
━━━━━━━━━━━━━━━━━━━━━━━━━━
THE STATE MATRIX
━━━━━━━━━━━━━━━━━━━━━━━━━━
Momentum | Gamma | State
+ | + | Accelerating
+ | - | Bull Weakening
- | - | Bear Pressure
- | + | Bear Exhaustion
Momentum and Gamma often disagree near turning points. A positive Gamma reading while Momentum remains negative does not mean the market is bullish — it means bearish momentum is losing acceleration. Those disagreements are where PGamma is most useful.
━━━━━━━━━━━━━━━━━━━━━━━━━━
UNDERSTANDING THE DASHBOARD
━━━━━━━━━━━━━━━━━━━━━━━━━━
State — Combines Momentum and Price Gamma into one of the four market conditions above. Read the State row first.
Momentum — The first derivative of price. Positive = bullish momentum dominates. Negative = bearish momentum dominates.
Gamma — The second derivative of momentum. Above Zero = momentum is accelerating. Below Zero = momentum is decelerating. Gamma often changes direction before Momentum, making it useful for identifying transitions in market pressure.
Bias — A simplified interpretation combining Momentum and Gamma into a single directional context label.
━━━━━━━━━━━━━━━━━━━━━━━━━━
GAMMA TIMELINE
━━━━━━━━━━━━━━━━━━━━━━━━━━
The Gamma Timeline displays the historical sequence of Price Gamma states as a continuous color band along the bottom of the chart. Each colored segment represents one bar, allowing traders to quickly identify transitions between acceleration, weakening, pressure, and exhaustion without obscuring price action. Green for Accelerating, amber for Bull Weakening, red for Bear Pressure, sky blue for Bear Exhaustion. Toggle on or off in Display settings.
━━━━━━━━━━━━━━━━━━━━━━━━━━
GETTING STARTED
━━━━━━━━━━━━━━━━━━━━━━━━━━
1. Add PGamma to any chart. It works on all instruments and timeframes.
2. In Settings → Display, choose your panel position and size.
3. In Settings → Calculation, adjust Momentum Smoothing, Momentum Length, and Gamma Length to suit your timeframe. Default values are calibrated for intraday 1m–60m charts.
4. Read the State row first. Then use Momentum and Gamma to understand why the state is what it is.
5. Use Bias as a quick at-a-glance directional context.
6. Use the Gamma Timeline to read state history across the session at a glance.
━━━━━━━━━━━━━━━━━━━━━━━━━━
HOW TO USE IT
━━━━━━━━━━━━━━━━━━━━━━━━━━
PGamma is not a buy or sell signal. Think of PGamma as a market condition indicator rather than a trade signal. Use it as a confirmation layer alongside your existing methodology. Typical applications:
• Confirming trend continuation when State shows Accelerating.
• Identifying weakening rallies before reversals when State shows Bull Weakening.
• Recognizing building pressure before visible breakdowns when State shows Bear Pressure.
• Spotting exhaustion during extended trends when State shows Bear Exhaustion.
When used alongside a GEX level tool, price approaching a Call Wall with Γ⌃ Bull Weakening is a different setup than price approaching the same level with Γ↑ Accelerating. PGamma makes that distinction visible.
Because PGamma analyzes smoothed momentum rather than candle color, bullish candles can appear during Bear Pressure and bearish candles can appear during Bull Weakening. This reflects underlying momentum conditions rather than individual price bars — and is often an early warning of what is developing beneath the surface.
━━━━━━━━━━━━━━━━━━━━━━━━━━
WORKS WELL ALONGSIDE
━━━━━━━━━━━━━━━━━━━━━━━━━━
PGamma complements indicators that identify where important price levels exist.
• Trend indicators
• Moving averages
• Volume Profile
• VWAP
• Options Gamma Exposure (GEX)
• Support and Resistance
• Market Structure
These tools identify where price may react. PGamma helps evaluate how price is behaving as it approaches those levels.
━━━━━━━━━━━━━━━━━━━━━━━━━━
WHAT THIS TOOL IS NOT
━━━━━━━━━━━━━━━━━━━━━━━━━━
PGamma measures changes in momentum. It does not predict future prices or guarantee reversals. Use it as analytical context alongside your existing trading methodology.
━━━━━━━━━━━━━━━━━━━━━━━━━━
SETTINGS OVERVIEW
━━━━━━━━━━━━━━━━━━━━━━━━━━
Calculation: Source, Momentum Smoothing, Momentum Length, Gamma Length
Display: Show Dashboard, Panel Position (6 locations), Panel Size (Small / Normal / Large), Show Gamma Timeline Wskaźnik

Black Merton Volatility Engine [JOAT]Black Merton Volatility Engine
Introduction
Black Merton Volatility Engine blends multiple realized-volatility estimators with expected-move rails, cone rank, jump pressure, and tail-state classification.
This open-source indicator is designed as a context tool, not a standalone trading system. It focuses on explaining the current market state with restrained visuals and confirmed-bar logic where signals are used.
Core Concepts
1. Composite Realized Volatility
Close-to-close, Parkinson, Garman-Klass, Rogers-Satchell, and Yang-Zhang-style estimates contribute to the volatility state.
2. Volatility Cone
Current volatility is ranked against a historical cone to identify squeeze and shock conditions.
3. Expected Move Rails
Annualized volatility is converted into a multi-day expected move around price.
4. Tail and Jump Pressure
Large returns, rail breaches, and volatility divergence contribute to tail and jump states.
expectedMove = close * realizedVol * math.sqrt(days / 252)
Features
Composite realized volatility
Expected-move rails
Squeeze and shock regimes
Gamma pin, tail shock, clean expansion, and jump labels
Movable quant HUD
Input Parameters
Fast, base, and slow vol windows
Vol cone window
Expected move days
Squeeze and shock percentiles
Cooldown and display toggles
How to Use This Script
Use the rails as volatility context. Squeeze, shock, tail, and jump states describe volatility conditions, not a certain direction.
Limitations
The script uses historical OHLCV data and cannot know future prices.
Signals and states can be late during fast reversals because confirmed-bar logic is used to reduce repainting.
Model outputs should be interpreted with market context, risk controls, and independent analysis.
No visual state should be treated as a certain trade outcome.
Originality Statement
BMV is original in blending several volatility estimators, cone ranking, jump pressure, and expected-move visualization.
Disclaimer
This indicator is provided for educational and informational purposes only. It is not financial advice, investment advice, or a recommendation to buy or sell any financial instrument. All calculations are derived from historical market data and may produce inaccurate readings in some market conditions. No indicator can predict future market behavior. Use proper risk management and independent judgment.
-Made with passion by jackofalltrades
Wskaźnik

AlgoStorm Gamma Exposure Levels (GEX-L)AlgoStorm Gamma Exposure Levels (GEX-L)
A high-performance options market structure visualization tool designed to map total Gamma Exposure (GEX) profiles, Call Walls, Put Walls, and Gamma Flips directly onto your charts using custom-pasted external options chain inputs.
The AlgoStorm Gamma Exposure Levels (GEX-L) indicator is designed for active index and futures traders who track institutional options positioning to map structural support, resistance, and volatility inflection boundaries. It translates raw options chain metrics into actionable on-chart structural lines. By default, it supports mapping across SPX (cash index), ES/MES futures, and SPY ETF charts through localized scaling engines.
CRITICAL DATA INPUT REQUIREMENT — READ BEFORE LOADING
This indicator DOES NOT come with an automatic or built-in options data feed. It operates as a blank visualization engine. To use it, you must copy a standardized 11-value comma-separated (CSV) data string from your external options data provider and paste it manually into the "GEX Data" field inside the indicator settings. The script parses this input to draw static levels for your trading session. It will remain empty until you provide data.
Technical Architecture: Anti-Overlap Stagger Pipeline
Traditional horizontal level indicators frequently suffer from visual clutter and illegible text labels when key options strikes or walls cluster tightly together. To bypass this platform constraint, this script utilizes an advanced multi-array sorting and layout engine:
True Price Isolation: Horizontal level lines are drawn strictly at their accurate options execution strikes, extending across your historical chart data.
Permutation Sorting Pass: The execution engine takes all active inputs and dynamically sorts them from lowest price to highest price on every new market tick.
Algorithmic Staggering Array: A secondary layout pass evaluates the vertical proximity of text tags in your chart margins. If adjacent tags fall below your user-defined point-separation threshold, the text labels are mathematically shifted away from each other along the Y-axis. This ensures that every price label remains completely readable without altering the true location of the price lines.
Features & Functionality
Multi-Tiered Level Layouts: Maps primary macro anchors (Primary Call Wall CW1, Primary Put Wall PW1, and Gamma Flip) using heavy line styling, alongside up to four distinct secondary levels (CW2–CW5 and PW2–PW5) for deeper context into out-of-the-money open interest.
Intelligent Symbol Scaling Engine: Built-in auto-scaling logic bridges index options structure with retail trading instruments. When toggled to SPY mode, the script automatically scales your pasted SPX options data by dividing values by 10 to perfectly align with your ETF chart grid.
Luminance-Sensing Contrast Badges: Features customizable label styles, including a modern solid badge layout. The script calculates the relative luminance of your chosen level colors to automatically determine whether to render black or white text on top of the background badge, preventing visual washout.
Opaque Visibility Overrides: Built with an explicit alpha channel stripping mechanism. Secondary levels can be configured with dimmed, low-opacity line styles to keep your main chart clean, while their text tags remain 100% opaque and sharp inside the margin.
Dynamic Trapped Zone Fills: Renders a background color cloud across the macro zone separating the primary Call Wall and Put Wall. The background dynamically transforms its color state depending on whether the current market price is safely insulated inside the wall boundaries or breaking out into high-volatility territory.
Wskaźnik

Daily Gamma Levels Dashboard Updated (Pasteable)It is a TradingView Pine Script indicator for daily gamma and key market levels. Its purpose is to let you paste a fresh block of daily levels into the settings each day instead of editing the source code manually.
The script reads the row that matches the chart symbol, converts those pasted values into horizontal price lines across the chart, and labels the important levels so you can quickly see where call walls, put walls, zero gamma, volatility trigger, implied move levels, risk pivots, and any other custom fields sit relative to current price.
It also includes a small info table so the levels can be read numerically, and it can merge nearby labels when two levels are close together, which keeps the chart cleaner while still preserving the separate horizontal lines.
In short, it is used to create a daily, manually refreshed gamma-level dashboard on your chart so you can track market structure and important dealer-related price zones visually.
Wskaźnik

Wskaźnik

Wskaźnik

Wskaźnik

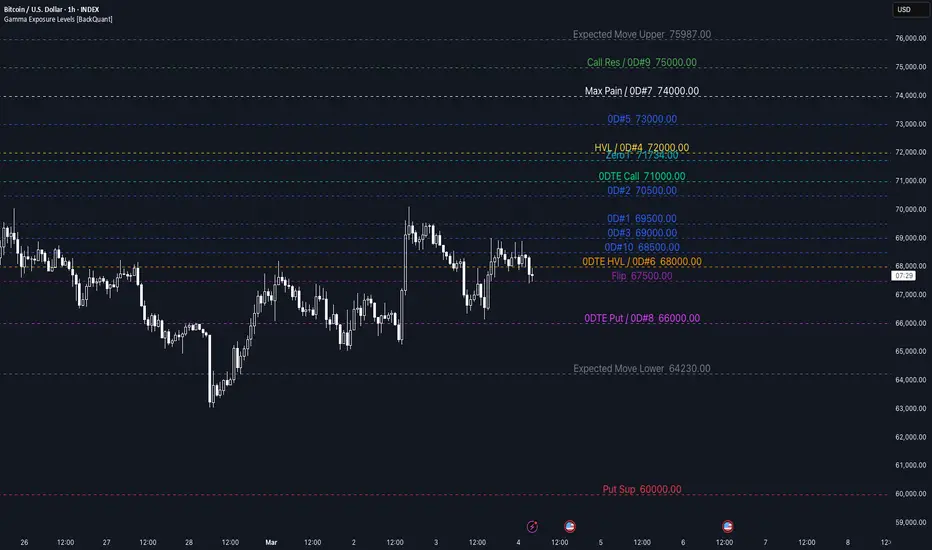
Gamma Exposure Levels [BackQuant]Gamma Exposure Levels
This indicator allows you to paste Gamma Exposure (GEX) level data directly into a text input on TradingView, automatically parsing the values and plotting them as labeled horizontal lines on your chart. It is designed for traders who use options-derived gamma exposure data as part of their technical analysis and want a fast, visual way to overlay those key price levels onto any chart and timeframe.
Rather than manually drawing lines for each level, this script reads a structured block of GEX output text, extracts every relevant dollar value, and draws color-coded, labeled levels across your chart. If two or more levels share the same price, their labels are automatically merged (for example, "Max Pain / Call Res $75,000") so the chart stays clean and readable.
What is Gamma Exposure (GEX)?
Gamma Exposure refers to the aggregate gamma held by options market makers (dealers) at each strike price. Gamma measures how much a dealer's delta (directional hedge) changes as the underlying price moves. When dealers hold large gamma positions, they must continuously hedge by buying or selling the underlying asset, which can either dampen or amplify price movement depending on the sign of that gamma.
When dealers are long gamma (positive GEX), they hedge against the prevailing trend: buying dips and selling rallies. This creates a stabilizing, mean-reverting effect around high-gamma strikes, making those levels act like magnets or support/resistance zones.
When dealers are short gamma (negative GEX), they hedge in the same direction as the move: selling into drops and buying into rallies. This amplifies volatility and can cause sharp, directional moves once a key gamma level breaks.
Understanding where these gamma levels sit gives traders a structural map of where options market makers are likely to add liquidity or accelerate a move.
How to Use This Indicator
Add the indicator to your chart.
Open the indicator settings and find the "Data Input" group at the top.
Paste your full GEX levels output into the text area. The indicator expects a structured text format (see the example format below).
The indicator will automatically parse all dollar values from the text and plot them as horizontal lines with labels.
Use the toggle checkboxes next to each level type to show or hide individual levels.
Customize colors, line style, line width, label size, label offset, and label position from the settings panel.
Expected Input Format
The indicator parses structured GEX output text. Below is an example of the expected format. Copy and paste a block like this directly into the text area input in the indicator settings:
GEX Levels - 04/03/2026, 12:17:19
All-Expiry Levels:
HVL: $72,000 +$1,841 (+2.62%)
Call Resistance: $75,000 +$4,841 (+6.90%)
Put Support: $60,000 $-10,159 (-14.48%)
0DTE Levels:
0DTE HVL: $68,000 $-2,159 (-3.08%)
0DTE Call: $71,000 +$841 (+1.20%)
0DTE Put: $66,000 $-4,159 (-5.93%)
Advanced:
Zero Gamma: $71,819 +$1,660 (+2.37%)
Max Pain: $74,000 +$3,841 (+5.47%)
Expected Move: $64,238 to $76,081
Flip Zones (All): $67,500
All-Expiry GEX Top 10 (by |gamma|):
1. $60,000 $-10,159 (-14.48%) | GEX: -20,711,741.86
2. $75,000 +$4,841 (+6.90%) | GEX: 18,876,578.2
3. $72,000 +$1,841 (+2.62%) | GEX: 17,530,960.01
4. $70,000 $-159 (-0.23%) | GEX: 17,494,795.02
5. $74,000 +$3,841 (+5.47%) | GEX: 13,573,146.08
6. $73,000 +$2,841 (+4.05%) | GEX: 10,380,107.7
7. $69,000 $-1,159 (-1.65%) | GEX: 10,341,883.98
8. $80,000 +$9,841 (+14.03%) | GEX: 8,636,674.83
9. $71,000 +$841 (+1.20%) | GEX: 7,962,084.65
10. $65,000 $-5,159 (-7.35%) | GEX: -7,257,124.01
0DTE GEX Top 10 (by |gamma|):
1. $69,500 $-659 (-0.94%) | GEX: 3,659,702.74
2. $70,500 +$341 (+0.49%) | GEX: 1,152,595.15
3. $69,000 $-1,159 (-1.65%) | GEX: 703,339.82
4. $72,000 +$1,841 (+2.62%) | GEX: 697,625.91
5. $73,000 +$2,841 (+4.05%) | GEX: 419,096.08
6. $68,000 $-2,159 (-3.08%) | GEX: 294,575.89
7. $74,000 +$3,841 (+5.47%) | GEX: 281,083.42
8. $75,000 +$4,841 (+6.90%) | GEX: 183,191.05
9. $66,000 $-4,159 (-5.93%) | GEX: -172,470.38
10. $68,500 $-1,659 (-2.37%) | GEX: 167,135.87
The indicator only extracts the dollar values from this text. The percentage changes, GEX magnitude values, and other metadata are informational context in the source data but are not plotted by this script.
Level Definitions
Below is a detailed explanation of every level this indicator can parse and plot. These are grouped the same way they appear in the indicator settings.
All-Expiry Levels
These levels are derived from gamma exposure aggregated across all option expiration dates.
HVL (High Volume Level) - The price with the highest total gamma exposure across all expirations. This is the strike where dealers hold the most aggregate gamma and therefore where hedging activity is most concentrated. Price tends to gravitate toward the HVL in positive gamma environments because dealer hedging creates a mean-reverting effect around this level. Think of it as the "center of gravity" for options-driven price action.
Call Resistance - The price level where call-side gamma creates overhead resistance. At this strike, the concentration of call gamma means that as price rises toward it, dealers who are long those calls must sell the underlying to stay delta-neutral. This selling pressure acts as a ceiling, making it harder for price to push through. Breaks above call resistance can signal a shift in positioning or the start of a gamma squeeze.
Put Support - The price level where put-side gamma creates downside support. At this strike, the concentration of put gamma means that as price falls toward it, dealers must buy the underlying to hedge. This buying pressure acts as a floor, cushioning the decline. A break below put support can accelerate selling as dealers flip from buying to selling, potentially triggering a sharp move lower.
0DTE Levels
These levels are derived exclusively from same-day (zero days to expiration) options. Because 0DTE options have extremely high gamma due to their proximity to expiration, they can dominate intraday price action even when their notional size is smaller than longer-dated positions.
0DTE HVL - The same-day high volume level. This is the intraday gamma center of gravity derived solely from options expiring today. It represents the strike where 0DTE dealer hedging is most concentrated and where intraday gamma polarity can flip. Particularly relevant for intraday traders, as 0DTE gamma effects intensify throughout the trading session and peak in the final hours before expiration.
0DTE Call - Same-day call resistance. The intraday ceiling created by 0DTE call gamma. Dealer hedging against these expiring calls creates selling pressure as price approaches this level. Because 0DTE gamma decays rapidly, this level can shift during the session and its strength increases as expiration approaches.
0DTE Put - Same-day put support. The intraday floor created by 0DTE put gamma. Dealer hedging against expiring puts creates buying pressure at this level. Like the 0DTE call level, its influence grows as the trading day progresses and gamma effects intensify near the close.
Advanced Levels
These levels provide additional structural context beyond the core support, resistance, and HVL framework.
Zero Gamma - The precise price where cumulative gamma across all strikes and expirations equals zero. This is one of the most important structural levels in gamma analysis. Above the Zero Gamma level, dealers are net long gamma and their hedging stabilizes price (buying dips, selling rallies). Below it, dealers are net short gamma and their hedging amplifies moves (selling into drops, buying into rallies). Crossing the Zero Gamma level often marks a regime change in how the market behaves, shifting from mean-reversion to trend-following dynamics.
Max Pain - The strike price at which the total value of all outstanding options (both calls and puts) would be minimized if the underlying expired at that price. In other words, it is the price where option holders collectively lose the most money. Max Pain theory suggests that there is a gravitational pull toward this level as expiration approaches, driven by dealers and market makers who benefit from options expiring worthless. It is most relevant in the final days before a major expiration.
Expected Move - The 1-sigma (one standard deviation) expected price range, plotted as two levels: Expected Move Upper and Expected Move Lower. This range represents the statistically expected boundaries of price movement based on current implied volatility. Roughly 68% of the time, price is expected to remain within this range. These levels help traders gauge whether the current price action is within normal bounds or represents an unusual move. A break beyond the expected move range can signal a volatility event or a shift in market regime.
Flip Zones - All price levels where gamma polarity changes sign. At these strikes, dealer hedging behavior transitions from stabilizing (long gamma) to destabilizing (short gamma) or vice versa. Flip zones act as transition boundaries. When price crosses a flip zone, the nature of dealer activity changes, which can lead to shifts in volatility, momentum, and the tendency for price to mean-revert or trend. Multiple flip zones in a narrow range can create a "no man's land" where positioning is mixed and price action becomes choppy.
GEX Top 10
The GEX Top 10 are the ten strike prices with the highest absolute gamma exposure, ranked by the magnitude of their gamma (|gamma|). These represent the strikes where dealer hedging activity is most significant, regardless of whether the gamma is positive (call-dominated, stabilizing) or negative (put-dominated, destabilizing).
The indicator provides a dropdown selector with five options for the GEX Top 10:
None - Do not plot any GEX Top 10 levels.
0DTE - Plot the Top 10 from same-day (0DTE) options only. Best for intraday analysis.
All Expiries - Plot the Top 10 from all expiration dates combined. Best for swing or multi-day analysis.
0DTE 1-5 - Plot only the top 5 from 0DTE options. Useful for reducing chart clutter while keeping the most significant intraday levels.
All Expiries 1-5 - Plot only the top 5 from all expiration dates. Useful for a cleaner multi-day view.
Each of the 10 GEX levels (GEX #1 through GEX #10) has its own individual toggle and color picker, so you can show or hide any specific rank and assign distinct colors to differentiate them.
Overlap Handling
It is common for multiple GEX levels to land on the same price. For example, Max Pain and Call Resistance might both be at $75,000, or a GEX Top 10 strike might coincide with the HVL. Rather than drawing overlapping lines and labels that clutter the chart, this indicator automatically detects when two or more levels share the same price (within a $0.50 tolerance). When a match is found, only one line is drawn at that price and the labels are merged with a "/" separator.
For example, if Max Pain is $75,000 and Call Resistance is also $75,000, the chart will show a single line labeled:
Max Pain / Call Res 75000
This keeps the chart clean and makes it immediately obvious when multiple structural levels converge at the same price, which often signals a particularly significant level.
Customization Options
The indicator provides extensive customization through its settings panel:
Per-Level Controls
Each level type has its own color picker and show/hide toggle on the same line.
GEX Top 10 levels (#1 through #10) each have individual color pickers and toggles.
A dropdown selector lets you choose which GEX Top 10 dataset to plot (0DTE, All Expiries, top 5 only, or none).
Line Style
Line Width: 1 to 4 pixels.
Line Style: Solid, Dashed, or Dotted.
Extend Lines: Both directions, Right only, Left only, or None.
Label Settings
Label Size: Tiny, Small, Normal, Large, or Huge.
Label Offset: Position the labels any number of bars to the right or left of the current bar (-200 to 500).
Label Side: Place labels on the Right or Left side of the chart.
Every toggle and input has a descriptive tooltip that appears on hover, explaining what the level represents and how it is used.
How the Parsing Works
The script uses Pine Script v6 string functions to scan the pasted text for known keywords (such as "HVL:", "Call Resistance:", "0DTE Call:", "Zero Gamma:", "Expected Move:", "Flip Zones:", etc.). For each keyword found, it locates the next "$" character and extracts the numeric value that follows, correctly handling both comma-separated thousands (e.g., $72,000) and decimal values (e.g., $71,819.50).
For the Expected Move, it parses both the lower and upper bounds from the "to" separator (e.g., "$64,238 to $76,081").
For Flip Zones, it scans for every "$" on the line and extracts each value, correctly distinguishing thousands-separator commas from delimiter commas between multiple zone values.
For the GEX Top 10 sections, it identifies the section header ("All-Expiry GEX Top 10" or "0DTE GEX Top 10") and parses the first dollar value from each numbered line, stopping when it hits a new section header or separator.
The indicator only draws on the last bar and uses a delete-and-redraw system to ensure that only one clean set of lines and labels exists at any time. Old drawings are removed before new ones are created on each update.
Important Notes
This indicator does not generate or calculate GEX data. It is a visualization tool that plots externally sourced gamma exposure levels onto your TradingView chart.
The indicator requires you to paste GEX data in the expected structured text format. If the text area is empty, nothing will be plotted.
GEX data is a snapshot in time. Options positioning changes throughout the trading day as new trades are opened and closed. Levels should be updated periodically for the most accurate representation of current dealer positioning.
GEX levels are not guaranteed support or resistance. They represent areas where dealer hedging activity is concentrated, which can influence price behavior but does not determine it. Always use GEX data as one component of a broader analysis framework.
Wskaźnik

Wskaźnik

Wskaźnik

Gamma Hedging Pressure Gamma Hedging Pressure (Proxy) – Market Maker Gamma Exposure Estimator
This open-source, non-overlay indicator provides a **proxy** for dealer/market-maker gamma hedging pressure using only standard OHLCV data — no options chain or implied volatility required.
Core Concept
In options markets, gamma measures how much delta changes with price movement. When dealers are **net short gamma** (negative gamma), they must hedge aggressively in the direction of the move → this amplifies trends and breakouts. When **net long gamma** (positive gamma), they hedge against the move → this creates mean-reversion and pinning behavior.
Because true gamma exposure is hidden (dealer books are private), this script estimates hedging pressure indirectly by combining:
- Volatility expansion (normalized range)
- Price acceleration (second derivative)
- Abnormal volume participation
High positive values → likely negative gamma regime (trend acceleration)
High negative values → likely positive gamma regime (reversion pressure)
Near zero → neutral/chop
Why this proxy is useful
True gamma dashboards require Level 2 options data and are often delayed or paid. This lightweight version:
- Works on any instrument with volume (stocks, futures, forex proxies, crypto)
- Updates in real time
- Helps traders anticipate whether the current move is likely to accelerate (negative gamma) or fade (positive gamma)
- Useful as a regime filter alongside support/resistance, order flow, or momentum tools
How It Works – Step by Step
1. Volatility Expansion
- Normalized range = (high - low) / ATR(14)
2. Price Acceleration
- First difference: close - close
- Second difference (acceleration): diff - diff
3. Volume Participation
- Normalized volume = volume / SMA(volume, 20)
4. Raw Pressure
- rawPressure = normalized range × acceleration × normalized volume
5. Smoothed Gamma Pressure
- gammaPressure = EMA(rawPressure, 5) // short smoothing for responsiveness
6. Optional Daily Reset
- If enabled, resets to 0 at the start of each new day (useful for intraday)
7. Regime Classification
- Negative Gamma (red): gammaPressure > +threshold (default 0.5) → trend/breakout likely
- Positive Gamma (green): gammaPressure < -threshold → mean-reversion likely
- Neutral (gray): within ±threshold → chop/consolidation
Visual Output
- Histogram: colored by regime (red = negative gamma / trend accel, green = positive gamma / reversion, gray = neutral)
- Zero line reference
- Background tint: red/green during strong regimes
- Last-bar label: "NEGATIVE GAMMA – Trend / Breakout", "POSITIVE GAMMA – Mean Reversion", or "NEUTRAL"
How to Use
- Best on intraday timeframes (5m–1h) for futures (NQ, ES, GC), indices, or high-volume stocks
- Daily/4h for swing context on liquid names
- Interpretation examples:
→ Red histogram + rising pressure → dealers likely short gamma → expect trend continuation or acceleration
→ Green histogram + falling pressure → dealers long gamma → expect fading moves, pinning near strikes, or reversion
→ Gray/neutral → low gamma pressure → range-bound or low-conviction market
- Combine with:
- Key levels (VWAP, previous highs/lows)
- Volume profile or order flow
- Options-related news (expiration days, gamma flips)
- Threshold tuning: 0.3–0.8 depending on instrument volatility (lower for crypto, higher for forex)
Inputs
- ATR Length: default 14
- Volume MA Length: default 20
- Gamma Threshold: default 0.5 (sensitivity for regime coloring)
- Reset on New Session: true = daily reset (recommended for intraday)
Publishing Recommendation
- Publish with a clean chart (e.g., 15m–1h NQ1!, ES1!, or SPY)
- Show a trending period (red histogram) and a ranging/consolidation period (green/gray)
- No extra indicators/drawings needed for basic interpretation
This is an **educational proxy** — not a direct measure of actual dealer gamma. It approximates pressure from observable market behavior. Trading involves significant risk of loss. Use discretion and proper risk management.
Feedback welcome — especially threshold or smoothing suggestions for different markets! Wskaźnik

Options Gamma Flip Zones [BackQuant]Options Gamma Flip Zones
A market-structure style “gamma flip” mapper that builds adaptive strike-like zones, scores how price interacts with them, then promotes the strongest candidates into confirmed flip zones. Designed to highlight pinning, failed breaks, and rotational behavior without needing live options chain data.
What this indicator does
This script identifies price levels that behave like “strike magnets” during conditions that resemble options pinning, then draws dynamic zones around those levels.
Instead of assuming every round number matters, it:
Creates a strike ladder (auto or manual step).
Applies a regime filter that looks for “pin-friendly” market conditions.
Tracks and scores repeated interactions with the level.
Upgrades a zone from candidate to confirmed when enough evidence accumulates.
Invalidates zones when price achieves sustained acceptance away from them.
The output is a set of shaded boxes (zones) centered on strike-like levels, with text readouts that show the current state of each zone.
Key concept: “Gamma proxy”
A true gamma flip requires options positioning data. This indicator does not use options chain gamma.
Instead, it uses a proxy approach:
When markets have elevated volatility relative to their recent baseline AND trend strength is weak, price often behaves “sticky” around key levels.
In those conditions, repeated touches and failed escapes around a level behave similarly to pinning around strikes.
So this tool is best read as:
“Where would a strike-like magnet likely exist right now, based on price behavior and regime conditions?”
How zones are created
Zones only start forming when the script detects a pin-friendly regime.
1) Strike Ladder (level selection)
Auto Strike Step selects a step size based on current price magnitude (bigger price, bigger step).
Manual Strike Step lets you force a fixed increment.
The current “active level” is the nearest rounded level to price.
Major Level Every optionally marks major ladder levels (multiples of step).
2) Band construction (zone thickness)
Each zone is a symmetric band around the level, using one of two modes:
ATR mode scales thickness with volatility.
Percent mode scales thickness as a fraction of price.
This matters because “pin behavior” is not a single tick. It’s a region where price repeatedly probes and rejects.
Regime filter (when the script is allowed to believe in pinning)
A zone is only eligible to form and strengthen when Pin Regime is active. Pin Regime is a conjunction of:
1) IV proxy (ATR z-score)
Uses ATR as a volatility proxy.
Converts ATR% into a z-score relative to a long lookback.
IV Proxy Threshold controls how elevated volatility must be before the script considers pinning likely.
2) Weak trend requirement
The script also requires price action to be non-trending:
EMA spread must be small (fast vs slow EMA not diverging strongly).
ADX must be below a ceiling, confirming weak directional trend strength.
Interpretation:
High “IV proxy” + weak trend is where pin-like behavior is most common.
If trend is strong, zones are less meaningful because price is more likely to accept away from levels.
Flip confirmation logic (what upgrades a zone)
A zone is not “confirmed” just because price is near it once. The script builds conviction via evidence accumulation.
Evidence types:
Touches : price comes close to the level within tolerance.
Failed escapes : price pushes outside the band but closes back inside (rejection).
Acceptance run : consecutive closes outside the band, suggesting price is accepting away from the zone.
Protections:
Touch Cooldown prevents counting the same micro-chop as multiple touches.
Acceptance Bars defines what “real acceptance” means, so the zone does not get invalidated by one noisy bar.
A zone becomes confirmed when:
Touches meet the “evidence” requirement.
Failed escapes meet the “rejection” requirement.
The regime filter still says the market is pin-friendly.
That is important, it avoids promoting levels that only worked briefly in a trending tape.
Zone scoring and lifecycle
Each zone maintains a score that evolves over time. Think of score as “how much this level has recently behaved like a magnet.”
Score dynamics:
Decay per bar : score fades over time if price stops respecting the zone.
+ per touch : repeated proximity increases score.
+ per failed escape : rejections add stronger reinforcement.
- per acceptance bar : sustained trading outside reduces score.
Min score to draw : prevents clutter from weak, low-confidence zones.
Invalidation:
If the score becomes very weak AND price achieves sustained acceptance away from the zone, the zone is deleted.
This keeps the chart clean and ensures zones represent current market behavior, not ancient levels.
How to read the plot on chart
1) Zone fill and border
Each zone is drawn as a box extended to the right.
Fill opacity adapts to zone strength, strong zones are visually more prominent.
Border color encodes the current directional context and special events.
2) Bullish vs bearish coloring
A zone is colored bullish when price is currently trading above the zone’s mid-level.
A zone is colored bearish when price is currently trading below it.
This is not a trade signal by itself, it is a state cue for “which side is in control around the level.”
3) Failed escape highlighting
If price attempts to break above the band and fails, the border temporarily highlights as a failed up escape.
If price attempts to break below the band and fails, the border temporarily highlights as a failed down escape.
These are the moments where pin behavior is most visible:
Break attempt.
Immediate rejection.
Return to the band.
4) Midline (optional)
The zone midline is the strike-like level itself.
It is dotted to distinguish it from price structure lines.
5) Optional strike ladder overlay
When enabled, the script draws major and minor ladder lines near current price.
Major levels are thicker and less transparent.
This is a visualization aid for “where the algorithm is rounding,” not a prediction tool.
On-chart text readout (what the box text means)
Each box prints a compact state summary, designed for fast scanning:
Γ CANDIDATE means the zone is being tracked but not yet validated.
Γ FLIP (PROXY) means the zone has met confirmation requirements.
BULL/BEAR indicates which side price is on relative to the mid-level.
L prints the level value.
T is touch count, repeated proximity events.
F is fail count, rejected escape attempts.
IVz is the volatility proxy z-score at the moment.
ADX is the trend strength context.
Practical use cases
1) Pinning and range trading context
Confirmed zones often act like gravity wells in sideways or rotational regimes.
When price repeatedly fails to escape, fading outer edges can be reasonable context for mean reversion workflows.
2) Breakout validation
If price achieves acceptance outside the band for multiple bars, that is stronger breakout context than a single wick.
Zones that invalidate cleanly can mark transitions from pinning to directional move.
3) Time your “do nothing” periods
When Pin Regime is active and a zone is confirmed, the tape often becomes sticky and inefficient for trend chasing.
This helps avoid taking trend entries into a pin environment.
Alerts
Standalone alertconditions are included:
Zone Confirmed : a candidate becomes confirmed.
Zone Touch : price touches an active zone within tolerance.
Zone Invalidated : the zone loses relevance and is removed.
Tuning guidelines
Sensitivity vs quality
Lower Touches Needed and Failed Escapes Needed creates more zones faster, but with lower quality.
Higher values create fewer zones, but the ones that remain are more behaviorally “proven.”
Band width
ATR mode adapts to volatility and is typically safer across assets.
Percent mode is consistent visually but can feel too tight in high vol or too wide in low vol if not tuned.
Regime thresholds
If you want fewer zones, raise IV proxy threshold and tighten weak-trend filters.
If you want more zones, lower IV proxy threshold and loosen weak-trend filters.
Limitations
This is a proxy model, not live options gamma.
In strong trends, pinning assumptions can break, the regime filter is there to reduce that risk, but not eliminate it.
Auto strike step is designed for typical market ranges, manual step is recommended for niche tick sizes or custom markets.
Disclaimer
Educational and informational only, not financial advice.
Not a complete trading system.
Always validate settings per asset and timeframe.
Wskaźnik

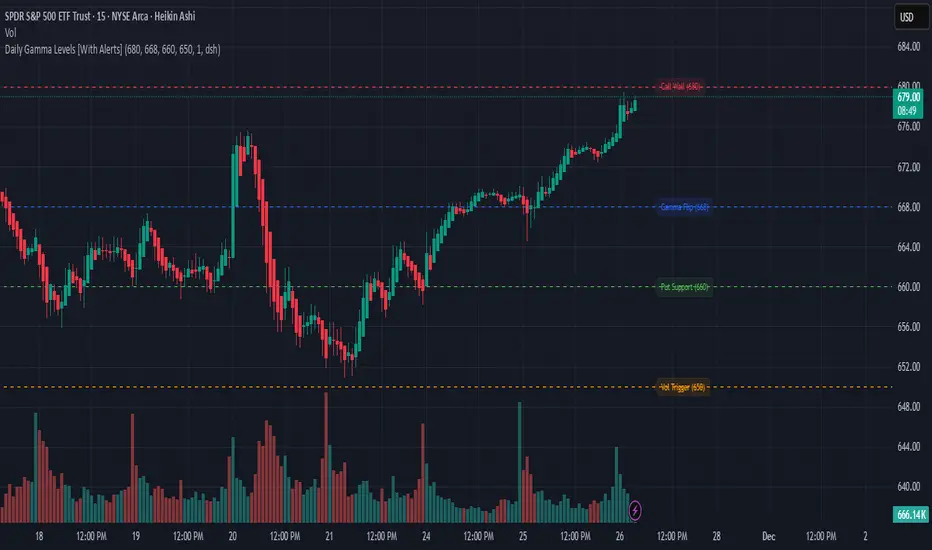
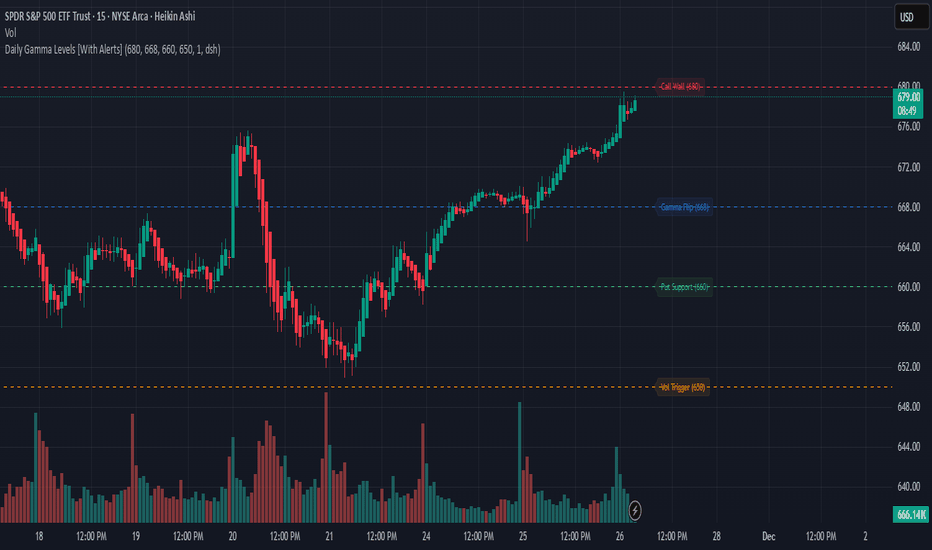
SPY Daily Gamma Levels [Manual Input With Alerts]Overview This indicator plots key options-based support and resistance levels (Gamma Exposure / GEX) directly on your chart. Unlike standard technical analysis, these levels (Call Wall, Gamma Flip, Put Support, and Volatility Trigger) represent where Market Makers are positioned, often acting as "magnets" or "repellents" for price action.
Important Note: TradingView Pine Script cannot currently access external options open interest data natively. Therefore, this is a Manual Input Indicator. You must update the four price levels in the settings each morning before the market opens.
Key Features:
4 Key Levels: Plots the Call Wall, Gamma Flip (Zero Gamma), Put Support, and Volatility Trigger.
Auto-Cleaning: Automatically deletes yesterday's lines to keep your chart clean; lines only show for the current session.
Alerts Included: Built-in alert conditions allow you to set notifications when price crosses the Gamma Flip or breaks the Vol Trigger.
Customization: Fully customizable colors and line styles.
Best Practices:
Timeframe: Works best on 15-minute charts for trend identification and 5-minute charts for entry execution.
Strategy:
Above Gamma Flip: Market generally stabilizes; dealers buy dips.
Below Gamma Flip: Volatility expands; dealers sell rips.
Below Vol Trigger: "Danger Zone" – expect accelerated selling pressure.
How to Get the Data (The AI Workflow)
Since these numbers change daily, I use Google Gemini to fetch the data and remind me every morning. Here is how you can set up the same automated workflow:
1. The Prompt You can ask Gemini (or your preferred AI) the following prompt manually each morning:
"Find the daily SPY Call Wall, Gamma Flip, Put Support, and Vol Trigger levels for today to input into my TradingView indicator."
2. Automating the Routine I have set up a scheduled daily reminder with Gemini. To do this yourself, simply ask Gemini:
"Can you schedule a daily task to search for these SPY Gamma levels and send them to me every morning at 8:00 AM?"
3. Updating the Chart
Receive the notification from the AI.
Open the Indicator Settings in TradingView.
Type in the new numbers.
The chart updates instantly.
Disclaimer: This tool is for educational purposes only. Gamma levels are estimates based on Open Interest and Dealer Gamma exposure models. Always manage your risk. Wskaźnik
Wskaźnik

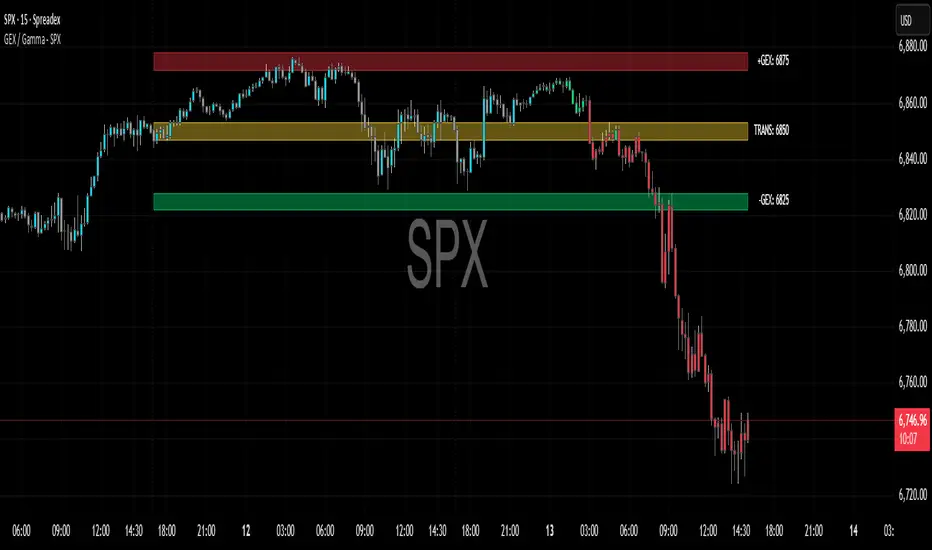
GEX / Gamma - SPX Indicator Description – GEX / Gamma (SPX)
This indicator allows you to manually plot your daily +GEX, TRANS-GEX, and –GEX levels on SPX and visualize how price reacts around key gamma zones.
You enter the three levels each morning, and the script automatically draws:
+GEX / TRANS / –GEX zones with an adjustable buffer
Clean labels (e.g., “+GEX: 6850”) pinned to the right side of the chart
Today-only candle coloring (green above TRANS-GEX, red below)
Zones extend from yesterday’s session through the current session, helping highlight areas where dealer hedging flows may influence volatility, compression, or acceleration.
How to Use
Add the indicator to any intraday SPX chart.
Open settings and enter your +GEX, TRANS-GEX, and –GEX levels for the day.
Adjust the buffer, colors, and label style as needed.
Watch how price behaves as it moves above or below TRANS-GEX and interacts with +/- GEX zones.
Best For
Intraday SPX / ES / SPY
Options traders
Volatility and gamma-aware strategies
Strategy Behind It (Tight Version)
GEX levels help identify where dealer hedging flows can influence SPX price behavior.
+GEX (Positive Gamma)
Market tends to stabilize here. Dealers hedge against price moves, creating mean-reversion and lower volatility.
TRANS-GEX (Transition Level)
Key pivot where gamma flips. Price crossing this level often signals a shift in volatility or intraday direction.
–GEX (Negative Gamma)
Market becomes more reactive. Dealers hedge with price, increasing volatility, momentum, and trend potential.
How traders use it:
Expect resistance or slowdown into +GEX
Watch for potential bottoming or increased volatility –GEX
Use TRANS-GEX as a bias line or trigger for intraday shifts
A move outside of either the +GEX or -GEX will likely result in some type of high volume move. Wskaźnik

Options levelsOverview
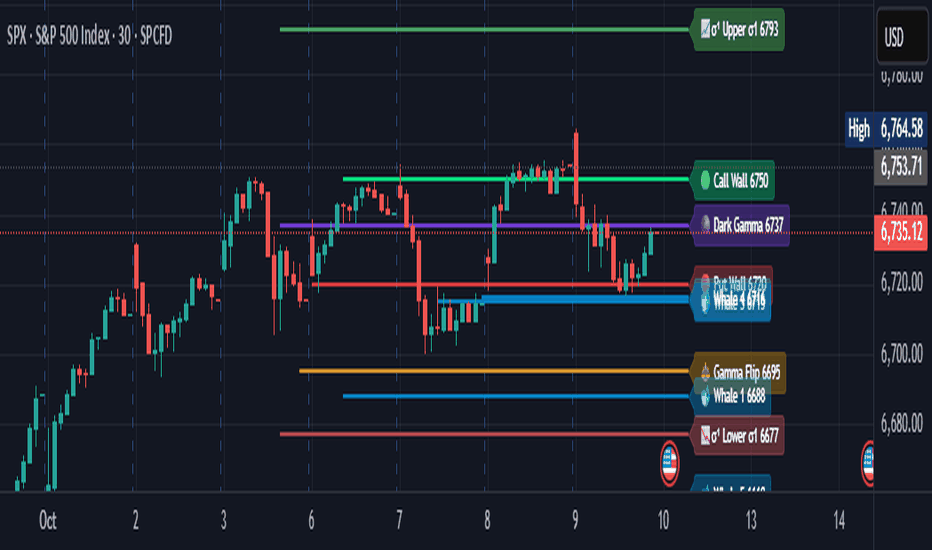
Options Levels 🎯 plots 13 key institutional and options-based levels directly on your chart — including Call Wall, Put Wall, Gamma Flip, Whales Pivot, five Whale levels, and Sigma deviation bands (σ¹ / σ²).
It’s designed for both intraday and swing traders, offering a clean visual structure with elegant emoji labels, flexible visibility controls, and precise right-edge extensions for each line.
✨ Key Features
Single structured input with 13 ordered levels:
CallWall, PutWall, GammaFlip, Whales Pivot, Whale1..Whale5, Upperσ1, Upperσ2, Lowerσ1, Lowerσ2
Expressive emoji labels (🟢, 🔴, ⚖️, 🌑, 🐋, σ¹/σ²) optimized for dark themes.
Right-edge alignment: each line extends exactly to its label — no infinite lines.
Group visibility toggles:
• Critical Levels → Call Wall, Put Wall, Gamma Flip, Whales Pivot
• Whale Levels → Whale 1–5
• Sigma Bands → Upper/Lower σ¹ and σ²
Dynamic line-length multipliers that emphasize key levels.
Built-in alert conditions:
• Price crossing above the Call Wall
• Price crossing below the Put Wall
⚙️ Inputs & Settings
📋 Level List (string) : comma-separated list of 13 numeric values.
Example:
🎨 Appearance
• Base line length (bars)
• Label visibility toggle
• Line thickness
• Extend line and label to the right
• Distance (bars) between last candle and label
👁️ Visibility Controls
• Toggle Critical, Whale, or Sigma levels independently
🚀 How to Use
Paste your list of 13 ordered levels into the input field.
Adjust base length and thickness according to your timeframe.
Enable “Extend to the right” to position labels neatly beyond the last candle.
Use visibility toggles to focus on specific level groups (e.g., hide Whale Levels for short-term setups).
Optionally enable alerts to track price breakouts above/below Call and Put Walls.
The plotted levels are derived from aggregated options flow data, institutional positioning, and volatility-based deviations (σ). They serve as reference zones rather than predictive signals, helping visualize where liquidity and dealer hedging pressure may cluster.
📖 Level Definitions
Call Wall 🟢 — The strike with the highest call open interest; potential resistance area.
Put Wall 🔴 — The strike with the highest put open interest; potential support area.
Gamma Flip ⚖️ — Level where total gamma exposure changes sign; may reflect a shift in dealer hedging behavior.
Whales Pivot 🌑 — Represents the average institutional positioning from the previous trading day, reflecting where large option flows were most concentrated.
Whale Levels 🐋 — High-premium or large-volume strikes typically linked to institutional activity.
Upper σ¹ / σ² 📈 — One and two standard deviations above spot; potential overextension zones.
Lower σ¹ / σ² 📉 — One and two standard deviations below spot; potential mean-reversion zones.
Levels are manually input by the user. This script is a visual reference, not a predictive model.
⚠️ Notes
Levels are user-provided (not calculated by this script).
The indicator does not issue buy/sell signals or provide performance guarantees.
Designed purely as a visual aid for contextual market reference.
Optimized with barstate.islast for performance (draws only at the latest bar).
Disclaimer:
This indicator is for educational and visual purposes only. It does not generate buy/sell signals or guarantee future results. User-provided levels are meant for contextual reference only.
Developed for traders who rely on market structure and options flow context. Feedback and suggestions are welcome.
Wskaźnik
Wskaźnik

MathSpecialFunctionsGammaLibrary "MathSpecialFunctionsGamma"
Gamma Functions.
GammaQ(index) Enumeration of the polynomial coefficients for the "GammaLn" approximation.
Parameters:
index : int, 0 => index => 10, index of coeficient.
Returns: float
GammaLn(z) Computes the logarithm of the Gamma function.
Parameters:
z : The argument of the gamma function.
Returns: The logarithm of the gamma function.
Gamma(z) Computes the Gamma function.
Parameters:
z : The argument of the gamma function.
Returns: float, The logarithm of the gamma function.
GammaLowerRegularized(a, x)
Parameters:
a : float, The argument for the gamma function.
x : float, The upper integral limit.
Returns: float, The lower incomplete gamma function.
GammaUpperRegularized(a, x) Returns the upper incomplete regularized gamma function
Parameters:
a : float, The argument for the gamma function.
x : float, The lower integral limit.
Returns: float, The upper incomplete regularized gamma function.
GammaUpperIncomplete(a, x) Returns the upper incomplete gamma function.
Parameters:
a : float, The argument for the gamma function.
x : float, The lower integral limit.
Returns: float, The upper incomplete gamma function.
GammaLowerIncomplete(a, x)
Parameters:
a : float, The argument for the gamma function.
x : float, The upper integral limit.
Returns: float, The lower incomplete gamma function. Biblioteka

Wskaźnik