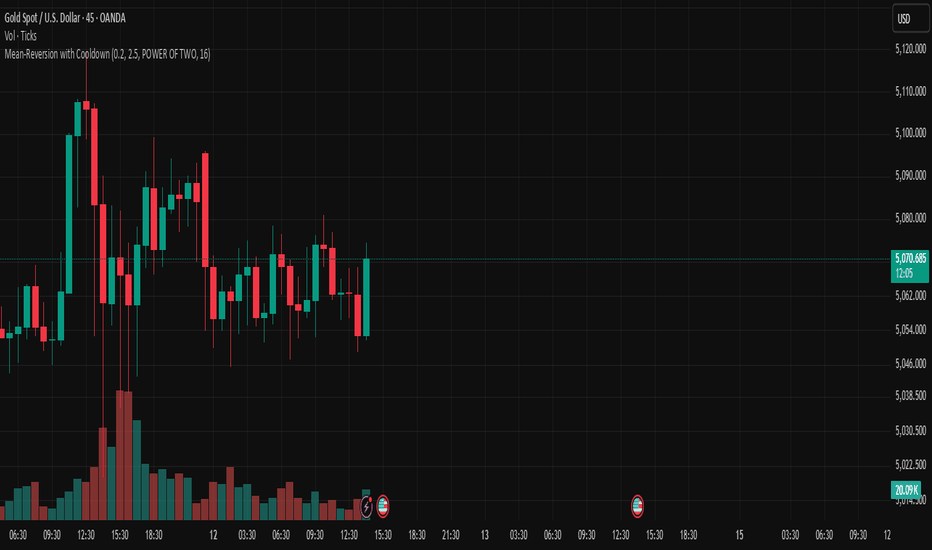
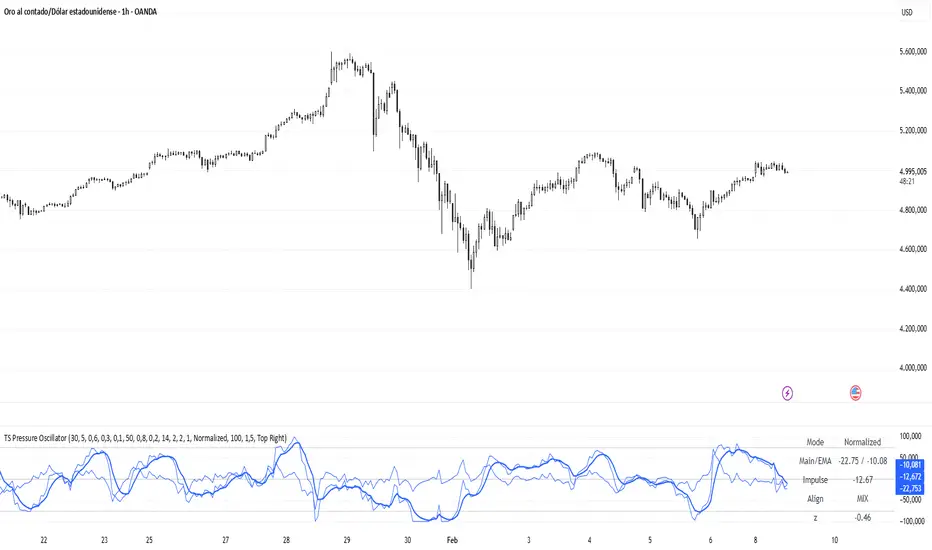
TS Pressure OscillatorThis indicator is a TS Pressure Oscillator. Its job is to turn a lot of small “TS events” (liquidity sweeps + rejection) into a single, easy-to-read curve that helps you spot short-term exhaustion and possible trend shifts.
What it detects (TS events)
A “TS” here means a candle that:
briefly breaks the previous candle’s high and then closes back below it (bearish rejection), or
briefly breaks the previous candle’s low and then closes back above it (bullish rejection).
In simple words: price tried to continue, failed, and got rejected.
What the oscillator measures
Instead of counting every TS equally, this version gives each event a score based on its quality:
Wick size vs ATR (how meaningful the sweep was)
Body size vs ATR (how strong the rejection candle was)
Then it filters events by context:
bearish TS only matter most near the top of a recent range
bullish TS only matter most near the bottom of a recent range
After that, it combines multiple timeframes (M15 / M5 / M1) into one curve:
If bearish TS pressure dominates, the oscillator tends to move up (more rejection from above).
If bullish TS pressure dominates, the oscillator tends to move down (more rejection from below).
Why there are two lines (Main vs EMA)
Main line shows the current pressure.
EMA line is the smoothed version (the “trend” of the pressure).
The gap between them is useful: when the Main line pulls away from the EMA, it often means pressure is accelerating.
The most important part: parameters
This indicator is only as good as its tuning. The key settings control what it considers “relevant” TS events:
Zone lookback (HH/LL): defines what “top” and “bottom” mean
Zone thresholds (zoneHi / zoneLo): how strict the “extreme area” filter is
Window lengths per timeframe: how much history you’re measuring
ATR length + caps: how sensitive the scoring is
Baseline: prevents the oscillator from sticking at extremes
If your parameters are too loose, you’ll get noise.
If they’re too strict, you’ll miss opportunities.
Dialing them in for each asset/session is the difference between a “nice curve” and a useful signal.
If you want, tell me the asset (e.g., XAUUSD) and your main chart timeframe, and I’ll suggest a solid starting preset for the parameters. Wskaźnik

Wskaźnik

Wskaźnik

Strategia

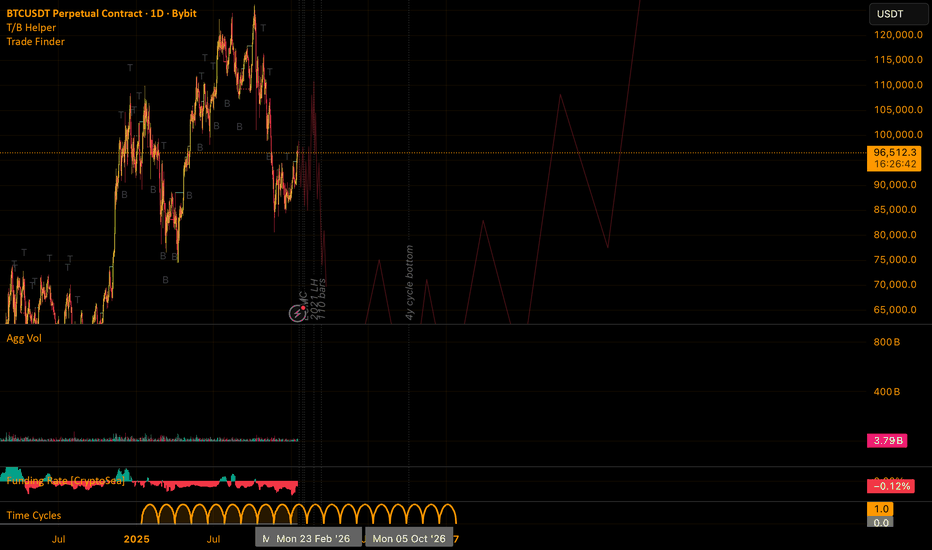
Time Cycles# Time Cycles Indicator
**Time Cycles Indicator** is a time-based visualization tool designed to map repeating market rhythms as smooth arches in a separate pane.
Rather than reacting to price, the script focuses purely on **time cycles**, helping you visualize potential **liquidity flow, expansion, and contraction phases** across the chart.
---
## 🔁 What This Indicator Does
- Translates a user-defined **time cycle (in days)** into repeating **semi-circular arches**
- Anchors cycles to a **fixed start date**
- Displays cycles in a **clean, price-independent pane**
- **Projects cycles forward into the future** (e.g. 6 months) so you can anticipate upcoming time windows
- Designed to complement **structure, liquidity, and narrative-based analysis**
---
## 🧠 How It Works
Each cycle is mathematically modeled as a **semicircle**:
- Start of cycle → low energy
- Mid-cycle → peak / expansion
- End of cycle → decay / reset
This produces a smooth “arch” that visually represents **temporal momentum**, independent of market volatility.
---
## ⚙️ Key Settings
### Cycle Settings
- **Start Date (UTC)** – Anchor point for all cycles
- **Period (Days)** – Length of each cycle (supports decimals)
- **Phase Shift (Days)** – Slide cycles forward or backward in time
- **Plot Only After Start Date** – Ignore cycles before the anchor
### Visual Controls
- **Amplitude** – Vertical scale of the arches
- **Baseline** – Vertical offset for positioning
- **Invert** – Flip arches into valleys
- **Baseline Guide** – Optional reference line
- **Shaded Fill** – Visual emphasis of cycle energy
### Forward Projection
- **Project Forward** – Enable future cycle rendering
- **Forward Distance (Days)** – How far into the future to extend (default ≈ 6 months)
- **Step Size (Days)** – Smoothness vs performance control
---
## 📈 How to Use It
- Pair with **market structure**, **VWAP**, **HTF levels**, or **liquidation maps**
- Watch for **confluence** between cycle peaks/troughs and price events
- Use forward projections to anticipate **time-based inflection zones**
- Works across all markets and timeframes
---
## ⚠️ Important Notes
- This is **not a price predictor**
- Cycles represent **time windows**, not directional bias
- Best used as a **contextual overlay**, not a standalone signal
---
## 🧩 Ideal For
- Liquidity & narrative traders
- Time-cycle analysts
- Macro rhythm mapping
- Traders who believe *“time reveals structure before price does”*
---
*Time does not repeat — but it often rhymes.*
Wskaźnik
Hyperfork Matrix🔱 Hyperfork Matrix 🔱 A manual Andrews Pitchfork tool with action/reaction propagation lines and lattice matrix functionality. This indicator extends Dr. Alan Andrews' and Patrick Mikula's median line methodology by automating the projection of reaction and action lines at equidistant intervals, creating a time-price grid that highlights where pivot levels intersect the matrix.
Three pitchfork variants are supported: Original, Schiff, and Modified Schiff. Each variant adjusts the anchor point position to accommodate different trend angles.
═══════════════════════════════════════════════════════════════
█ THE METHOD
Andrews Pitchfork
Dr. Alan Andrews developed the pitchfork as a trend channel tool. The core principle: price tends to return to the median line roughly 80% of the time. When it fails to reach the median, a reversal may be developing.
A pitchfork requires three pivot points:
• Point A — The anchor (starting pivot)
• Point B — First swing in the opposite direction
• Point C — Second swing, same direction as A
The median line runs from Point A through the midpoint of B-C. Parallel lines through B and C form the channel boundaries.
Action/Reaction Principle
Based on Newton's third law ("action and reaction are equal and opposite"), this principle suggests that price movements elicit proportional reactions in the future. By projecting lines at equal intervals along the pitchfork's slope, we anticipate where these reactions may occur.
Lattice Matrix
The lattice squares pivot price levels to the matrix structure. A horizontal from your selected pivot intersects the pitchfork and propagation lines, with verticals drawn at each intersection. These verticals mark time points where price-time geometry converges—potential areas to watch for trend changes.
═══════════════════════════════════════════════════════════════
█ HOW THE INDICATOR WORKS
This section explains the calculation flow from your inputs to the final drawing.
Step 1 — Pivot Selection
You click on the chart to select three timestamps. The indicator retrieves the high or low price at each timestamp based on your starting pivot type selection:
• Starting with "Low" creates a Low-High-Low pattern
• Starting with "High" creates a High-Low-High pattern
Step 2 — Anchor Calculation
The anchor position depends on your pitchfork variant:
• Original — Anchor stays at Point A
• Schiff — Anchor shifts 50% toward B in price (Y-axis only)
• Modified Schiff — Anchor shifts 50% toward B in both time and price
Step 3 — Median Line
A line is drawn from the anchor through the midpoint of the B-C segment. This median line defines the channel's slope and center.
Step 4 — Parallel Tines
Parallel lines are drawn through Points B and C, maintaining the median line's slope. These form the upper and lower channel boundaries.
Step 5 — Extra Parallels
If configured, additional parallel lines are drawn at equal spacing beyond B and C. The spacing equals the distance from the median to each tine.
Step 6 — Handle Length
The "handle" is the segment from the anchor to the B-C midpoint. This length becomes the unit of measurement for propagation.
Step 7 — Propagation Points
Points are placed along the median line at handle-length intervals:
• Forward points extend into the future
• Backward points extend into the past
Step 8 — Reaction Lines
Through each propagation point, a line is drawn parallel to B-C (the transversal slope). These reaction lines mark time-price zones based on the original swing rhythm, where trend changes may occur.
Step 9 — Action Lines
Through each propagation point, a line is drawn parallel to A-B (the initial move slope). These action lines project the original momentum into future price zones.
Step 10 — Lattice Grid
If enabled, a horizontal line is drawn at the price level of your selected pivot. Vertical lines are then drawn at every intersection between this horizontal and the selected line type (pitchfork, reaction, or action lines).
Step 11 — Alert Monitoring
On each bar, the indicator checks if the price has crossed any of the drawn lines. Crossings trigger alerts based on your configuration.
═══════════════════════════════════════════════════════════════
█ PITCHFORK VARIANTS
Original (Andrews)
The classic pitchfork. The anchor remains at Point A. Best suited for strong trending markets where price respects steep channels.
Schiff
Named after Jerome Schiff, a student of Andrews. The anchor shifts halfway toward Point B in price only—same time position as A, but price is the midpoint of A and B.
This produces a less steep channel, better suited for:
• Shallow trends
• Corrective phases
• Markets where the original pitchfork angle is too aggressive
Modified Schiff
The anchor shifts halfway toward Point B in both time and price—positioned at the midpoint of the A-B segment.
This creates an even gentler slope than the standard Schiff variant. Use when:
• Trends are weak or ranging
• Price doesn't respect steeper channel angles
• You need a middle ground between Original and Schiff
═══════════════════════════════════════════════════════════════
█ ACTION & REACTION LINES
Reaction Lines
These run parallel to the B-C segment (the "transversal"). They represent the market's response rhythm—the swing from B to C sets a pattern that may repeat at predictable intervals.
Action Lines
These run parallel to the A-B segment (the initial impulse). They project the original momentum forward, suggesting where similar price movements may begin or end.
Forward vs Backward
• Forward Lines — Project into the future beyond the B-C midpoint
• Backward Lines — Project into the past before Point A
Most analysis focuses on forward lines, but backward lines can reveal historical confluence with past pivots.
Propagation Spacing
Lines are spaced at equal intervals defined by the handle length (anchor to B-C midpoint). This creates a rhythmic structure where each segment equals the original pitchfork's core measurement.
Action Lines
Reaction Lines
Extra Parallels with/ both Action & Reactions Line extended within the grid
═══════════════════════════════════════════════════════════════
█ LATTICE MATRIX
The lattice creates a grid overlay within the pitchfork structure.
Horizontal Line
A horizontal line is drawn at the price level of your selected pivot (A, B, or C). This squares the pivot's price level to find where it aligns with the matrix structure. These confluences may represent higher-probability reaction points in time.
Vertical Lines
Vertical lines are drawn at every point where the horizontal intersects your selected line source. These verticals mark time points—potential areas to watch for trend changes.
• Pitchfork & Parallels — Intersections with median and all parallel tines
• Action Lines — Intersections with action transversals
• Reaction Lines — Intersections with reaction transversals
• Action & Reaction — Both types combined
Envelope Clamping
Lattice lines are automatically clamped to stay within the pitchfork's channel envelope (bounded by the outermost parallels). This keeps the grid visually clean and focused on relevant areas.
═══════════════════════════════════════════════════════════════
█ ALERTS
The indicator monitors price crossings and triggers alerts when the price moves through any drawn line type.
Available Alert Types
• Pitchfork Lines — Crossing the median or any parallel
• Action Lines — Crossing any action transversal (when action lines are drawn)
• Reaction Lines — Crossing any reaction transversal (when reaction lines are drawn)
• Lattice Horizontal — Crossing the horizontal price level (when lattice is enabled)
• Any Line Crossing — Combined alert for all of the above
Setting Up Alerts
1. Right-click on the indicator or use the alert menu
2. Select "Create Alert."
3. Choose the desired condition from the dropdown
4. Configure notification preferences (pop-up, email, webhook, etc.)
Alert Timing
Alerts trigger once per bar close when a crossing is detected between the previous and current bar's close prices.
═══════════════════════════════════════════════════════════════
█ HOW TO USE
Basic Setup
1. Add the indicator to your chart
2. When prompted, click on three pivot points in sequence: A, B, C
3. Choose starting pivot type: Auto (detects pattern), Low (LHL), or High (HLH)
4. The pitchfork draws automatically
Adjusting the Pitchfork
• Change the variant (Original/Schiff/Modified Schiff) if the angle doesn't suit your trend
• Add extra parallel levels to see where price might react beyond the main channel
• Disable or Adjust price range min/max to hide parallels outside your focus area
Adding Propagation Lines
• Adjust forward offset to add/remove lines beyond auto-extend (0 = to current bar)
• Choose which line types to display: Reaction Only, Action Only, or Both
• Customize colors to distinguish line types visually
Using the Lattice
• Enable "Draw Lattice" in the Lattice settings group
• Select which pivot's price level to use for the horizontal
• Choose the intersection source that matches your analysis style
• Look for time zones where verticals cluster—these may be significant dates
Log Scale Charts
If your chart uses logarithmic scale, enable "Logarithmic Scale" in Pitchfork Settings. This ensures all calculations transform correctly for log price axes.
═══════════════════════════════════════════════════════════════
█ SETTINGS REFERENCE
1. Pivot Points
• Starting Pivot Type — Auto (detect pattern), Low (force LHL), or High (force HLH)
• Pivot A/B/C Time — Timestamps for your three pivots (click to select)
• Show Pivot Labels — Display A, B, C labels at pivot locations
• Pivot Colors — Customize high/low label colors
• Label Size — Tiny, Small, Normal, or Large
2. Pitchfork Settings
• Logarithmic Scale — Enable for log charts
• Pitchfork Type — Original, Schiff, or Modified Schiff
• Extra Parallel Levels — Additional parallels beyond B and C
• Line styling (color, width, style)
• Extend Direction — Right only or Both directions
• Enable Price Range Filter — Toggle filtering of extra parallels
• Price Range Min/Max — Hide extra parallels outside this range
3. Action / Reaction Lines
• Draw Type — None, Reaction Only, Action Only, or Both
• Forward Lines Offset — Adjust from auto-extend (0 = to current bar, positive adds more)
• Backward Lines Count — Number of lines projected before Point A
• Separate styling for reaction and action lines
4. Lattice
• Draw Lattice — Master toggle
• Select Pivot for Horizontal — A, B, or C price level
• Intersection Source — Which lines to use for vertical placement
• Lattice styling
═══════════════════════════════════════════════════════════════
█ LIMITATIONS
• Maximum 500 lines — TradingView limits line objects; complex setups with many parallels and propagation lines may approach this limit
• Manual pivot selection — Pivots must be selected manually via timestamp inputs; no auto-detection
• Log scale requires toggle — You must enable "Logarithmic Scale" manually if your chart uses log axes
• Minor visual drift — Action/Reaction lines may shift slightly when toggling between odd and even extra parallel counts (cosmetic only)
• Backward lines visibility — When adding backward propagation lines, you may need to scroll the chart left for them to render
═══════════════════════════════════════════════════════════════
█ FURTHER READING
For deeper study of pitchfork analysis and action/reaction methodology:
• Patrick Mikula's "The Best Trendline Methods of Alan Andrews and Five New Trendline Techniques"
No affiliation implied. Referenced for educational context only.
═══════════════════════════════════════════════════════════════
█ RELATED
For a video walkthrough of the Super Pitchfork methodology that inspired this indicator:
How to Build a Super Pitchfork with Reaction & Trigger Lines
This tutorial covers manual pitchfork construction, reaction line projection, and timing techniques.
Wskaźnik

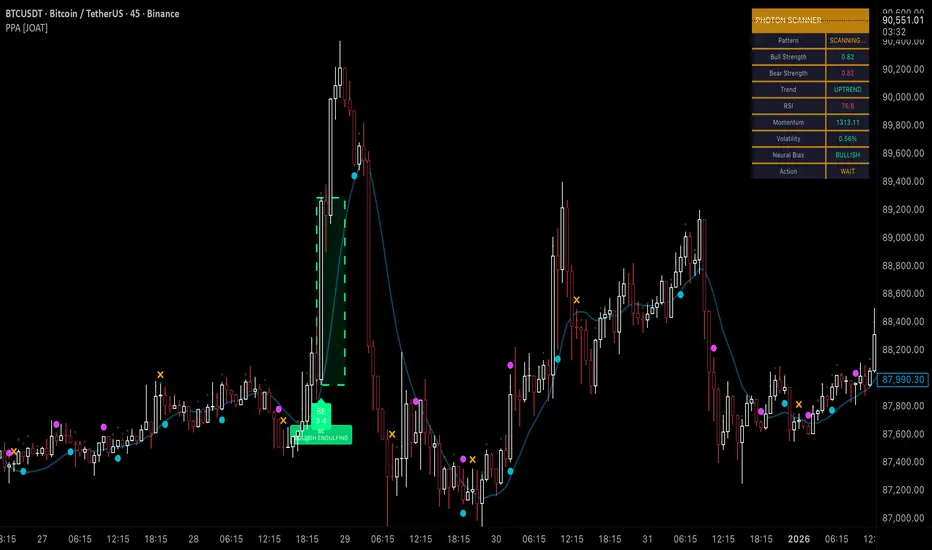
Photon Price Action Scanner [JOAT]Photon Price Action Scanner - Multi-Pattern Recognition with Adaptive Filtering
Introduction and Purpose
Photon Price Action Scanner is an open-source overlay indicator that automates the detection of 15+ candlestick patterns while filtering them through multiple confirmation layers. The core problem this indicator solves is pattern noise: raw candlestick pattern detection produces too many signals, most of which fail because they lack context. This indicator addresses that by combining pattern recognition with trend alignment, volume-weighted strength scoring, velocity confirmation, and an adaptive neural bias filter.
The combination of these components is not arbitrary. Each filter addresses a specific weakness in standalone pattern detection:
Trend alignment ensures patterns appear in favorable market structure
Volume-weighted strength filters out weak patterns with low conviction
Velocity confirmation identifies momentum behind the pattern
Neural bias filter adapts to recent price behavior to avoid counter-trend signals
What Makes This Indicator Original
While candlestick pattern scanners exist, this indicator's originality comes from:
1. Multi-Layer Filtering System - Patterns must pass through trend, strength, velocity, and neural bias filters before generating signals. This dramatically reduces false positives compared to simple pattern detection.
2. Adaptive Neural Bias Filter - A custom momentum-adjusted EMA that learns from recent price action using a configurable learning rate. This is not a standard moving average but an adaptive filter that accelerates during trends and smooths during consolidation.
3. Pattern Strength Scoring - Each pattern receives a strength score based on volume ratio and body size, allowing traders to focus on high-conviction setups rather than every pattern occurrence.
4. Smart Cooldown System - Prevents signal overlap by enforcing minimum bar spacing between pattern labels, keeping charts clean even when "Show All Patterns" is enabled.
How the Components Work Together
Step 1: Pattern Detection
The indicator scans for 15 candlestick patterns using precise mathematical definitions:
// Example: Bullish Engulfing requires the current bullish candle to completely
// engulf the previous bearish candle with a larger body
isBullishEngulfing() =>
bool pattern = close < open and close > open and
open <= close and close >= open and
close - open > open - close
pattern
// Example: Three White Soldiers requires three consecutive bullish candles
// with each opening within the previous body and closing higher
isThreeWhiteSoldiers() =>
bool pattern = close > open and close > open and close > open and
close < close and close < close and
open > open and open < close and
open > open and open < close
pattern
Step 2: Strength Calculation
Each detected pattern receives a strength score combining volume and body size:
float volRatio = avgVolume > 0 ? volume / avgVolume : 1.0
float bodySize = math.abs(close - open) / close
float baseStrength = (volRatio + bodySize * 100) / 2
This ensures patterns with above-average volume and large bodies score higher than weak patterns on low volume.
Step 3: Trend Alignment
Patterns are checked against the trend direction using an EMA:
float trendEMA = ta.ema(close, i_trendPeriod)
int trendDir = close > trendEMA ? 1 : close < trendEMA ? -1 : 0
Bullish patterns in uptrends and bearish patterns in downtrends receive priority.
Step 4: Neural Bias Filter
The adaptive filter uses a momentum-adjusted EMA that responds to price changes:
neuralEMA(series float src, simple int period, simple float lr) =>
var float neuralValue = na
var float momentum = 0.0
if na(neuralValue)
neuralValue := src
float error = src - neuralValue
float adjustment = error * lr
momentum := momentum * 0.9 + adjustment * 0.1
neuralValue := neuralValue + adjustment + momentum
neuralValue
The learning rate (lr) controls how quickly the filter adapts. Higher values make it more responsive; lower values make it smoother.
Step 5: Velocity Confirmation
Price velocity (rate of change) must exceed the average velocity for strong signals:
float velocity = ta.roc(close, i_trendPeriod)
float avgVelocity = ta.sma(velocity, i_trendPeriod)
bool velocityBull = velocity > avgVelocity * 1.5
Step 6: Signal Classification
Signals are classified based on how many filters they pass:
Strong Pattern : Pattern + strength threshold + trend alignment + neural bias + velocity
Ultra Pattern : Strong pattern + gap in same direction + velocity confirmation
Watch Pattern : Pattern detected but not all filters passed
Detected Patterns
Classic Reversal Patterns:
Bullish/Bearish Engulfing - Complete body engulfment with larger body
Hammer - Long lower wick (2x body), small upper wick, bullish context
Shooting Star - Long upper wick (2x body), small lower wick, bearish context
Morning Star - Three-bar bullish reversal with small middle body
Evening Star - Three-bar bearish reversal with small middle body
Piercing Line - Bullish candle closing above midpoint of previous bearish candle
Dark Cloud Cover - Bearish candle closing below midpoint of previous bullish candle
Bullish/Bearish Harami - Small body contained within previous larger body
Doji - Body less than 10% of total range (indecision)
Advanced Patterns (Optional):
Three White Soldiers - Three consecutive bullish candles with rising closes
Three Black Crows - Three consecutive bearish candles with falling closes
Tweezer Top - Equal highs with reversal candle structure
Tweezer Bottom - Equal lows with reversal candle structure
Island Reversal - Gap isolation creating reversal structure
Dashboard Information
The dashboard displays real-time analysis:
Pattern - Current detected pattern name or "SCANNING..."
Bull/Bear Strength - Volume-weighted strength scores
Trend - UPTREND, DOWNTREND, or SIDEWAYS based on EMA
RSI - 14-period RSI for momentum context
Momentum - 10-period momentum reading
Volatility - ATR as percentage of price
Neural Bias - BULLISH, BEARISH, or NEUTRAL from adaptive filter
Action - ULTRA BUY/SELL, BUY/SELL, WATCH BUY/SELL, or WAIT
Visual Elements
Pattern Labels - Abbreviated codes (BE=Engulfing, H=Hammer, MS=Morning Star, etc.)
Neural Bias Line - Adaptive trend line showing filter direction
Gap Boxes - Cyan boxes highlighting price gaps
Action Zones - Dashed boxes around strong pattern areas
Velocity Markers - Small circles when velocity confirms direction
Ultra Signals - Large labels for highest conviction setups
How to Use This Indicator
For Reversal Trading:
1. Wait for a pattern to appear at a key support/resistance level
2. Check that the Action shows "BUY" or "SELL" (not just "WATCH")
3. Confirm the Neural Bias aligns with your trade direction
4. Use the strength score to gauge conviction (higher is better)
For Trend Continuation:
1. Identify the trend using the Trend row in the dashboard
2. Look for patterns that align with the trend (bullish patterns in uptrends)
3. Ultra signals indicate the strongest continuation setups
For Filtering Noise:
1. Keep "Show All Patterns" disabled to see only filtered signals
2. Increase "Pattern Strength Filter" to see fewer, higher-quality patterns
3. Enable "Velocity Confirmation" to require momentum behind patterns
Input Parameters
Scan Sensitivity (1.0) - Overall detection sensitivity multiplier
Pattern Strength Filter (3) - Minimum strength score for strong signals
Trend Period (20) - EMA period for trend determination
Show All Patterns (false) - Display all patterns regardless of filters
Advanced Patterns (true) - Enable soldiers/crows/tweezer detection
Gap Analysis (true) - Enable gap detection and boxes
Velocity Confirmation (true) - Require velocity for strong signals
Neural Bias Filter (true) - Enable adaptive trend filter
Neural Period (50) - Lookback for neural bias calculation
Neural Learning Rate (0.12) - Adaptation speed (0.01-0.5)
Timeframe Recommendations
1H-4H: Best balance of signal frequency and reliability
Daily: Fewer but more significant patterns
15m-30m: More signals, requires tighter filtering (increase strength threshold)
Limitations
Pattern detection is mechanical and does not consider fundamental context
Neural bias filter may lag during rapid trend reversals
Gap detection requires clean price data without after-hours gaps
Strength scoring favors high-volume patterns, which may miss valid low-volume setups
- Made with passion by officialjackofalltrades
Wskaźnik

Cosmic Volume Analyzer [JOAT]
Cosmic Volume Analyzer - Astrophysics Edition
Overview
Cosmic Volume Analyzer is an open-source oscillator indicator that applies astrophysics-inspired concepts to volume analysis. It classifies volume into buy/sell categories, calculates volume flow, detects accumulation/distribution phases, identifies climax volume events, and uses gravitational and stellar mass analogies to visualize volume dynamics.
What This Indicator Does
The indicator calculates and displays:
Volume Classification - Categorizes each bar as CLIMAX_BUY, CLIMAX_SELL, HIGH_BUY, HIGH_SELL, NORMAL_BUY, or NORMAL_SELL
Volume Flow - Percentage showing buy vs sell pressure over a lookback period
Buy/Sell Volume - Separated volume based on candle direction
Accumulation/Distribution - Phase detection using Money Flow Multiplier
Volume Oscillator - Fast vs slow volume EMA comparison
Gravitational Pull - Volume-weighted price attraction metric
Stellar Mass Index - Volume ratio combined with price momentum
Black Hole Detection - Identifies extremely low volume periods (liquidity voids)
Supernova Events - Detects extreme volume with extreme price movement
Orbital Cycles - Sine-wave based cyclical visualization
How It Works
Volume classification uses volume ratio and candle direction:
classifyVolume(series float vol, series float close, series float open) =>
float avgVol = ta.sma(vol, 20)
float volRatio = avgVol > 0 ? vol / avgVol : 1.0
if volRatio > 1.5
if close > open
classification := "CLIMAX_BUY"
else
classification := "CLIMAX_SELL"
else if volRatio > 1.2
// HIGH_BUY or HIGH_SELL
else
// NORMAL_BUY or NORMAL_SELL
Volume flow separates buy and sell volume over a period:
calculateVolumeFlow(series float vol, series float close, simple int period) =>
float currentBuyVol = close > open ? vol : 0.0
float currentSellVol = close < open ? vol : 0.0
// Accumulate in buffers
float flow = (buyVolume - sellVolume) / totalVol * 100
Accumulation/Distribution uses the Money Flow Multiplier:
float mfm = ((close - low) - (high - close)) / (high - low)
float mfv = mfm * vol
float adLine = ta.cum(mfv)
if adLine > adEMA and ta.rising(adLine, 3)
phase := "ACCUMULATION"
else if adLine < adEMA and ta.falling(adLine, 3)
phase := "DISTRIBUTION"
Gravitational pull uses volume-weighted price distance:
gravitationalPull(series float vol, series float price, simple int period) =>
float massCenter = ta.vwma(price, period)
float distance = math.abs(price - massCenter)
float mass = vol / ta.sma(vol, period)
float gravity = distance > 0 ? mass / (distance * distance) : 0.0
Signal Generation
Signals are generated based on volume conditions:
Buy Climax: Volume exceeds 2 standard deviations above average on bullish candle
Sell Climax: Volume exceeds 2 standard deviations above average on bearish candle
Strong Buy Flow: Volume flow exceeds positive threshold (default 45%)
Strong Sell Flow: Volume flow exceeds negative threshold (default -45%)
Supernova: Volume 3x average AND price change 3x average
Black Hole: Volume 2 standard deviations below average
Dashboard Panel (Top-Right)
Volume Class - Current volume classification
Volume Flow - Buy/sell flow percentage
Buy Volume - Accumulated buy volume
Sell Volume - Accumulated sell volume
A/D Phase - ACCUMULATION/DISTRIBUTION/NEUTRAL
Volume Strength - Normalized volume strength
Gravity Pull - Current gravitational metric
Stellar Mass - Current stellar mass index
Cosmic Field - Combined cosmic field strength
Black Hole - Detection status and void strength
Signal - Current actionable status
Visual Elements
Volume Ratio Columns - Colored bars showing normalized volume
Volume Flow Line - Main oscillator showing flow direction
Flow EMA - Smoothed flow for trend reference
Volume Oscillator - Area plot showing fast/slow comparison
Gravity Field - Area plot showing gravitational pull
Orbital Cycle - Circle plots showing cyclical pattern
Stellar Mass Line - Line showing mass index
Climax Markers - Fire emoji for buy climax, snowflake for sell climax
Supernova Markers - Diamond shapes for extreme events
Black Hole Markers - X-cross for liquidity voids
A/D Phase Background - Subtle background color based on phase
Input Parameters
Volume Period (default: 20) - Period for volume calculations
Distribution Levels (default: 5) - Granularity of distribution analysis
Flow Threshold (default: 1.5) - Multiplier for flow significance
Accumulation Period (default: 14) - Period for A/D calculation
Gravitational Analysis (default: true) - Enable gravity metrics
Black Hole Detection (default: true) - Enable void detection
Stellar Mass Calculation (default: true) - Enable mass index
Orbital Cycles (default: true) - Enable cyclical visualization
Supernova Detection (default: true) - Enable extreme event detection
Suggested Use Cases
Identify accumulation phases for potential long entries
Watch for distribution phases as potential exit signals
Use climax volume as potential exhaustion indicators
Monitor volume flow for directional bias
Avoid trading during black hole (low liquidity) periods
Watch for supernova events as potential trend acceleration
Timeframe Recommendations
Best on 15m to Daily charts. Volume analysis requires sufficient trading activity for meaningful readings.
Limitations
Volume data quality varies by exchange and instrument
Buy/sell separation is based on candle direction, not actual order flow
Astrophysics concepts are analogies, not literal physics
A/D phase detection may lag during rapid transitions
Open-Source and Disclaimer
This script is published as open-source under the Mozilla Public License 2.0 for educational purposes. It does not constitute financial advice. Past performance does not guarantee future results. Always use proper risk management.
- Made with passion by officialjackofalltrades
Wskaźnik

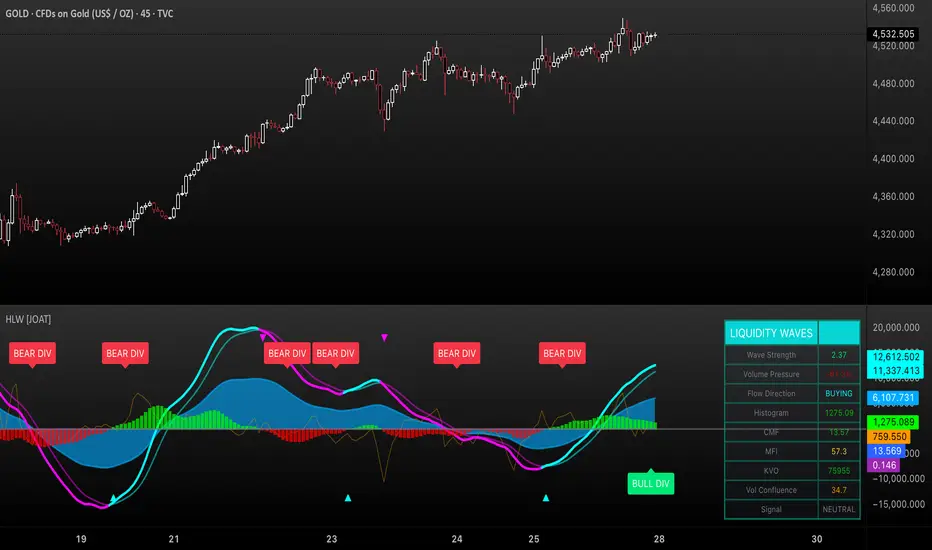
Harmonic Liquidity Waves [JOAT]Harmonic Liquidity Waves
Overview
Harmonic Liquidity Waves is an open-source oscillator indicator that combines multiple volume-based analysis techniques into a unified liquidity flow framework. It integrates VWAP calculations, Chaikin Money Flow (CMF), Money Flow Index (MFI), and Klinger Volume Oscillator (KVO) with custom harmonic wave calculations to provide a comprehensive view of volume dynamics and money flow.
What This Indicator Does
The indicator calculates and displays:
Liquidity Flow - Volume-weighted price movement accumulated over a lookback period
Harmonic Wave - Multi-depth smoothed oscillator derived from liquidity flow
Chaikin Money Flow (CMF) - Classic accumulation/distribution indicator
Money Flow Index (MFI) - Volume-weighted RSI showing buying/selling pressure
Klinger Volume Oscillator (KVO) - Trend-volume relationship indicator
Wave Interference - Combined constructive/destructive wave patterns
Volume Profile POC - Point of Control from simplified volume distribution
How It Works
The core liquidity flow calculation tracks volume-weighted price changes:
calculateLiquidityFlow(series float vol, series float price, simple int period) =>
float priceChange = ta.change(price)
float volumeFlow = vol * math.sign(priceChange)
// Accumulated over period using buffer array
float avgFlow = flowSum / period
avgFlow
The harmonic oscillator applies multi-depth smoothing:
harmonicOscillator(series float flow, simple int depth, simple int period) =>
float harmonic = 0.0
for i = 1 to depth
float wave = ta.ema(flow, period * i) / i
harmonic += wave
harmonic / depth
CMF measures accumulation/distribution using the Money Flow Multiplier:
float mfm = ((close - low) - (high - close)) / (high - low)
float mfv = mfm * vol
float cmf = ta.sum(mfv, period) / ta.sum(vol, period) * 100
Signal Generation
Liquidity shift signals occur when:
Bullish Shift: Smoothed wave crosses above signal line
Bearish Shift: Smoothed wave crosses below signal line
Strong signals require volume indicator confirmation:
Strong Bull: Bullish shift + CMF > 0 + MFI > 50 + KVO > 0
Strong Bear: Bearish shift + CMF < 0 + MFI < 50 + KVO < 0
Divergence detection compares price pivots with liquidity wave pivots to identify potential reversals.
Dashboard Panel (Bottom-Right)
Wave Strength - Normalized wave magnitude
Volume Pressure - Current volume vs average percentage
Flow Direction - BUYING or SELLING based on wave sign
Histogram - Wave minus signal line value
CMF - Chaikin Money Flow reading
MFI - Money Flow Index value (0-100)
KVO - Klinger oscillator value
Vol Confluence - Combined volume indicator score
Signal - Current actionable status
Visual Elements
Liquidity Wave - Main oscillator line
Wave Signal - Smoothed signal line for crossover detection
Wave Histogram - Difference between wave and signal
Wave Interference - Area plot showing combined wave patterns
CMF/KVO/MFI Lines - Individual volume indicator plots
Divergence Labels - BULL DIV / BEAR DIV markers
Shift Markers - Triangles for basic shifts, labels for strong shifts
Input Parameters
Wave Period (default: 21) - Base period for liquidity calculations
Volume Weight (default: 1.5) - Multiplier for volume emphasis
Harmonic Depth (default: 3) - Number of smoothing layers
Smoothing (default: 3) - Final wave smoothing period
Suggested Use Cases
Identify accumulation/distribution phases using CMF and wave direction
Confirm momentum with MFI overbought/oversold readings
Watch for divergences between price and liquidity flow
Use strong signals when multiple volume indicators align
Timeframe Recommendations
Best on 15m to Daily charts. Volume-based indicators require sufficient trading activity for meaningful readings.
Limitations
Volume data quality varies by exchange and instrument
Divergence detection uses pivot-based lookback and may lag
Volume Profile POC is simplified and not a full profile analysis
Open-Source and Disclaimer
This script is published as open-source under the Mozilla Public License 2.0 for educational purposes. It does not constitute financial advice. Past performance does not guarantee future results. Always use proper risk management.
- Made with passion by officialjackofalltrades Wskaźnik

Ocean Master [JOAT]Ocean Master QE - Advanced Oceanic Market Analysis with Quantum Flow Dynamics
Overview
Ocean Master QE is an open-source overlay indicator that combines multiple analytical techniques into a unified market analysis framework. It uses ATR-based dynamic channels, volume-weighted order flow analysis, multi-timeframe correlation (quantum entanglement concept), and harmonic oscillator calculations to provide traders with a comprehensive view of market conditions.
What This Indicator Does
The indicator calculates and displays several key components:
Dynamic Price Channels - ATR-adjusted upper, middle, and lower channels that adapt to current volatility conditions
Order Flow Analysis - Separates buying and selling volume pressure to calculate a directional delta
Smart Money Index - Volume-weighted order flow metric that highlights potential institutional activity
Harmonic Oscillator - Weighted combination of 10 Fibonacci-period EMAs (5, 8, 13, 21, 34, 55, 89, 144, 233, 377) to identify trend direction
Multi-Timeframe Correlation - Measures price correlation across 1H, 4H, and Daily timeframes
Wave Function Analysis - Momentum-based state detection that identifies when price action becomes decisive
How It Works
The core channel calculation uses ATR with a configurable quantum sensitivity factor:
float atr = ta.atr(i_atrLength)
float quantumFactor = 1.0 + (i_quantumSensitivity * 0.1)
float quantumATR = atr * quantumFactor
upperChannel := ta.highest(high, i_length) - (quantumATR * 0.5)
lowerChannel := ta.lowest(low, i_length) + (quantumATR * 0.5)
midChannel := (upperChannel + lowerChannel) * 0.5
Order flow is calculated by separating volume into buy and sell components based on candle direction:
The harmonic oscillator weights shorter EMAs more heavily using inverse weighting (1/1, 1/2, 1/3... 1/10), creating a responsive yet smooth trend indicator.
Signal Generation
Confluence signals require multiple conditions to align:
Bullish: Harmonic oscillator crosses above zero + positive Smart Money Index + positive Order Flow Delta
Bearish: Harmonic oscillator crosses below zero + negative Smart Money Index + negative Order Flow Delta
Dashboard Panel (Top-Right)
Bias - Current market direction based on price vs mid-channel
Entanglement - Multi-timeframe correlation score (0-100%)
Wave State - COLLAPSED (decisive) or SUPERPOSITION (uncertain)
Volume - Current volume relative to 20-period average
Volatility - ATR as percentage of price
Smart Money - Volume-weighted order flow reading
Visual Elements
Ocean Depth Layers - Gradient fills between channel levels representing different price zones
Channel Lines - Upper (surface), middle, and lower (seabed) dynamic levels
Divergence Markers - Triangle shapes when harmonic oscillator crosses zero
Confluence Labels - BULL/BEAR labels when multiple factors align
Suggested Use Cases
Identify trend direction using the harmonic oscillator and channel position
Monitor order flow for potential institutional activity
Use multi-timeframe correlation to confirm trade direction across timeframes
Watch for confluence signals where multiple factors align
Input Parameters
Length (default: 14) - Base period for channel and indicator calculations
ATR Length (default: 14) - Period for ATR calculation
Quantum Depth (default: 3) - Complexity factor for calculations
Quantum Sensitivity (default: 1.5) - Channel width multiplier
Timeframe Recommendations
Works on all timeframes. Higher timeframes (4H, Daily) provide smoother signals; lower timeframes require faster reaction times and may produce more noise.
Limitations
Multi-timeframe requests add processing overhead
Order flow estimation is based on candle direction, not actual order book data
Correlation calculations require sufficient historical data
Open-Source and Disclaimer
This script is published as open-source under the Mozilla Public License 2.0 for educational purposes. It does not constitute financial advice. Past performance does not guarantee future results. Always use proper risk management and conduct your own analysis before trading.
- Made with passion by officialjackofalltrades
Wskaźnik

Wskaźnik

Wskaźnik

Wskaźnik

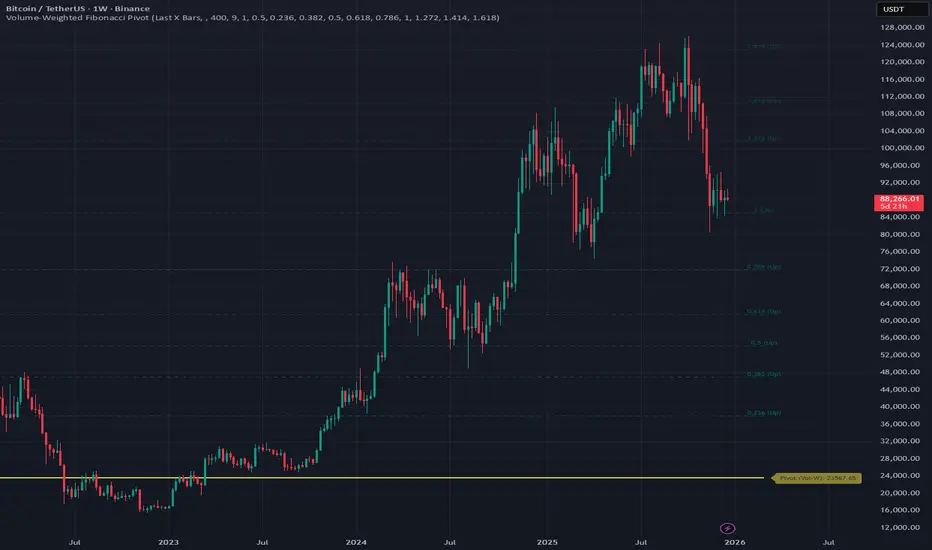
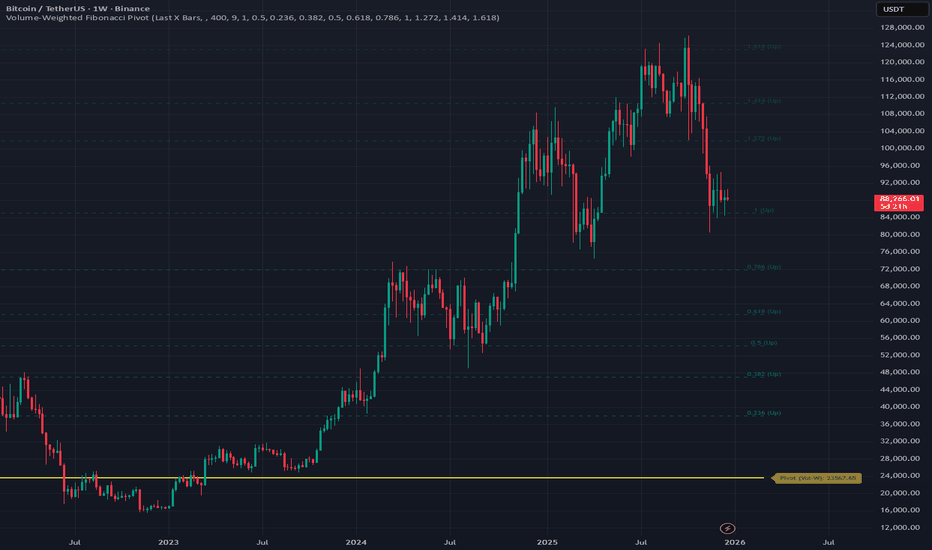
Volume-Weighted Fibonacci PivotThis indicator automatically plots dynamic Fibonacci retracement and extension levels based on a volume-weighted pivot point within a user-defined lookback period or date range. It intelligently calculates a central "pivot" price biased toward high-volume bars, then draws symmetric levels both upward (extensions) and downward (retracements) for balanced confluence analysis.
How It Works (Technical Methodology)
Lookback Period Determination
Multiple filter modes control the data range used for calculations:
"Last X Bars": Fixed number of recent bars (default 400, max 4999).
"Manual Date": User-specified start date.
"Interactive (Chart)": Confirmed start date via input.
"None": Full available history (falls back to max bars).
Optionally, when using "Last X Bars", calculations can pull data from a higher/lower user-selected timeframe via request.security() for multi-timeframe alignment.
A dotted vertical line marks the start point in date-based modes.
Range and Pivot Calculation
Within the selected period:
Highest high and lowest low define the full price range.
Average volume is computed across the period.
Volume-Weighted Pivot: Average close price only from bars where volume > average volume (fallback to simple midpoint if no high-volume bars).
This creates a "smart" central pivot that leans toward areas of greater participation, often aligning with institutional activity.
Fibonacci Level Generation
User-configurable ratios (default: 0.236, 0.382, 0.5, 0.618, 0.786, 1.0, 1.272, 1.414, 1.618).
Levels are calculated symmetrically around the volume-weighted pivot:
Upward: Pivot + (Range × Ratio × Correction Factor) – teal/cyan shades.
Downward: Pivot - (Range × Ratio × Correction Factor) – red shades.
Correction Factor (default 0.5): Scales level spacing for tighter/wider grids without altering ratios.
Only the user-defined number of active lines (default 9) are drawn.
Visual Construction
Central Pivot Line: Thick yellow horizontal line with label showing exact price.
Up/Down Levels: Dashed lines extended into the future, labeled with ratio direction ("Up" or "Dn").
All objects redraw only on the last bar for performance, clearing previous drawings.
Multi-Timeframe Option
When enabled with "Last X Bars":
Pulls high/low/volume data from specified timeframe.
Aligns the pivot and levels to higher-timeframe structure while displaying on current chart – ideal for intraday traders seeking HTF confluence.
How to Use
This tool provides clean, volume-aware Fibonacci grids for identifying potential support/resistance, reversal zones, and targets.
Volume-Weighted Pivot: Often acts as a strong mean reversion level or fair value area.
Upward Levels (Teal): Potential resistance/extensions in bullish moves; watch for reactions on retests.
Downward Levels (Red): Potential support/retracements in bearish moves.
Confluence: High probability when price reacts at levels aligning with other tools (order blocks, pivots, volume profile).
Correction Factor: Lower values (<0.5) for tighter grids in ranging markets; higher (>0.5) for trending markets.
Multi-Timeframe Mode: Use on lower charts (e.g., 15m) with HTF input (e.g., 4H or Daily) to project major structure levels.
Common Setups:
Pullbacks to 0.618–0.786 zones for continuation entries.
Breaks beyond 1.0–1.618 for extension targets.
Reactions near pivot line for mean reversion trades.
Adjust ratios and active line count to match your preferred Fibonacci style (classic retracement vs. extensions).
Disclaimer
This indicator is a technical analysis tool and should be used in conjunction with other forms of analysis. Past performance does not guarantee future results. Always use proper risk management. Wskaźnik
Harmonic Patterns [kingthies]Harmonic Patterns
This indicator scans price swings for classic X-A-B-C-D harmonic patterns and plots the structure plus a PRZ (Potential Reversal Zone) to help you frame areas where reactions are statistically more likely. It supports both bullish and bearish setups and can trigger alerts when a new D pivot confirms a pattern.
What it does
Builds a pivot-based swing map (ZigZag-style) using a configurable Pivot Length .
Evaluates the most recent 5 swing points (X, A, B, C, D) against harmonic ratio rules with a user-defined tolerance .
Detects: Gartley, Bat, Butterfly, Crab, Deep Crab, Cypher, Shark (loose) .
Draws the pattern legs (X-A-B-C-D), labels the detection with ratio readouts, and projects a PRZ using 3 target levels (derived from XA/BC logic per pattern).
Offers two rendering modes:
Best only : picks the closest match (lowest score) to reduce clutter.
Show all : plots every valid match (uses filled PRZ boxes to keep object usage under control).
PRZ (Potential Reversal Zone)
PRZ is built from three target levels and expanded into a zone.
Optional padding uses ATR (ATR multiplier) to widen/narrow the zone for volatility.
Display modes: Off, Box, Lines, Both .
Zones can be extended forward by a configurable number of bars to keep the area visible as price develops.
How to use
Start with Confirm only when D pivot forms enabled (recommended) to reduce false positives while patterns are still forming.
Adjust Pivot Length based on timeframe:
Lower values = more swings, more signals, more noise.
Higher values = cleaner structures, fewer signals.
Use Ratio Tolerance to control strictness:
Lower tolerance = fewer, higher-confidence matches.
Higher tolerance = more matches, potentially lower quality.
Treat harmonics as context , not a standalone entry system:
Look for confluence (HTF levels, structure, volume, momentum/RSI divergence, etc.).
Use your own confirmation and risk plan (invalidations beyond PRZ / beyond D).
Settings overview
Swings (Pivot ZigZag)
Pivot Length: pivot sensitivity.
Use Wicks: uses High/Low; if off, uses Close.
Max Stored Swings: limits stored pivots for performance/object control.
Harmonic Detection
Ratio Tolerance (%): allowed deviation around ideal ratios.
Confirm only when D pivot forms: reduces repaint-like behavior.
When multiple match: Best only vs Show all.
Pattern Filters enable/disable each pattern type.
PRZ
PRZ Display: Off / Box / Lines / Both.
PRZ Padding (ATR multiplier): volatility-adjusted zone padding.
PRZ Extend (bars): how far to project the zone.
Visuals
Draw Legs: draws X-A-B-C-D.
Show Pattern Label: prints pattern name, direction, ratios, and score.
Label Offset: shift label forward if you want more space.
Alerts
“Bullish/Bearish Harmonic (Any)” triggers on any detected pattern.
Per-pattern alerts are included for each supported pattern type.
Notes
This indicator is educational and intended to assist with pattern recognition and confluence mapping.
Harmonic patterns do not guarantee reversals—always manage risk and confirm with your own process.
Wskaźnik

Wskaźnik

Density Zones (GM Crossing Clusters) + QHO Spin FlipsINDICATOR NAME
Density Zones (GM Crossing Clusters) + QHO Spin Flips
OVERVIEW
This indicator combines two complementary ideas into a single overlay: *this combines my earlier Geometric Mean Indicator with the Quantum Harmonic Oscillator (Overlay) with additional enhancements*
1) Density Zones (GM Crossing Clusters)
A “Density Zone” is detected when price repeatedly crosses a Geometric Mean equilibrium line (GM) within a rolling lookback window. Conceptually, this identifies regions where the market is repeatedly “snapping” across an equilibrium boundary—high churn, high decision pressure, and repeated re-selection of direction.
2) QHO Spin Flips (Regression-Residual σ Breaches)
A “Spin Flip” is detected when price deviates beyond a configurable σ-threshold (κ) from a regression-based equilibrium, using normalized residuals. Conceptually, this marks excursions into extreme states (decoherence / expansion), which often precede a reversion toward equilibrium and/or a regime re-scaling.
These two systems are related but not identical:
- Density Zones identify where equilibrium crossings cluster (a “singularity”/anchor behavior around GM).
- Spin Flips identify when price exceeds statistically extreme displacement from the regression equilibrium (LSR), indicating expansion beyond typical variance.
CORE CONCEPTS AND FORMULAS
SECTION A — GEOMETRIC MEAN EQUILIBRIUM (GM)
We define two moving averages:
(1) MA1_t = SMA(close_t, L1)
(2) MA2_t = SMA(close_t, L2)
We define the equilibrium anchor as the geometric mean of MA1 and MA2:
(3) GM_t = sqrt( MA1_t * MA2_t )
This GM line acts as an equilibrium boundary. Repeated crossings are interpreted as high “equilibrium churn.”
SECTION B — CROSS EVENTS (UP/DOWN)
A “cross event” is registered when the sign of (close - GM) changes:
Define a sign function s_t:
(4) s_t =
+1 if close_t > GM_t
-1 if close_t < GM_t
s_{t-1} if close_t == GM_t (tie-breaker to avoid false flips)
Then define the crossing event indicator:
(5) crossEvent_t = 1 if s_t != s_{t-1}
0 otherwise
Additionally, the indicator plots explicit cross markers:
- Cross Above GM: crossover(close, GM)
- Cross Below GM: crossunder(close, GM)
These provide directional visual cues and match the original Geometric Mean Indicator behavior.
SECTION C — DENSITY MEASURE (CROSSING CLUSTER COUNT)
A Density Zone is based on the number of cross events occurring in the last W bars:
(6) D_t = Σ_{i=0..W-1} crossEvent_{t-i}
This is a “crossing density” score: how many times price has toggled across GM recently.
The script implements this efficiently using a cumulative sum identity:
Let x_t = crossEvent_t.
(7) cumX_t = Σ_{j=0..t} x_j
Then:
(8) D_t = cumX_t - cumX_{t-W} (for t >= W)
cumX_t (for t < W)
SECTION D — DENSITY ZONE TRIGGER
We define a Density Zone state:
(9) isDZ_t = ( D_t >= θ )
where:
- θ (theta) is the user-selected crossing threshold.
Zone edges:
(10) dzStart_t = isDZ_t AND NOT isDZ_{t-1}
(11) dzEnd_t = NOT isDZ_t AND isDZ_{t-1}
SECTION E — DENSITY ZONE BOUNDS
While inside a Density Zone, we track the running high/low to display zone bounds:
(12) dzHi_t = max(dzHi_{t-1}, high_t) if isDZ_t
(13) dzLo_t = min(dzLo_{t-1}, low_t) if isDZ_t
On dzStart:
(14) dzHi_t := high_t
(15) dzLo_t := low_t
Outside zones, bounds are reset to NA.
These bounds visually bracket the “singularity span” (the churn envelope) during each density episode.
SECTION F — QHO EQUILIBRIUM (REGRESSION CENTERLINE)
Define the regression equilibrium (LSR):
(16) m_t = linreg(close_t, L, 0)
This is the “centerline” the QHO system uses as equilibrium.
SECTION G — RESIDUAL AND σ (FIELD WIDTH)
Residual:
(17) r_t = close_t - m_t
Rolling standard deviation of residuals:
(18) σ_t = stdev(r_t, L)
This σ_t is the local volatility/width of the residual field around the regression equilibrium.
SECTION H — NORMALIZED DISPLACEMENT AND SPIN FLIP
Define the standardized displacement:
(19) Y_t = (close_t - m_t) / σ_t
(If σ_t = 0, the script safely treats Y_t = 0.)
Spin Flip trigger uses a user threshold κ:
(20) spinFlip_t = ( |Y_t| > κ )
Directional spin flips:
(21) spinUp_t = ( Y_t > +κ )
(22) spinDn_t = ( Y_t < -κ )
The default κ=3.0 corresponds to “3σ excursions,” which are statistically extreme under a normal residual assumption (even though real markets are not perfectly normal).
SECTION I — QHO BANDS (OPTIONAL VISUALIZATION)
The indicator optionally draws the standard σ-bands around the regression equilibrium:
(23) 1σ bands: m_t ± 1·σ_t
(24) 2σ bands: m_t ± 2·σ_t
(25) 3σ bands: m_t ± 3·σ_t
These provide immediate context for the Spin Flip events.
WHAT YOU SEE ON THE CHART
1) MA1 / MA2 / GM lines (optional)
- MA1 (blue), MA2 (red), GM (green).
- GM is the equilibrium anchor for Density Zones and cross markers.
2) GM Cross Markers (optional)
- “GM↑” label markers appear on bars where close crosses above GM.
- “GM↓” label markers appear on bars where close crosses below GM.
3) Density Zone Shading (optional)
- Background shading appears while isDZ_t = true.
- This is the period where the crossing density D_t is above θ.
4) Density Zone High/Low Bounds (optional)
- Two lines (dzHi / dzLo) are drawn only while in-zone.
- These bounds bracket the full churn envelope during the density episode.
5) QHO Bands (optional)
- 1σ, 2σ, 3σ shaded zones around regression equilibrium.
- These visualize the current variance field.
6) Regression Equilibrium (LSR Centerline)
- The white centerline is the regression equilibrium m_t.
7) Spin Flip Markers
- A circle is plotted when |Y_t| > κ (beyond your chosen σ-threshold).
- Marker size is user-controlled (tiny → huge).
HOW TO USE IT
Step 1 — Pick the equilibrium anchor (GM)
- L1 and L2 define MA1 and MA2.
- GM = sqrt(MA1 * MA2) becomes your equilibrium boundary.
Typical choices:
- Faster equilibrium: L1=20, L2=50 (default-like).
- Slower equilibrium: L1=50, L2=200 (macro anchor).
Interpretation:
- GM acts like a “center of mass” between two moving averages.
- Crosses show when price flips from one side of equilibrium to the other.
Step 2 — Tune Density Zones (W and θ)
- W controls the time window measured (how far back you count crossings).
- θ controls how many crossings qualify as a “density/singularity episode.”
Guideline:
- Larger W = slower, broader density detection.
- Higher θ = only the most intense churn is labeled as a Density Zone.
Interpretation:
- A Density Zone is not “bullish” or “bearish” by itself.
- It is a condition: repeated equilibrium toggling (high churn / high compression).
- These often precede expansions, but direction is not implied by the zone alone.
Step 3 — Tune the QHO spin flip sensitivity (L and κ)
- L controls regression memory and σ estimation length.
- κ controls how extreme the displacement must be to trigger a spin flip.
Guideline:
- Smaller L = more reactive centerline and σ.
- Larger L = smoother, slower “field” definition.
- κ=3.0 = strong extreme filter.
- κ=2.0 = more frequent flips.
Interpretation:
- Spin flips mark when price exits the “normal” residual field.
- In your model language: a moment of decoherence/expansion that is statistically extreme relative to recent equilibrium.
Step 4 — Read the combined behavior (your key thesis)
A) Density Zone forms (GM churn clusters):
- Market repeatedly crosses equilibrium (GM), compressing into a bounded churn envelope.
- dzHi/dzLo show the envelope range.
B) Expansion occurs:
- Price can release away from the density envelope (up or down).
- If it expands far enough relative to regression equilibrium, a Spin Flip triggers (|Y| > κ).
C) Re-coherence:
- After a spin flip, price often returns toward equilibrium structures:
- toward the regression centerline m_t
- and/or back toward the density envelope (dzHi/dzLo) depending on regime behavior.
- The indicator does not guarantee return, but it highlights the condition where return-to-field is statistically likely in many regimes.
IMPORTANT NOTES / DISCLAIMERS
- This indicator is an analytical overlay. It does not provide financial advice.
- Density Zones are condition states derived from GM crossing frequency; they do not predict direction.
- Spin Flips are statistical excursions based on regression residuals and rolling σ; markets have fat tails and non-stationarity, so σ-based thresholds are contextual, not absolute.
- All parameters (L1, L2, W, θ, L, κ) should be tuned per asset, timeframe, and volatility regime.
PARAMETER SUMMARY
Geometric Mean / Density Zones:
- L1: MA1 length
- L2: MA2 length
- GM_t = sqrt(SMA(L1)*SMA(L2))
- W: crossing-count lookback window
- θ: crossing density threshold
- D_t = Σ crossEvent_{t-i} over W
- isDZ_t = (D_t >= θ)
- dzHi/dzLo track envelope bounds while isDZ is true
QHO / Spin Flips:
- L: regression + residual σ length
- m_t = linreg(close, L, 0)
- r_t = close_t - m_t
- σ_t = stdev(r_t, L)
- Y_t = r_t / σ_t
- spinFlip_t = (|Y_t| > κ)
Visual Controls:
- toggles for GM lines, cross markers, zone shading, bounds, QHO bands
- marker size options for GM crosses and spin flips
ALERTS INCLUDED
- Density Zone START / END
- Spin Flip UP / DOWN
- Cross Above GM / Cross Below GM
SUMMARY
This indicator treats the Geometric Mean as an equilibrium boundary and identifies “Density Zones” when price repeatedly crosses that equilibrium within a rolling window, forming a bounded churn envelope (dzHi/dzLo). It also models a regression-based equilibrium field and triggers “Spin Flips” when price makes statistically extreme σ-excursions from that field. Used together, Density Zones highlight compression/decision regions (equilibrium churn), while Spin Flips highlight extreme expansion states (σ-breaches), allowing the user to visualize how price compresses around equilibrium, releases outward, and often re-stabilizes around equilibrium structures over time.
Wskaźnik

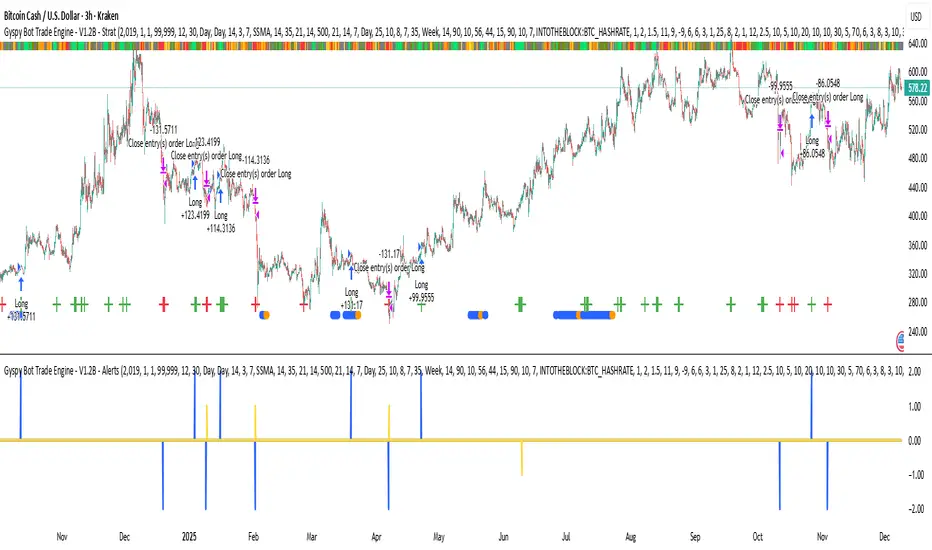
Gyspy Bot Trade Engine - V1.2B - Alerts - 12-7-25 - SignalLynxGypsy Bot Trade Engine (MK6 V1.2B) - Alerts & Visualization
Brought to you by Signal Lynx | Automation for the Night-Shift Nation 🌙
1. Executive Summary & Architecture
Gypsy Bot (MK6 V1.2B) is not merely a strategy; it is a massive, modular Trade Engine built specifically for the TradingView Pine Script V6 environment. While most tools rely on a single dominant indicator to generate signals, Gypsy Bot functions as a sophisticated Consensus Algorithm.
Note: This is the Indicator / Alerts version of the engine. It is designed for visual analysis and generating live alert signals for automation. If you wish to see Backtest data (Equity Curves, Drawdown, Profit Factors), please use the Strategy version of this script.
The engine calculates data from up to 12 distinct Technical Analysis Modules simultaneously on every bar closing. It aggregates these signals into a "Vote Count" and only fires a signal plot when a user-defined threshold of concurring signals is met. This "Voting System" acts as a noise filter, requiring multiple independent mathematical models—ranging from volume flow and momentum to cyclical harmonics and trend strength—to agree on market direction.
Beyond entries, Gypsy Bot features a proprietary Risk Management suite called the Dump Protection Team (DPT). This logic layer operates independently of the entry modules, specifically scanning for "Moon" (Parabolic) or "Nuke" (Crash) volatility events to signal forced exits, preserving capital during Black Swan events.
2. ⚠️ The Philosophy of "Curve Fitting" (Must Read)
One must be careful when applying Gypsy Bot to new pairs or charts.
To be fully transparent: Gypsy Bot is, by definition, a very advanced curve-fitting engine. Because it grants the user granular control over 12 modules, dozens of thresholds, and specific voting requirements, it is extremely easy to "over-fit" the data. You can easily toggle switches until the charts look perfect in hindsight, only to have the signals fail in live markets because they were tuned to historical noise rather than market structure.
To use this engine successfully:
Visual Verification: Do not just look for "green arrows." Look for signals that occur at logical market structure points.
Stability: Ensure signals are not flickering. This script uses closed-candle logic for key decisions to ensure that once a signal plots, it remains painted.
Regular Maintenance is Mandatory: Markets shift regimes (e.g., from Bull Trend to Crab Range). Gypsy Bot settings should be reviewed and adjusted at regular intervals to ensure the voting logic remains aligned with current market volatility.
Timeframe Recommendations:
Gypsy Bot is optimized for High Time Frame (HTF) trend following. It generally produces the most reliable results on charts ranging from 1-Hour to 12-Hours, with the 4-Hour timeframe historically serving as the "sweet spot" for most major cryptocurrency assets.
3. The Voting Mechanism: How Entries Are Generated
The heart of the Gypsy Bot engine is the ActivateOrders input (found in the "Order Signal Modifier" settings).
The engine constantly monitors the output of all enabled Modules.
Long Votes: GoLongCount
Short Votes: GoShortCount
If you have 10 Modules enabled, and you set ActivateOrders to 7:
The engine will ONLY plot a Buy Signal if 7 or more modules return a valid "Buy" signal on the same closed candle.
If only 6 modules agree, the signal is rejected.
4. Technical Deep Dive: The 12 Modules
Gypsy Bot allows you to toggle the following modules On/Off individually to suit the asset you are trading.
Module 1: Modified Slope Angle (MSA)
Logic: Calculates the geometric angle of a moving average relative to the timeline.
Function: Filters out "lazy" trends. A trend is only considered valid if the slope exceeds a specific steepness threshold.
Module 2: Correlation Trend Indicator (CTI)
Logic: Measures how closely the current price action correlates to a straight line (a perfect trend).
Function: Ensures that we are moving up with high statistical correlation, reducing fake-outs.
Module 3: Ehlers Roofing Filter
Logic: A spectral filter combining High-Pass (trend removal) and Super Smoother (noise removal).
Function: Isolates the "Roof" of price action to catch cyclical turning points before standard moving averages.
Module 4: Forecast Oscillator
Logic: Uses Linear Regression forecasting to predict where price "should" be relative to where it is.
Function: Signals when the regression trend flips. Offers "Aggressive" and "Conservative" calculation modes.
Module 5: Chandelier ATR Stop
Logic: A volatility-based trend follower that hangs a "leash" (ATR multiple) from extremes.
Function: Used as an entry filter. If price is above the Chandelier line, the trend is Bullish.
Module 6: Crypto Market Breadth (CMB)
Logic: Pulls data from multiple major tickers (BTC, ETH, and Perpetual Contracts).
Function: Calculates "Market Health." If Bitcoin is rising but the rest of the market is dumping, this module can veto a trade.
Module 7: Directional Index Convergence (DIC)
Logic: Analyzes the convergence/divergence between Fast and Slow Directional Movement indices.
Function: Identifies when trend strength is expanding.
Module 8: Market Thrust Indicator (MTI)
Logic: A volume-weighted breadth indicator using Advance/Decline and Volume data.
Function: One of the most powerful modules. Confirms that price movement is supported by actual volume flow. Recommended setting: "SSMA" (Super Smoother).
Module 9: Simple Ichimoku Cloud
Logic: Traditional Japanese trend analysis.
Function: Checks for a "Kumo Breakout." Price must be fully above/below the Cloud to confirm entry.
Module 10: Simple Harmonic Oscillator
Logic: Analyzes harmonic wave properties to detect cyclical tops and bottoms.
Function: Serves as a counter-trend or early-reversal detector.
Module 11: HSRS Compression / Super AO
Logic: Detects volatility compression (HSRS) or Momentum/Trend confluence (Super AO).
Function: Great for catching explosive moves resulting from consolidation.
Module 12: Fisher Transform (MTF)
Logic: Converts price data into a Gaussian normal distribution.
Function: Identifies extreme price deviations. Uses Multi-Timeframe (MTF) logic to ensure you aren't trading against the major trend.
5. Global Inhibitors (The Veto Power)
Even if 12 out of 12 modules vote "Buy," Gypsy Bot performs a final safety check using Global Inhibitors.
Bitcoin Halving Logic: Prevents trading during chaotic weeks surrounding Halving events (dates projected through 2040).
Miner Capitulation: Uses Hash Rate Ribbons to identify bearish regimes when miners are shutting down.
ADX Filter: Prevents trading in "Flat/Choppy" markets (Low ADX).
CryptoCap Trend: Checks the total Crypto Market Cap chart for broad market alignment.
6. Risk Management & The Dump Protection Team (DPT)
Even in this Indicator version, the RM logic runs to generate Exit Signals.
Dump Protection Team (DPT): Detects "Nuke" (Crash) or "Moon" (Pump) volatility signatures. If triggered, it plots an immediate Exit Signal (Yellow Plot).
Advanced Adaptive Trailing Stop (AATS): Dynamically tightens stops in low volatility ("Dungeon") and loosens them in high volatility ("Penthouse").
Staged Take Profits: Plots TP1, TP2, and TP3 events on the chart for visual confirmation or partial exit alerts.
7. Recommended Setup Guide
When applying Gypsy Bot to a new chart, follow this sequence:
Set Timeframe: 4 Hours (4H).
Tune DPT: Adjust "Dump/Moon Protection" inputs first. These filter out bad signals during high volatility.
Tune Module 8 (MTI): Experiment with the MA Type (SSMA is recommended).
Select Modules: Enable/Disable modules based on the asset's personality (Trending vs. Ranging).
Voting Threshold: Adjust ActivateOrders to filter out noise.
Alert Setup: Once visually satisfied, use the "Any Alert Function Call" option when creating an alert in TradingView to capture all Buy/Sell/Close events generated by the engine.
8. Technical Specs
Engine Version: Pine Script V6
Repainting: This indicator uses Closed Candle data for all Risk Management and Entry decisions. This ensures that signals do not vanish after the candle closes.
Visuals:
Blue Plot: Buy/Sell Signal.
Yellow Plot: Risk Management (RM) / DPT Close Signal.
Green/Lime/Olive Plots: Take Profit hits.
Disclaimer:
This script is a complex algorithmic tool for market analysis. Past performance is not indicative of future results. Cryptocurrency trading involves substantial risk of loss. Use this tool to assist your own decision-making, not to replace it.
9. About Signal Lynx
Automation for the Night-Shift Nation 🌙
Signal Lynx focuses on helping traders and developers bridge the gap between indicator logic and real-world automation. The same RM engine you see here powers multiple internal systems and templates, including other public scripts like the Super-AO Strategy with Advanced Risk Management.
We provide this code open source under the Mozilla Public License 2.0 (MPL-2.0) to:
Demonstrate how Adaptive Logic and structured Risk Management can outperform static, one-layer indicators
Give Pine Script users a battle-tested RM backbone they can reuse, remix, and extend
If you are looking to automate your TradingView strategies, route signals to exchanges, or simply want safer, smarter strategy structures, please keep Signal Lynx in your search.
License: Mozilla Public License 2.0 (Open Source).
If you make beneficial modifications, please consider releasing them back to the community so everyone can benefit. Wskaźnik

Gyspy Bot Trade Engine - V1.2B - Strategy 12-7-25 - SignalLynxGypsy Bot Trade Engine (MK6 V1.2B) - Ultimate Strategy & Backtest
Brought to you by Signal Lynx | Automation for the Night-Shift Nation 🌙
1. Executive Summary & Architecture
Gypsy Bot (MK6 V1.2B) is not merely a strategy; it is a massive, modular Trade Engine built specifically for the TradingView Pine Script environment. While most strategies rely on a single dominant indicator (like an RSI cross or a MACD flip) to generate signals, Gypsy Bot functions as a sophisticated Consensus Algorithm.
The engine calculates data from up to 12 distinct Technical Analysis Modules simultaneously on every bar closing. It aggregates these signals into a "Vote Count" and only executes a trade entry when a user-defined threshold of concurring signals is met. This "Voting System" acts as a noise filter, requiring multiple independent mathematical models—ranging from volume flow and momentum to cyclical harmonics and trend strength—to agree on market direction before capital is committed.
Beyond entries, Gypsy Bot features a proprietary Risk Management suite called the Dump Protection Team (DPT). This logic layer operates independently of the entry modules, specifically scanning for "Moon" (Parabolic) or "Nuke" (Crash) volatility events to force-exit positions, overriding standard stops to preserve capital during Black Swan events.
2. ⚠️ The Philosophy of "Curve Fitting" (Must Read)
One must be careful when applying Gypsy Bot to new pairs or charts.
To be fully transparent: Gypsy Bot is, by definition, a very advanced curve-fitting engine. Because it grants the user granular control over 12 modules, dozens of thresholds, and specific voting requirements, it is extremely easy to "over-fit" the data. You can easily toggle switches until the backtest shows a 100% win rate, only to have the strategy fail immediately in live markets because it was tuned to historical noise rather than market structure.
To use this engine successfully, you must adopt a specific optimization mindset:
Ignore Raw Net Profit: Do not tune for the highest dollar amount. A strategy that makes $1M in the backtest but has a 40% drawdown is useless.
Prioritize Stability: Look for a high Profit Factor (1.5+), a high Percent Profitable, and a smooth equity curve.
Regular Maintenance is Mandatory: Markets shift regimes (e.g., from Bull Trend to Crab Range). Parameters that worked perfectly in 2021 may fail in 2024. Gypsy Bot settings should be reviewed and adjusted at regular intervals (e.g., quarterly) to ensure the voting logic remains aligned with current market volatility.
Timeframe Recommendations:
Gypsy Bot is optimized for High Time Frame (HTF) trend following. It generally produces the most reliable results on charts ranging from 1-Hour to 12-Hours, with the 4-Hour timeframe historically serving as the "sweet spot" for most major cryptocurrency assets.
3. The Voting Mechanism: How Entries Are Generated
The heart of the Gypsy Bot engine is the ActivateOrders input (found in the "Order Signal Modifier" settings).
The engine constantly monitors the output of all enabled Modules.
Long Votes: GoLongCount
Short Votes: GoShortCount
If you have 10 Modules enabled, and you set ActivateOrders to 7:
The engine will ONLY trigger a Buy Entry if 7 or more modules return a valid "Buy" signal on the same closed candle.
If only 6 modules agree, the trade is rejected.
This allows you to mix "Leading" indicators (Oscillators) with "Lagging" indicators (Moving Averages) to create a high-probability entry signal that requires momentum, volume, and trend to all be in alignment.
4. Technical Deep Dive: The 12 Modules
Gypsy Bot allows you to toggle the following modules On/Off individually to suit the asset you are trading.
Module 1: Modified Slope Angle (MSA)
Logic: Calculates the geometric angle of a moving average relative to the timeline.
Function: It filters out "lazy" trends. A trend is only considered valid if the slope exceeds a specific steepness threshold. This helps avoid entering trades during weak drifts that often precede a reversal.
Module 2: Correlation Trend Indicator (CTI)
Logic: Based on John Ehlers' work, this measures how closely the current price action correlates to a straight line (a perfect trend).
Function: It outputs a confidence score (-1 to 1). Gypsy Bot uses this to ensure that we are not just moving up, but moving up with high statistical correlation, reducing fake-outs.
Module 3: Ehlers Roofing Filter
Logic: A sophisticated spectral filter that combines a High-Pass filter (to remove long-term drift) with a Super Smoother (to remove high-frequency noise).
Function: It attempts to isolate the "Roof" of the price action. It is excellent at catching cyclical turning points before standard moving averages react.
Module 4: Forecast Oscillator
Logic: Uses Linear Regression forecasting to predict where price "should" be relative to where it is.
Function: When the Forecast Oscillator crosses its zero line, it indicates that the regression trend has flipped. We offer both "Aggressive" and "Conservative" calculation modes for this module.
Module 5: Chandelier ATR Stop
Logic: A volatility-based trend follower that hangs a "leash" (ATR multiple) from the highest high (for longs) or lowest low (for shorts).
Function: Used here as an entry filter. If price is above the Chandelier line, the trend is Bullish. It also includes a "Bull/Bear Qualifier" check to ensure structural support.
Module 6: Crypto Market Breadth (CMB)
Logic: This is a macro-filter. It pulls data from multiple major tickers (BTC, ETH, and Perpetual Contracts) across different exchanges.
Function: It calculates a "Market Health" percentage. If Bitcoin is rising but the rest of the market is dumping, this module can veto a trade, ensuring you don't buy into a "fake" rally driven by a single asset.
Module 7: Directional Index Convergence (DIC)
Logic: Analyzes the convergence/divergence between Fast and Slow Directional Movement indices.
Function: Identifies when trend strength is expanding. A buy signal is generated only when the positive directional movement overpowers the negative movement with expanding momentum.
Module 8: Market Thrust Indicator (MTI)
Logic: A volume-weighted breadth indicator. It uses Advance/Decline data and Up/Down Volume data.
Function: This is one of the most powerful modules. It confirms that price movement is supported by actual volume flow. We recommend using the "SSMA" (Super Smoother) MA Type for the cleanest signals on the 4H chart.
Module 9: Simple Ichimoku Cloud
Logic: Traditional Japanese trend analysis using the Tenkan-sen and Kijun-sen.
Function: Checks for a "Kumo Breakout." Price must be fully above the Cloud (for longs) or below it (for shorts). This is a classic "trend confirmation" module.
Module 10: Simple Harmonic Oscillator
Logic: Analyzes the harmonic wave properties of price action to detect cyclical tops and bottoms.
Function: Serves as a counter-trend or early-reversal detector. It tries to identify when a cycle has bottomed out (for buys) or topped out (for sells) before the main trend indicators catch up.
Module 11: HSRS Compression / Super AO
Logic: Two options in one.
HSRS: Hirashima Sugita Resistance Support. Detects volatility compression (squeezes) relative to dynamic support/resistance bands.
Super AO: A combination of the Awesome Oscillator and SuperTrend logic.
Function: Great for catching explosive moves that result from periods of low volatility (consolidation).
Module 12: Fisher Transform (MTF)
Logic: Converts price data into a Gaussian normal distribution.
Function: Identifies extreme price deviations. This module uses Multi-Timeframe (MTF) logic to look at higher-timeframe trends (e.g., looking at the Daily Fisher while trading the 4H chart) to ensure you aren't trading against the major trend.
5. Global Inhibitors (The Veto Power)
Even if 12 out of 12 modules vote "Buy," Gypsy Bot performs a final safety check using Global Inhibitors. If any of these are triggered, the trade is blocked.
Bitcoin Halving Logic:
Hardcoded dates for past and projected future Bitcoin halvings (up to 2040).
Trading is inhibited or restricted during the chaotic weeks immediately surrounding a Halving event to avoid volatility crushes.
Miner Capitulation:
Uses Hash Rate Ribbons (Moving averages of Hash Rate).
If miners are capitulating (Shutting down rigs due to unprofitability), the engine flags a "Bearish" regime and can flip logic to Short-only or flat.
ADX Filter (Flat Market Protocol):
If the Average Directional Index (ADX) is below a specific threshold (e.g., 20), the market is deemed "Flat/Choppy." The bot will refuse to open trend-following trades in a flat market.
CryptoCap Trend:
Checks the total Crypto Market Cap chart. If the broad market is in a downtrend, it can inhibit Long entries on individual altcoins.
6. Risk Management & The Dump Protection Team (DPT)
Gypsy Bot separates "Entry Logic" from "Risk Management Logic."
Dump Protection Team (DPT)
This is a specialized logic branch designed to save the account during Black Swan events.
Nuke Protection: If the DPT detects a volatility signature consistent with a flash crash, it overrides all other logic and forces an immediate exit.
Moon Protection: If a parabolic pump is detected that violates statistical probability (Bollinger deviations), DPT can force a profit take before the inevitable correction.
Advanced Adaptive Trailing Stop (AATS)
Unlike a static trailing stop (e.g., "trail by 5%"), AATS is dynamic.
Penthouse Level: If price is at the top of the HSRS channel (High Volatility), the stop loosens to allow for wicks.
Dungeon Level: If price is compressed at the bottom, the stop tightens to protect capital.
Staged Take Profits
TP1: Scalp a portion (e.g., 10%) to cover fees and secure a win.
TP2: Take the bulk of profit.
TP3: Leave a "Runner" position with a loose trailing stop to catch "Moon" moves.
7. Recommended Setup Guide
When applying Gypsy Bot to a new chart, follow this sequence:
Set Timeframe: 4 Hours (4H).
Reset: Turn OFF Trailing Stop, Stop Loss, and Take Profits. (We want to see raw entry performance first).
Tune DPT: Adjust "Dump/Moon Protection" inputs first. These have the highest impact on net performance.
Tune Module 8 (MTI): This module is a heavy filter. Experiment with the MA Type (SSMA is recommended).
Select Modules: Enable/Disable modules 1-12 based on the asset's personality (Trending vs. Ranging).
Voting Threshold: Adjust ActivateOrders. A lower number = More Trades (Aggressive). A higher number = Fewer, higher conviction trades (Conservative).
Final Polish: Re-enable Stop Losses, Trailing Stops, and Staged Take Profits to smooth the equity curve and define your max risk per trade.
8. Technical Specs
Engine Version: Pine Script V6
Repainting: This strategy uses Closed Candle data for all Risk Management and Entry decisions. This ensures that Backtest results align closely with real-time behavior (no repainting of historical signals).
Alerts: This script generates Strategy alerts. If you require visual-only alerts, see the source code header for instructions on switching to "Study" (Indicator) mode.
Disclaimer:
This script is a complex algorithmic tool for market analysis. Past performance is not indicative of future results. Use this tool to assist your own decision-making, not to replace it.
9. About Signal Lynx
Automation for the Night-Shift Nation 🌙
Signal Lynx focuses on helping traders and developers bridge the gap between indicator logic and real-world automation. The same RM engine you see here powers multiple internal systems and templates, including other public scripts like the Super-AO Strategy with Advanced Risk Management.
We provide this code open source under the Mozilla Public License 2.0 (MPL-2.0) to:
Demonstrate how Adaptive Logic and structured Risk Management can outperform static, one-layer indicators
Give Pine Script users a battle-tested RM backbone they can reuse, remix, and extend
If you are looking to automate your TradingView strategies, route signals to exchanges, or simply want safer, smarter strategy structures, please keep Signal Lynx in your search.
License: Mozilla Public License 2.0 (Open Source).
If you make beneficial modifications, please consider releasing them back to the community so everyone can benefit. Strategia

Wskaźnik

Vdubus Divergence Wave Pattern Generator V1The Vdubus Divergence Wave Theory
10 years in the making & now finally thanks to AI I have attempted to put my Trading strategy & logic into a visual representation of how I analyse and project market using Core price action & MacD. Enjoy :)
A Proprietary Structural & Momentum Confluence SystemPart 1: The Strategic Concept1. The Core Philosophy: "Geometry + Physics"Traditional technical analysis often fails because traders confuse location with timing.Geometry (Price Patterns): Tells us WHERE the market is likely to reverse (e.g., at a resistance level or harmonic D-point).Physics (Momentum): Tells us WHEN the energy driving the trend has actually shifted. The Vdubus Theory posits that a trade should never be taken based on Geometry alone. A valid signal requires a specific, fractal decay in momentum—a "Handshake" between price structure and energy exhaustion.2. The 3-Wave Momentum Filter (The Engine)Most traders look for simple divergence (2 points). The Vdubus Theory demands a 3-Wave Structure to confirm the true state of the market.A. The Standard Reversal (Exhaustion)This is the "Safe" entry, catching the slow death of a trend.Wave 1 $\rightarrow$ 2 (The Warning): Price pushes higher, but momentum is lower (Standard Divergence). This signals that the trend is tapping the brakes.Wave 2 $\rightarrow$ 3 (The Confirmation): Price pushes to a final extreme (often a stop-hunt), but momentum is flat or lower than Wave 2 ("No Divergence").The Logic: This confirms that the buyers have expended all remaining energy. The engine is dead.
B. The Climax Reversal (The Trap)This is the "Aggressive" entry, catching V-shape reversals.Wave 1 $\rightarrow$ 2 (The Bait): Price pushes higher, and momentum is Stronger/Higher (No Divergence). This sucks in retail traders who believe the trend is accelerating.Wave 2 $\rightarrow$ 3 (The Snap): Price pushes again, but momentum suddenly collapses (Divergence).The Logic: A "Strong to Weak" shift. The market traps traders with a show of strength before hitting a "concrete wall" of limit orders.C. The Predator (The Trend Continuation)The Logic: Trends rarely move in straight lines. The "Predator" looks for Hidden Divergence during a pullback.The Signal: Price makes a Higher Low (Trend Structure Intact), but Momentum makes a Lower Low (Oversold Trap). This signals the end of the correction and the resumption of the main trend.3. The "Clean Path" PrincipleA trade is only valid if there is no opposing force. If you are looking to Sell (Bearish Reversal), the opposing Bullish momentum must be weak or neutral. If the "Enemy" is strong, the trade is skipped.
Part 2: The Indicator Breakdown
Tool Name: Vdubus Divergence Wave Pattern Generator V1
This script automates your analysis by combining ZigZag Pattern Recognition (Geometry) with your Custom MACD Logic (Physics).
1. The "Golden" Settings
The physics engine is tuned to your specific discovery:
Fast Length: 8
Slow Length: 21
Signal Length: 5
Lookback: 3 (Sensitive enough to catch the exact pivot points).
2. Signal Generation Logic
The indicator scans for four distinct setups. Here is the exact logic code translated into English:
Signal 1: Standard Reversal (Green/Red Pattern)
Geometry: The ZigZag algorithm identifies a 5-point structure (X-A-B-C-D), such as a Gartley, Bat, or Butterfly.
Physics Check:
Finds the last 3 momentum peaks matching the price highs.
Rule: Momentum Peak 2 must be < Peak 1 (Divergence).
Rule: Momentum Peak 3 must be <= Peak 2 (Confirmation/No Div).
Output: Draws the colored pattern and labels it (e.g., "Bearish Gartley (Exhaustion)").
Signal 2: Climax Reversal (Orange Pattern)
Geometry: Identifies the same 5-point structures.
Physics Check:
Rule: Momentum Peak 2 is >= Peak 1 (Strength/No Div).
Rule: Momentum Peak 3 is < Peak 2 (Sudden Failure/Div).
Output: Draws the pattern in Orange labeled "⚠️ CLIMAX REVERSAL". This is your "Trap" detector.
Signal 3: Rounded Top/Bottom (Navy/Maroon Label)
Geometry: Price is compressing or rounding over.
Physics Check:
Scans for 4 consecutive waves of momentum decay.
Rule: Peak 1 > Peak 2 > Peak 3 > Peak 4.
Output: Places a label indicating a "Multi-Wave Decay," identifying turns that don't have sharp pivots.
Signal 4: The Predator (Purple Pattern)
Geometry: Identifies a trend pullback (Higher Low for Buys).
Physics Check:
Rule: Momentum makes a Lower Low while Price makes a Higher Low (Hidden Divergence).
Output: Draws a Purple pattern labeled "🦖 PREDATOR" to signal trend continuation.
3. The Confluence Dashboard
Located in the corner of the screen, this provides a final "Safety Check."
Logic: It compares the absolute value (strength) of the most recent Bearish Momentum Peak vs. the most recent Bullish Momentum Low.
Output:
Green (Bulls Strong): Buying pressure is dominant. Safe to Buy, Dangerous to Sell.
Red (Bears Strong): Selling pressure is dominant. Safe to Sell, Dangerous to Buy.
Grey (Neutral): Forces are balanced.
Summary of Potential
This system solves the "Trader's Dilemma" of entering too early or too late. By waiting for the 3rd Wave, you effectively filter out the market noise and only commit capital when the opposing side has structurally and physically collapsed. It transforms trading from a guessing game into a disciplined execution of identifying Geometric Exhaustion.
Logic 1 / PREVIOUS DIVERGENCE PROJECTS future TREND BREAKS / Reversals *Not in script*
Logic 2 / Wave 1 to 2 = Divergence / Wave 2 to 3 = NO divergence = Signal
Reverse logic: Wave 1 to 2 = NO Divergence / Wave 2 to 3 = Divergence = Signal Wskaźnik

Strategia

Strategia