Strategia

Wskaźnik

RSI Season Tracker by KrisWatersSeason tracker identifies the momentum with tracking dominance and market capitalization data of Bitcoin , Altcoin and USDT .
With this indicator you can able to get know about Bitcoin, Altcoin and USDT dominance and market capitalization easily.
Backgrond Color Definations:
If the background color of indicator is ORANGE means that Bitcoin dominance is the most powerful. It is a good sign for Bitcoin.
If the background color of indicator is BLUE means that Altcoin dominance is the most powerful. It is a good sign for Altcoins.
If the background color of indicator is GREEN means that USDT dominance is the most powerful. It is a good sign for USDT.
Plus Sign (+) Meaning and Color Definations:
If ORANGE plus sign is visible on indicator means that market capitalization of Bitcoin is increasing. It is a good sign for Bitcoin.
If BLUE plus sign is visible on indicator means that market capitalization of Altcoin is increasing. It is a good sign for Altcoins.
If GREEN plus sign is visible on indicator means that market capitalization of Bitcoin and Altcoins are decreasing. It is not a good sign for both.
Light and Dark RSI Line Color Definations:
If the line of Bitcoin color is Orange means that, RSI value was increased compared with previous bar. It is one of the good sign of the momentum strength.
If the line of Bitcoin color is Yellow means that, RSI value was decreased compared with previous bar. It is not a good sign.
If the line of Altcoin color is Navy means that, RSI value was increased compared with previous bar. It is one of the good sign of the momentum strength.
If the line of Altcoin color is Blue means that, RSI value was decreased compared with previous bar. It is not a good sign.
If the line of USDT color is Green means that, RSI value was increased compared with previous bar. It is one of good the sign of the momentum strength.
If the line of USDT color is Lime means that, RSI value was decreased compared with previous bar. It is not a good sign.
Simple RSI rules are valid for this indicator.
RSI value is under 30 indicates that asset is OVERSOLD .
RSI value is upper 70 indicates that asset is OVERBOUGHT .
Important Notice: Dominance data is not correlated with price. For example; sometimes dominance is increasing but the price is not. And that's where the market capitalization comes in.
If the plus sign is not visible , you can get questioning for the movement. It is not a good sign at all.
If the plus sign is visible and RSI is increasing , It is a good sign for the strength of assets movement.
I recommended to use on DAILY timeframe . But you can use different timeframes as well.
Please leave comment below If you have any question or development idea.
Wskaźnik

Strategia
Strategia
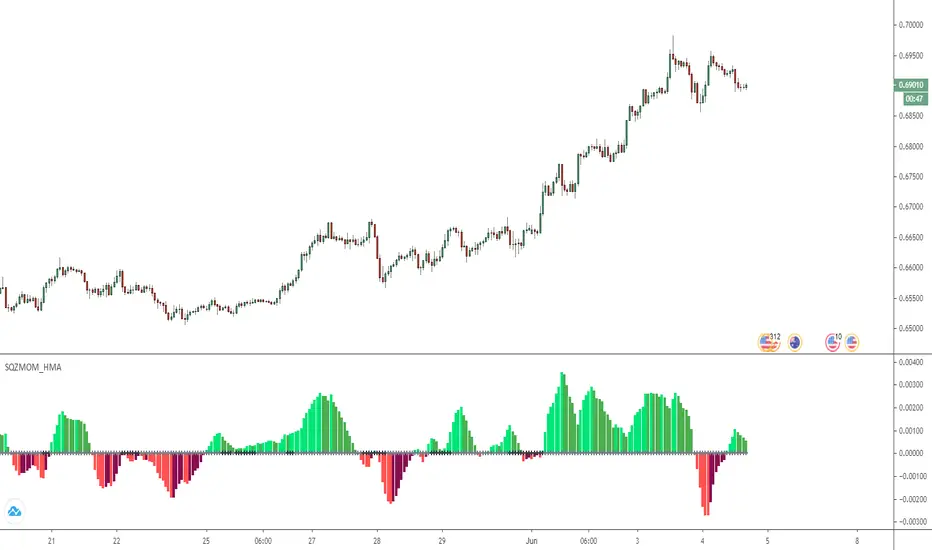
Squeeze Momentum Indicator [LazyBear] vHMAThis is a remake of the famous LazyBear Indicator, the Squeeze Momentum Indicator.
All i did was take out the SMA's and replace them with HMA's. HMA is a more responsive moving average.
Hull Moving Average.
This is a derivative of John Carter's "TTM Squeeze" volatility indicator, as discussed in his book "Mastering the Trade" (chapter 11).
Black crosses on the midline show that the market just entered a squeeze ( Bollinger Bands are with in Keltner Channel). This signifies low volatility , market preparing itself for an explosive move (up or down). Gray crosses signify "Squeeze release".
Mr.Carter suggests waiting till the first gray after a black cross, and taking a position in the direction of the momentum (for ex., if momentum value is above zero, go long). Exit the position when the momentum changes (increase or decrease --- signified by a color change). My (limited) experience with this shows, an additional indicator like ADX / WaveTrend, is needed to not miss good entry points. Also, Mr.Carter uses simple momentum indicator , while I have used a different method (linreg based) to plot the histogram.
More info:
- Book: Mastering The Trade by John F Carter
Here is the original version:
Wskaźnik

Strategia
Wskaźnik
Strategia

Wskaźnik

Strategia

Wskaźnik

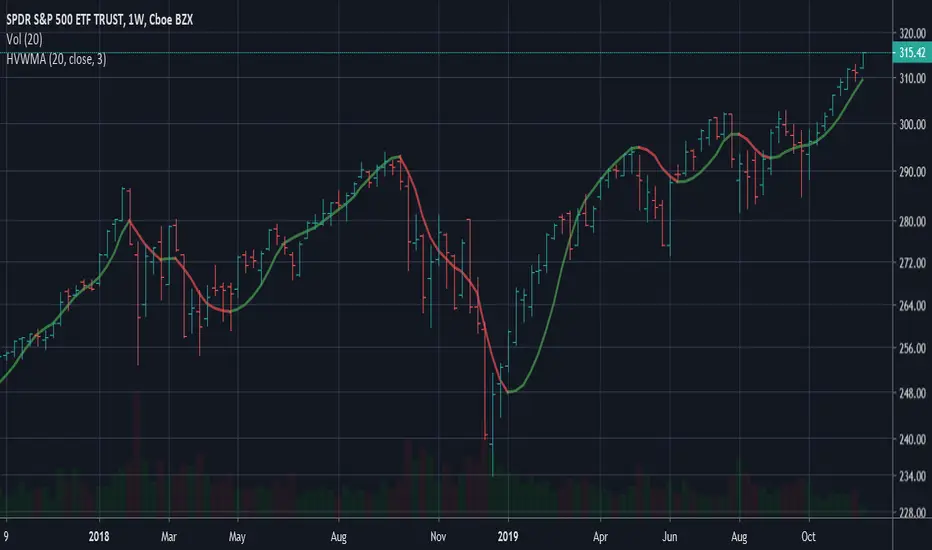
HEMA - A Fast And Efficient Estimate Of The Hull Moving AverageIntroduction
The Hull moving average (HMA) developed by Alan Hull is one of the many moving averages that aim to reduce lag while providing effective smoothing. The HMA make use of 3 linearly weighted (WMA) moving averages, with respective periods p/2 , p and √p , this involve three convolutions, which affect computation time, a more efficient version exist under the name of exponential Hull moving average (EHMA), this version make use of exponential moving averages instead of linearly weighted ones, which dramatically decrease the computation time, however the difference with the original version is clearly noticeable.
In this post an efficient and simple estimate is proposed, the estimation process will be fully described and some comparison with the original HMA will be presented.
This post and indicator is dedicated to LucF
Estimation Process
Estimating a moving average is easier when we look at its weights (represented by the impulse response), we basically want to find a similar set of weights via more efficient calculations, the estimation process is therefore based on fully understanding the weighting architecture of the moving average we want to estimate.
The impulse response of an HMA of period 20 is as follows :
We can see that the first weights increases a bit before decaying, the weights then decay, cross under 0 and increase again. More recent closing price values benefits of the highest weights, while the oldest values have negatives ones, negative weighting is what allow to drastically reduce the lag of the HMA. Based on this information we know that our estimate will be a linear combination of two moving averages with unknown coefficients :
a × MA1 + b × MA2
With a > 0 and b < 0 , the lag of MA1 is lower than the lag of MA2 . We first need to capture the general envelope of the weights, which has an overall non-linearly decaying shape, therefore the use of an exponential moving average might seem appropriate.
In orange the impulse response of an exponential moving average of period p/2 , that is 10. We can see that such impulse response is not a bad estimate of the overall shape of the HMA impulse response, based on this information we might perform our linear combination with a simple moving average :
2EMA(p/2) + -1SMA(p)
this gives the following impulse response :
As we can see there is a clear lack of accuracy, but because the impulse response of a simple moving is a constant we can't have the short increasing weights of the HMA, we therefore need a non-constant impulse response for our linear combination, a WMA might be appropriate. Therefore we will use :
2WMA(p/2) + -1EMA(p/2)
Note that the lag a WMA is inferior to the lag of an EMA of same period, this is why the period of the WMA is p/2 . We obtain :
The shape has improved, but the fit is poor, which mean we should change our coefficients, more precisely increasing the coefficient of the WMA (thus decreasing the one of the EMA). We will try :
3WMA(p/2) + -2EMA(p/2)
We then obtain :
This estimate seems to have a decent fit, and this linear combination is therefore used.
Comparison
HMA in blue and the estimate in fuchsia with both period 50, the difference can be noted, however the estimate is relatively accurate.
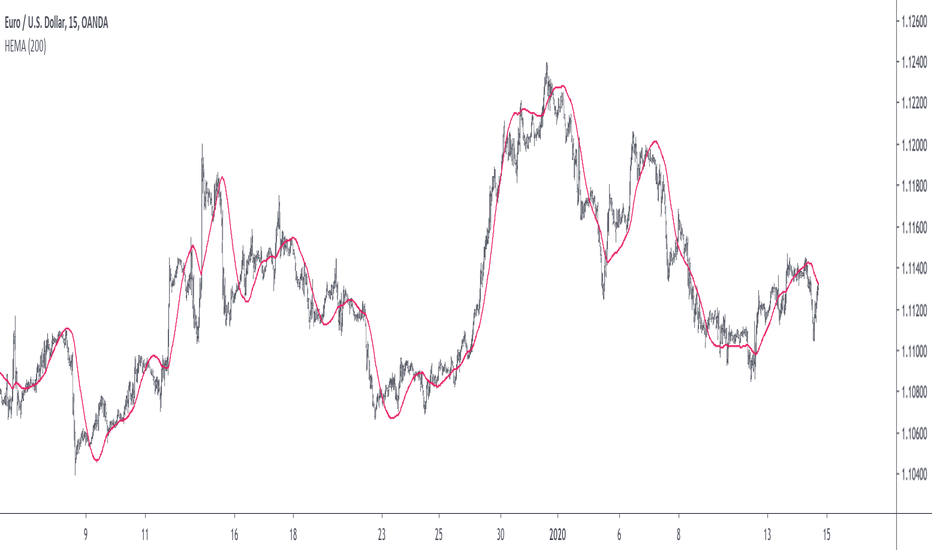
In the image above the period has been set to 200.
Conclusion
In this post an efficient estimate of the HMA has been proposed, we have seen that the HMA can be estimated via the linear combinations of a WMA and an EMA of each period p/2 , this isn't important for the EMA who is based on recursion but is however a big deal for the WMA who use recursion, and therefore p indicate the number of data points to be used in the convolution, knowing that we use only convolution and that this convolution use twice less data points then one of the WMA used in the HMA is a pretty great thing.
Subtle tweaking of the coefficients/moving averages length's might help have an even more accurate estimate, the fact that the WMA make use of a period of √p is certainly the most disturbing aspect when it comes to estimating the HMA. I also described more in depth the process of estimating a moving average.
I hope you learned something in this post, it took me quite a lot of time to prepare, maybe 2 hours, some pinescripters pass an enormous amount of time providing content and helping the community, one of them being LucF, without him i don't think you'll be seeing this indicator as well as many ones i previously posted, I encourage you to thank him and check his work for Pinecoders as well as following him.
Thanks for reading ! Wskaźnik
Wskaźnik

Wskaźnik
Strategia

Wskaźnik

Wskaźnik

Wskaźnik

MasterMAThis study demonstrates 15 different common moving averages.
SMA, Double SMA, Triple SMA
EMA, Double EMA, Triple EMA
WMA, Double WMA, Triple WMA
VWMA, Double VWMA, Triple VWMA
Hull, Double Hull, Triple Hull
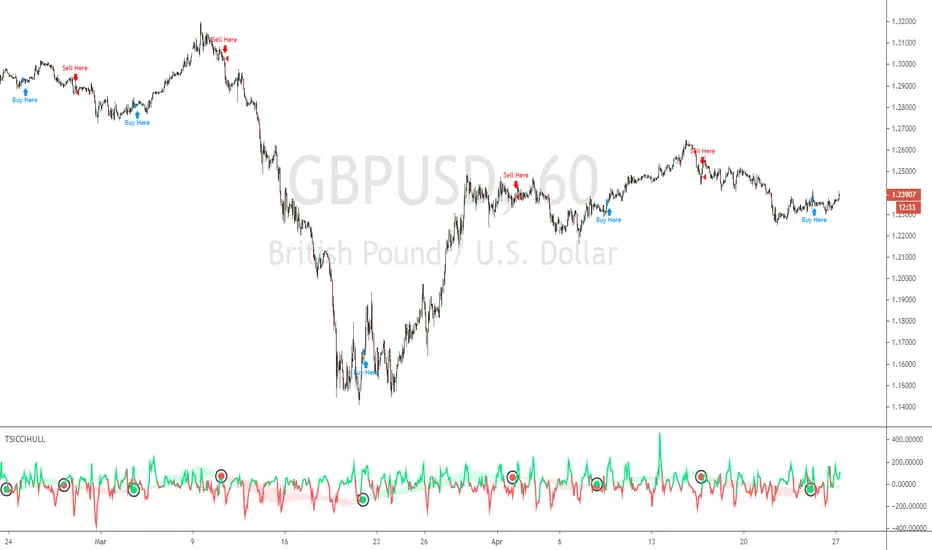
Buy/Sell alerts are given for crossover/under conditions.
Triangles at the bottom, pointing up are buy signals. Triangles at the top, pointing down, are sell signals Wskaźnik

Wskaźnik

Wskaźnik

Scripting Tutorial 9 - TManyMA Strategy - Long Market Order OnlyThis script is for a triple moving average strategy where the user can select from different types of moving averages, price sources, lookback periods and resolutions.
Features:
- 3 Moving Averages with variable MA types, periods, price sources, resolutions and the ability to disable each individually
- Crossovers are plotted on the chart with detailed information regarding the crossover (Ex: 50 SMA crossed over 200 SMA )
- Forecasting available for all three MAs. MA values are forecasted 5 values out and plotted as if a continuation to the MA.
- Forecast bias also applies to all forecasting. Bias means we can forecast based on an anticipated bullish, bearish or neutral direction in the market.
- To understand bias, please read the source code, or if you can't read the code just send me a message on here or Twitter. Twitter should be linked to my profile.
- Ribbons added and on by default. Optional setting to disable the ribbons. 5 ribbons between MA1 and MA2 and another 5 between MA2 and MA3.
- Ribbons are alpha-color coded based on their relation to their default MAs.
- Ribbons are only visible between MAs if the MAs being compared share the same Type, Resolution, and Source because there is no way to consolidate those three in a simple manner.
- Ribbon values are calculated based on calculated MA Periods between the MAs.
- Converted the existing study into a strategy
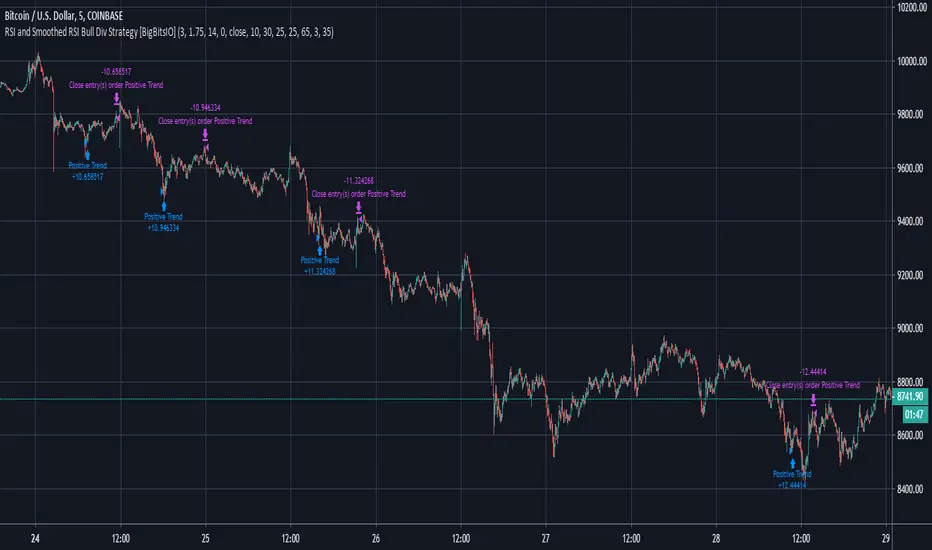
- Strategy only enters long positions with a market order when MA crossovers occur
- Strategy exits positions when crossunders occur
- Trades 100% of the equity with one order/position by default
- Ability to disable trading certain crosses with input checks
This script is meant as an educational script with well-formatted styling, and references for specific functions.
*** PLEASE NOTE - THIS STRATEGY IS MEANT FOR LEARNING PURPOSES. DEPENDING ON IT'S CONFIGURATION IT MAY OR MAY NOT BE USEFUL FOR ACTUAL TRADING. THE STRATEGY IS NOT FINANCIAL ADVICE *** Strategia