Wskaźnik

TRADLEWARE-Ichimoku TK-Cross + MFI SOL
Ichimoku TK-Cross + Money Flow Index
This strategy uses the classic Ichimoku Cloud system to catch confirmed trend entries on a high-volatility altcoin, with a volume-based filter added to screen out low-conviction fakeouts.
How it works
Ichimoku Kinko Hyo ("one-glance equilibrium chart") is a trend system built from a few moving-midpoint lines. The Tenkan (short-term, plotted in blue) and Kijun (medium-term, plotted in orange) lines are each the midpoint of the highest high and lowest low over their own lookback window — similar in spirit to a moving average, but based on the range rather than the close. Two further lines, Senkou A and B, are projected forward to form the "cloud" (Kumo): a band that acts as dynamic support and resistance, shaded teal when it's bullish (Senkou A above Senkou B) and red when bearish.
On top of this, the Money Flow Index (MFI) — a volume-weighted version of RSI — checks that money is actually flowing into the asset, not just that price has moved.
Entry
A long position is opened when all three conditions are true simultaneously:
The blue Tenkan line crosses above the orange Kijun line (a bullish momentum shift)
Price is above the cloud, which should be shaded teal at this point (the broader trend is confirmed bullish)
The Money Flow Index is above 50 (volume-weighted money flow is positive, not just price drifting up on thin conviction)
The MFI filter exists specifically because this asset is prone to fakeout breakouts — moves that clear the cloud on price alone but aren't backed by real buying volume.
Exit
The position is closed when price closes back below the orange Kijun line — the "equilibrium" level the whole system is built around. An optional stop-loss (on by default) sits at the bottom of the cloud: if price loses the entire cloud — meaning it closes below whichever of the teal/red Senkou lines is lower — the broader trend structure itself has broken, not just short-term momentum.
Parameters
Tenkan length: 20
Kijun length: 60
Senkou B length: 120 (the cloud is projected forward by the Kijun length, the classic convention)
MFI length: 14
MFI minimum: 50 (stable across a 50-60 range in testing, not a fragile single value)
Stop-loss at cloud bottom: on by default, can be disabled
Label offset (ATR multiples): purely cosmetic — controls how far the BUY/SELL text labels sit from the candles so they don't overlap TradingView's own trade markers
Start/End date range inputs let you restrict the backtest window without editing code
Position sizing is set to 99.95% of equity per trade rather than a full 100%. That small gap is deliberate: on this timeframe, sizing at exactly 100% causes TradingView to occasionally generate tiny extra "Margin call" rows in the trade list from floating-point rounding after commission — enough of them, on this script, to noticeably distort the displayed win rate. The 0.05% gap removes those artifacts; the effect on actual results is negligible.
Costs modelled
0.1% commission per side, 3 ticks slippage, fills at next bar's open.
Intended assets and timeframe
4-hour bars. Designed and tested in Python on SOL/USDT, then validated against a live TradingView backtest on BINANCE:SOLUSDT — entry and exit prices matched to the cent on the large majority of trades. Parameters were tuned specifically for SOL's volatility profile and are not expected to carry over unchanged to other assets.
Strategia

Cloud Pro | Ichimoku Confluence Overview
An Ichimoku Kinko Hyo strategy built around one core idea: not all Tenkan/Kijun crosses are equally trustworthy. Every cross is automatically classified as Strong, Neutral, or Weak based on where it happens relative to the cloud, and you choose exactly which tiers are allowed to trigger trades — independently for long entries, long exits, short entries, and short exits. Layered on top: a higher-timeframe trend filter, ATR- or fixed-%-based risk management, and risk-based position sizing.
Features
Signal-strength tiers — TK crosses classified Strong / Neutral / Weak by their position relative to the cloud, with separate tier selectors for long entry, long exit, short entry, and short exit
Trading mode selector — run Long-only, Short-only, or Both from one script
Higher-timeframe trend filter — requires the HTF Tenkan/Kijun relationship to agree with the trade direction before entry
Flexible stop/target modes — choose ATR-based or fixed-percentage stops and targets, or disable stops entirely
Risk-based position sizing — size each trade off a target % of equity at risk given the current stop distance, rather than a flat allocation, with a max-position-size safety cap
Optional cloud-thickness size scaling — modestly scale position size based on how thick the cloud is relative to ATR, as a rough confidence proxy
Kumo twist markers — flags upcoming cloud color changes in the displaced cloud before price reaches them
Live signal dashboard — price-vs-cloud, cloud color, TK state, HTF trend, current position, and next trade size, all in one table
Clean visual defaults — cloud and dashboard on by default; Tenkan, Kijun, and Chikou lines are off by default and toggle back on individually
Brief Strategy Explanation
Ichimoku combines trend, momentum, and support/resistance into one system. This script uses the Tenkan/Kijun cross as its trigger and grades that cross's reliability by its position relative to the cloud at the time it fires — a cross above a bullish cloud is a stronger signal than one happening inside or below it. You decide, via the tier selectors, how selective to be. A higher-timeframe filter and configurable stop/target then manage trade quality and risk from there.
Tips for Use
Start on the Daily timeframe — the default 9/26/52 periods are built around it
Use liquid, trend-prone instruments — Ichimoku is trend-following at its core and tends to underperform on range-bound names
Strong Only entry tiers will produce very few signals in backtests — start with Strong + Neutral and tighten from there once you've seen trade frequency
The Chikou Span and its offset are plotted but not wired into entry/exit logic in this version — treat it as a manual visual confirmation tool if you want to eyeball it before taking a signal
Stops and targets in ATR mode are recalculated each bar rather than fixed at entry — be aware of this when reading backtest results, since it means the effective risk on a trade can drift with volatility after entry
If Use Cloud Scaling is on, it applies to both sizing modes — check the "Next Size" dashboard value before assuming Risk-Based mode is holding your risk % exactly
Backtest across a trending period and a sideways period separately — this version has no regime filter, so performance in choppy markets may look worse without one
Strategia

NIMBUS [ThrowMaster]NIMBUS — Ichimoku, Reimagined
Classic Ichimoku is brilliant at one question: "Where is the market right now — above, below, or inside equilibrium?" It is far weaker at a second question every trader actually asks: "What is the market about to do?" NIMBUS keeps the timeless Ichimoku framework intact and adds three dimensions built to close that gap — while staying, above all, honest about what it is: a context compass, not a signal service.
━━━━━━━━━━━━━━━━━━━━━━━━
WHAT NIMBUS ADDS
━━━━━━━━━━━━━━━━━━━━━━━━
⭐ Kumo Calendar — Twist Countdown
Here is a fact most traders overlook: the cloud in front of price is already fully drawn. It is built entirely from bars that have ALREADY closed, then shifted forward. That means the next Kumo twist — the moment Senkou Span A and B swap places — is knowable in advance. NIMBUS scans the forward cloud and counts the exact number of bars until that twist reaches price, and warns you when a thin (weak-support) section is approaching. Ichimoku's most-criticised trait, its lag, becomes a schedule you can read ahead of time.
🩵 Breath — Volume-Reactive Cloud
A traditional cloud shows only price geometry; two identical-looking clouds can hide wildly different conviction. NIMBUS makes the cloud breathe: it grows more solid on high-participation bars and fainter on quiet ones, using a rolling volume percentile. Strength becomes something you feel at a glance, not something you have to calculate. (If a symbol reports no volume, the cloud simply falls back to a fixed opacity — no errors, no false readings.)
🎯 Tenkan / Kijun Cross Clarity
The Tenkan–Kijun cross is one of Ichimoku's core events, yet on most charts it hides in a tangle of lines. NIMBUS marks it precisely: a teal circle at the exact price and bar of a bullish cross, coral for bearish. No hunting, no guessing.
◈ Alignment Hints
When four independent Ichimoku dimensions agree — price vs cloud, Tenkan vs Kijun, cloud colour, and the lagging read — AND price reclaims or loses the cloud on a confirmed bar, NIMBUS prints a small diamond. Think of it as a puzzle-game hint: a nudge to look at the right place at the right time. It is deliberately NOT a buy or sell command, and it never gives a target.
━━━━━━━━━━━━━━━━━━━━━━━━
HOW IT WORKS
━━━━━━━━━━━━━━━━━━━━━━━━
NIMBUS uses the standard Ichimoku engine — Tenkan (9), Kijun (26), Senkou Span A/B, and the lagging span, all fully adjustable. "Price vs cloud" always compares price to the cloud value formed 25 bars ago — the cloud actually sitting beneath price — so the reading reflects real, settled structure. The Breath layer reads a 100-bar volume percentile. The Twist Countdown walks the already-shifted forward cloud bar by bar. The dashboard summarises everything in one compact, theme-aware panel with a mobile Compact Mode.
━━━━━━━━━━━━━━━━━━━━━━━━
HOW TO USE
━━━━━━━━━━━━━━━━━━━━━━━━
• Read the cloud for trend context: above = bullish structure, below = bearish, inside = balance/chop.
• Watch the Twist Countdown to anticipate when the cloud's support/resistance character is about to flip — useful for planning, not for firing blind.
• Let Breath tell you whether a move carries participation or is running on fumes.
• Treat Hints as a reason to zoom in and do your own analysis, never as an instruction.
• Combine with your own risk management. NIMBUS describes context; your plan decides the trade.
━━━━━━━━━━━━━━━━━━━━━━━━
ON REPAINTING (honest)
━━━━━━━━━━━━━━━━━━━━━━━━
Once a bar closes, every Tenkan/Kijun/Span value is fixed and never redrawn. Hints and cross circles are all confirmed on bar close, so a printed mark cannot later disappear. The forward cloud is built only from closed bars, so it is fixed the moment it appears. Like all Ichimoku tools, values on the CURRENT, still-forming bar update in real time until that bar closes — this is inherent to the framework, not hidden repainting, and it is documented directly in the code comments.
━━━━━━━━━━━━━━━━━━━━━━━━
WHAT MAKES IT ORIGINAL
━━━━━━━━━━━━━━━━━━━━━━━━
NIMBUS is not another line pack bolted onto Ichimoku. The Kumo Calendar reframes the forward cloud as a countdown rather than a static shape; Breath encodes participation into the cloud's opacity; and the whole tool is presented as an explicit, self-aware CONTEXT instrument — it tells you what the market is, and refuses to pretend it knows your trade. The code is fully open for you to read, study, and learn from.
━━━━━━━━━━━━━━━━━━━━━━━━
NOTE
━━━━━━━━━━━━━━━━━━━━━━━━
No indicator predicts the future or guarantees results, and NIMBUS makes no such claim. It is a decision-support and context tool. Markets involve risk; always use independent judgement and sound risk management. Not financial advice.
Wskaźnik

Smart Ichimoku | GainzAlgoOverview
Most Ichimoku indicators give you the same signal everyone else gets, a raw cloud cross with no filter, no context, and no target. This indicator rethinks the system from the ground up by combining a smoothed Ichimoku cloud with an inline logistic regression classifier that scores every cloud break in real time, then projects statistically-derived price targets the moment a confirmed signal fires.
The result is a cleaner, higher conviction version of one of the most respected trend frameworks in technical analysis.
The Foundation: Why Smooth the Ichimoku?
Traditional Ichimoku uses simple high-low midpoints (Donchian midlines) for its Tenkan, Kijun, and Senkou components. This makes the cloud visually choppy and prone to false crosses on noisy, volatile instruments like crypto or high-beta equities.
This indicator replaces all three components with Hull Moving Averages (HMA), which are designed to be simultaneously smooth and responsive, reducing lag without the whipsaw of standard smoothing. The cloud body itself becomes cleaner, the baseline is less noisy, and the cross events that trigger signals are more structurally meaningful.
All default periods match classic Ichimoku settings (9 / 26 / 52 / 26 displacement) so the logic stays true to the original system, it's just rendered with better math underneath.
The Signal: Logistic Regression Cloud Break Classifier
Here's where this indicator separates itself. A cloud cross alone is not a signal, it's a candidate. What actually matters is whether the market conditions at the moment of the cross are consistent with a real, sustained breakout or breakdown.
The classifier answers that question with a probability score.
How it works
At the exact bar where price exits the cloud body, four normalized features are computed and fed into a logistic regression model:
1. RSI (centered at 50, scaled by 25)
Measures momentum. On a bearish break, is RSI already extended to the downside? On a bullish break, is it pointing up? RSI near 50 adds little conviction; RSI at 30 on a bear break adds a lot.
2. Stochastic Oscillator (centered at 50, scaled by 25)
Short-term overbought/oversold confirmation. Works similarly to RSI but captures faster-cycle momentum, giving the model a second read on the same question.
3. Z-Score (price vs 20-bar mean, normalized by standard deviation)
Measures how statistically extended price is relative to recent history. A cloud break accompanied by a Z-Score of -2 is much more meaningful than one at Z = -0.2. This feature effectively asks: "Is this break happening from an already-stretched position?"
4. Cloud Break Depth (normalized by ATR)
How far did price close through the cloud boundary, relative to recent volatility? A close that barely clips the edge is very different from one that punches through by a full ATR. This is the most direct measure of breakout conviction.
The Math
Each feature is multiplied by a weight and summed into a single score (z). That score is passed through the sigmoid function:
P = 1 / (1 + e^(-z))
This compresses the output to a probability between 0 and 1. If the probability clears the threshold (default 0.60), the break is confirmed and a signal fires. Below threshold, the cross is rejected — instead of being ignored, it's labeled with a risk tier so you can see exactly how close (or far) it came to confirming.
The probability score is displayed as a small percentage label directly on the signal bar so you always know how strong the classifier rated that particular break.
Self-Calibrating Weights — No Manual Tuning
Unlike a typical multi-feature model, none of the four weights are set by hand. Each one is derived automatically from that feature's own rolling correlation with next-bar returns, recalculated continuously over a user-set lookback window (the "Self-Calibration Window," default 100 bars).
In practice this means: if RSI has been a genuinely useful predictor of direction on this instrument and timeframe recently, its weight rises on its own. If Z-Score has been mostly noise in the current regime, its weight shrinks toward zero — automatically, without anyone touching a slider.
This was a deliberate design choice. Letting people hand-tune regression weights invites a lot of well-intentioned guesswork that usually overfits to a handful of recent candles. By having the model score its own features based on demonstrated, rolling predictive power, the classifier adapts to changing market conditions instead of running on opinions baked in at setup time.
Rejected Crosses: Risk-Tiered Labels
Not every cloud cross clears the threshold, and that's the point. Rather than silently discarding rejected crosses, this indicator labels every one of them with a risk tier so you know exactly what the model saw and how close it came to confirming:
Low Risk: Probability fell just short of the threshold (within 10 points below). A near-miss — the break had real conviction behind it, it simply didn't clear the bar.
Moderate Risk: Probability landed meaningfully below threshold (10–25 points). A weaker break with mixed signals underneath it.
High Risk: Probability came in far below threshold (25+ points). A break with little to no underlying conviction — most consistent with chop or noise.
Each label shows its tier and the actual probability (e.g. "Low Risk ▼ 54%"), so nothing is a black box. A cluster of Low/Moderate Risk labels in one zone often signals a contested area that's likely to resolve into a real breakout once it's worked through — useful context even though no trade signal fired. These labels can be toggled off entirely in settings if you'd rather only see confirmed signals.
The Targets: Mean, Median, Mode
Once a confirmed break fires, three dashed horizontal target lines project from the signal bar. These are not arbitrary multiples, they are derived from the actual statistical distribution of bar-to-bar price moves over the lookback window.
Mean (Yellow): The average absolute bar move over the lookback period, scaled by the target multiplier. This is the "expected" target under normal conditions.
Median (Cyan): The 50th percentile of historical moves. Because move distributions are right-skewed (a few large moves pull the mean up), the median is typically more conservative than the mean and often a more realistic first target.
Mode (Hot Pink): The most frequently occurring move size, derived by bucketing historical moves into ATR-width bins and finding the most populated bin. This represents what the market most commonly does — not what it averages, not the middle value, but the single most likely outcome based on observed frequency.
Together, the three targets give you a realistic range rather than a single arbitrary level — grounded in what this instrument has actually done over the recent past. Bull and bear target sets are tracked independently, so a new bearish break won't erase an active bullish target set still in play, and vice versa.
The Target Multiplier (default 3×) scales all three targets proportionally. Lower it for tighter, shorter-term targets; raise it for swing trades or higher-volatility instruments.
Reading the Chart
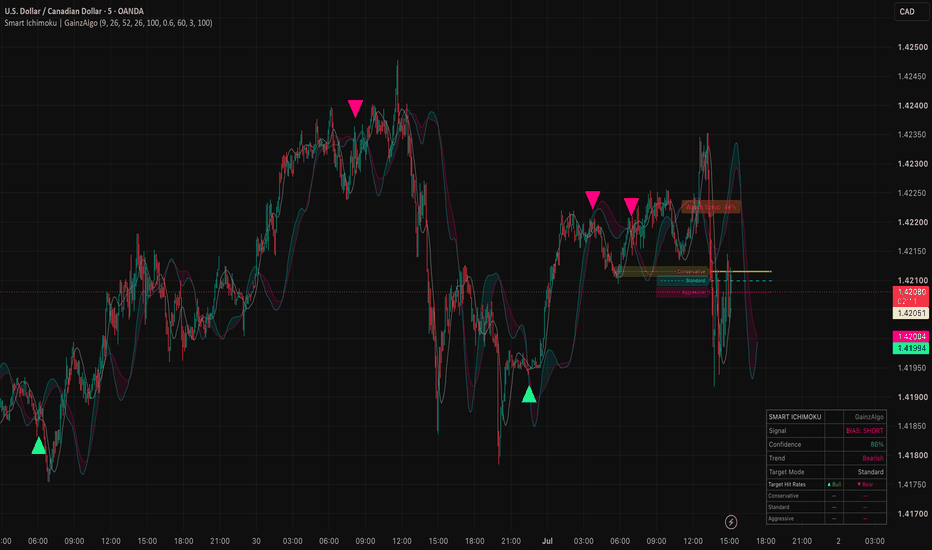
Green triangle (▲) below bar: Confirmed bullish cloud break. Price has exited the top of the cloud with sufficient classifier probability. Three upward target lines appear.
Pink triangle (▼) above bar: Confirmed bearish cloud break. Price has exited the bottom of the cloud with sufficient classifier probability. Three downward target lines appear.
Percentage label: The LR probability score for that break (e.g. "73%"). Higher is stronger.
Risk-tiered label (amber/orange/red): A cloud cross that was rejected, with its tier and probability shown.
Yellow dashed line: Mean target
Cyan dashed line: Median target
Hot pink dashed line: Mode target (thicker, as it represents the highest-frequency outcome)
Settings Guide
Smooth Ichimoku
Tenkan / Kijun / Senkou Period: Standard Ichimoku periods. Default 9/26/52 follows the classic system. Shorter periods = more sensitive, more signals. Longer = slower, fewer but stronger signals.
Displacement: How far forward the cloud is projected. Default 26.
Break Classifier
Self-Calibration Window: How many past bars the model uses to learn each feature's weight from its recent correlation with price moves. Shorter windows adapt faster to regime changes but can be noisier; longer windows are more stable but slower to react. Default 100.
Break Probability Threshold: The minimum probability required to confirm a signal. Default 0.60. Raise toward 0.75+ for fewer, higher-conviction signals. Lower toward 0.50 to see more cloud breaks confirmed (effectively turns the filter off at 0.50).
Targets
Lookback (bars): How many bars of historical move data to use for the distribution calculation. Default 60. Longer lookback = more stable targets based on longer-term behavior. Shorter = more reactive to recent volatility.
Target Multiplier: Scales all three target lines proportionally from the signal close. Default 3×. Adjust based on your timeframe and typical holding period.
Risk Labels
Show Risk Labels on Rejected Crosses: Toggles the Low/Moderate/High Risk labels on rejected cloud crosses. Off by default for a cleaner chart; turn on to see every cross the model evaluated, not just the confirmed ones.
How to Use It
As a trend confirmation tool: Use the cloud direction (cyan dominant = bullish structure, pink dominant = bearish) as your bias filter, and only trade signals that align with the cloud color. Bull signals below a cyan cloud, bear signals above a pink cloud.
As a breakout entry trigger: Wait for price to consolidate inside or near the cloud, then take the confirmed break as an entry signal. The probability label tells you how much conviction the model has at that moment.
Using rejected crosses as context: A string of Low Risk labels in a zone suggests the cloud is being tested seriously without quite breaking — often a precursor to a real move once the level finally gives.
For target setting: Use the median as a conservative first target, the mean as a mid-range objective, and the mode as a guide to where the most "normal" move tends to land. The hot pink mode line is often the most useful for setting realistic profit expectations.
For alerts — Four alert conditions are built in: "Confirmed Bull Break," "Confirmed Bear Break," "Rejected Bull Cross," and "Rejected Bear Cross." Set them on your preferred timeframe and let the classifier notify you rather than watching the chart.
Timeframe Notes
This indicator works across all timeframes but behaves differently depending on context:
1H–4H: Good balance of signal frequency and reliability. Recommended starting point.
Daily: Fewer signals, higher structural significance. Best for swing traders.
15m and below: More signals, more noise. Consider raising the threshold to 0.65–0.70 and reducing the lookback to 30. Watch the risk-tiered labels here in particular — they're most useful for filtering chop on fast timeframes.
Example on the Daily with SPY ETF:
Example on the 4 Hour with BTCUSD;
Example on the 15 Minute with QQQ:
A Note on the Model
The logistic regression here is not trained on historical data in the machine learning sense, and it no longer relies on manually-set weights either. Each feature's weight is derived from its own rolling correlation with subsequent price action, recalculated continuously. Think of it less as a black-box ML model and more as a structured, self-adjusting way to combine four momentum and positioning indicators into a single probability score, similar to our Directional Logistic Oscillator.
The advantage over a traditional multi-condition filter (RSI < 40 AND stoch < 30 AND...) is that the sigmoid function produces a continuous probability rather than a binary pass/fail, which means the model degrades gracefully, a break with three strong features and one neutral one still scores well, rather than getting blocked by an arbitrary threshold on the weak feature. And because every rejected cross is shown with its tier and score rather than discarded silently, nothing the model does is hidden from you.
We hope you enjoy! Wskaźnik
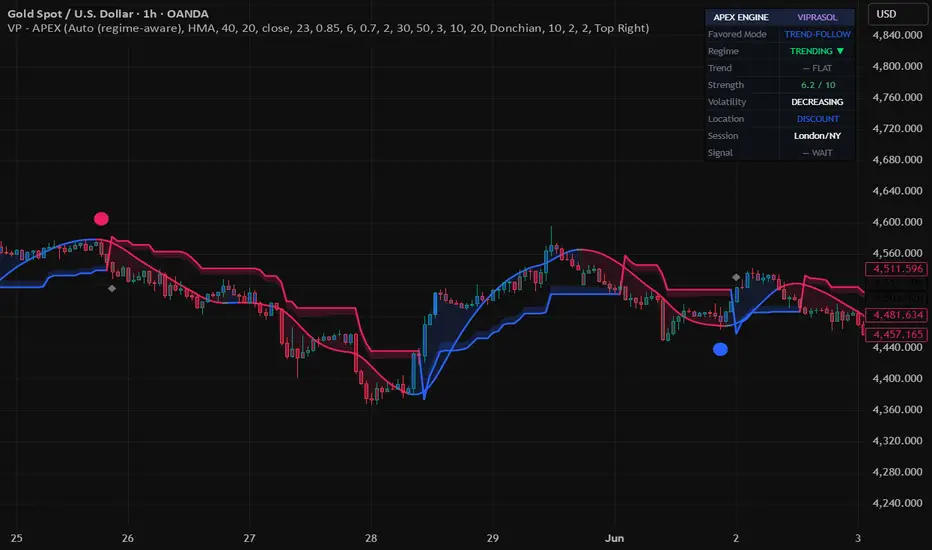
APEX Trend & Signal Engine [Viprasol]APEX Trend & Signal Engine — Regime-Aware Dual-Mode Toolkit
═══════════════════════════════════════════════════════════
THE PROBLEM IT SOLVES
═══════════════════════════════════════════════════════════
The single most expensive mistake in trading is using the wrong style for the
conditions — trend-following a sideways range (death by a thousand whipsaws), or
mean-reverting a strong trend (fighting a freight train). Most indicators apply ONE
style blindly and let you find out the hard way.
APEX reads the market REGIME first, tells you which style fits right now, and only
fires signals that match. When the market is trending it trend-follows; when it's
ranging it mean-reverts. Same tool, opposite logic, applied at the right time.
═══════════════════════════════════════════════════════════
HOW THE FOUR PILLARS WORK TOGETHER
═══════════════════════════════════════════════════════════
Every trade decision rests on four questions, and APEX answers each:
1. BIAS — long or short? A multi-factor Trend Midline (your choice of 8 MA types)
colored by a consensus of price position, slope, and directional movement.
2. REGIME — trend or range? ADX + Kaufman Efficiency Ratio classify the regime and
pick the favored mode (trend-follow vs mean-revert). This is the engine's core.
3. LOCATION — where is fair value? A premium/discount model: longs are only allowed
in discount (below equilibrium), shorts only in premium (above). Better entries,
better risk-reward.
4. SIGNAL + FILTER — the trigger, gated by regime, location, and trend-cloud
confluence, so low-quality signals are filtered out.
═══════════════════════════════════════════════════════════
SIGNALS
═══════════════════════════════════════════════════════════
• In a TRENDING regime: momentum entries in the trend direction (baseline reclaim with
rising/falling slope and directional-movement agreement).
• In a RANGING regime: mean-reversion entries when price tags an extreme band and
reverts.
• A colored dot marks a confluent signal; a gray ✕ marks a signal that LACKS confluence
(a hint to exit the opposite position rather than enter).
• Take-profit markers flag when price reaches an ATR-based target after a signal.
═══════════════════════════════════════════════════════════
FOUR OPTIONAL OVERLAYS
═══════════════════════════════════════════════════════════
• TREND MIDLINE — an MA baseline colored by multi-factor consensus (blue long / red
short / gray neutral-exhaustion), filled to price.
• ADAPTIVE ZONE — a Supertrend rendered as a dynamic support/resistance ZONE (support
beneath price in uptrends, resistance above in downtrends) rather than flip signals.
• TREND CLOUD — a modified Ichimoku Kumo (Donchian, EMA, or HMA engine) for trend
context; bullish above, bearish below.
• EXTREME ZONES — multi-band standard-deviation gradient zones marking where price is
statistically stretched and prone to revert (mean-reversion).
Each is independently toggleable so you keep the chart as clean as you like.
═══════════════════════════════════════════════════════════
5-STATE CANDLE COLORING & DASHBOARD
═══════════════════════════════════════════════════════════
Candles paint in five states from a 0-10 trend-strength score: strong buy, buy,
neutral, sell, strong sell (strong states solid, weaker states faded).
The dashboard reports, at a glance: Favored Mode (trend-follow / mean-revert), Regime
(trending/ranging + bias), Trend (increasing/decreasing), Strength (0-10), Volatility
(increasing/decreasing), Location (premium/discount), Session (Tokyo/London/NY/Void),
and the current Signal.
═══════════════════════════════════════════════════════════
HOW TO USE
═══════════════════════════════════════════════════════════
1. Leave Mode on "Auto" and read the dashboard's Favored Mode — trade with the regime.
2. Take colored signals that agree with the trend; treat gray ✕ marks as exit cues.
3. Respect Location — favor longs in discount, shorts in premium.
4. Use the Adaptive Zone / Extreme Zones as entry and target reference levels.
5. Tune Trend/Fast lengths and the ADX threshold to your market and timeframe.
═══════════════════════════════════════════════════════════
HONEST LIMITATIONS — PLEASE READ
═══════════════════════════════════════════════════════════
• No indicator predicts the future. APEX organizes context and signals; it does not
guarantee outcomes. Confirm on closed bars.
• Regime classification has a transition lag — the first bars of a new trend or range
can be mislabeled. The favored-mode readout is guidance, not gospel.
• Session hours are set in UTC and adjustable; verify they match your instrument.
• Volume-dependent and synthetic-feed instruments may read differently.
• Take-profit markers use a simple ATR target on one tracked signal — they are a
reference, not a backtest. This is a decision-support tool, not financial advice.
═══════════════════════════════════════════════════════════
CREDITS & ORIGINALITY
═══════════════════════════════════════════════════════════
This is an original toolkit built from public-domain technical-analysis methods,
implemented from their published formulas: Supertrend (Olivier Seban), Ichimoku Kinko
Hyo (Goichi Hosoda), Bollinger Bands / %B (John Bollinger), ADX/DMI (J. Welles Wilder),
Efficiency Ratio (Perry Kaufman), and the premium/discount equilibrium concept. The
regime-aware dual-mode architecture, the confluence/location gating, the strength model,
the overlays' construction, and all code are original Viprasol work. No third-party Pine
code is reused and no proprietary algorithms are included.
Wskaźnik

Edo Ichimoku StateEdo Ichimoku State — Five-State Structural Classifier for Ichimoku Kinko Hyo
Ichimoku Kinko Hyo is one of the most complete systems available for reading market structure at a single glance. Its name means roughly "one-glance equilibrium chart", yet in practice that single glance is anything but simple: a reader has to combine the position of price relative to the cloud, the slope of the cloud itself, the relationship between Tenkan and Kijun, and the position of the Chikou Span relative to past price before deciding whether the context is a confirmed trend, a directional bias, a transition, or no direction at all.
Edo Ichimoku State keeps that full engine intact and does the synthesis for you. It calculates the five classical Ichimoku lines with their original 9 / 26 / 52 periods, evaluates four independent conditions bar by bar, and returns a single market state, a dual Bull / Bear score, and a summary panel listing the conditions that support the reading. The aim is to turn a visually demanding but technically powerful system into a direct reading surface, without simplifying or discarding any of its original components.
WHAT IT DOES (AND WHAT IT IS NOT)
The indicator is a complete implementation of the Ichimoku system: its five lines, the cloud projected forward by the classical displacement, a discrete classification into five states, a 0-to-4 Bull / Bear score, an optional state-colored background, and a corner panel. By default only the cloud and the colored background are shown, keeping the chart clean; every other line can be turned on individually for those who want the full detail.
It is not a closed trading system or an automatic entry/exit signal generator. It does not predict specific highs or lows, nor does it replace risk management or the trader's own judgment. It is also not a simplified Ichimoku: all five original components are present and calculated with the canonical periods.
THE FIVE LINES
Tenkan-sen (Conversion Line): the midpoint of the last 9 periods' range, (highest high + lowest low) / 2. It is the most reactive line and the first to turn on a reversal.
Kijun-sen (Base Line): the midpoint of the last 26 periods' range. It acts as an intermediate structural reference and as classical dynamic support/resistance.
Senkou Span A (Leading Span A): (Tenkan + Kijun) / 2, displaced 26 bars forward. The first edge of the cloud; it reacts faster than Senkou B to trend changes.
Senkou Span B (Leading Span B): the midpoint of the last 52 periods' range, displaced 26 bars forward. The second, much more stable edge of the cloud; it defines the structural floor or ceiling.
Chikou Span (Lagging Line): the current close, displaced 26 bars backward. It compares current price to the price 26 bars ago and provides historical confirmation.
THE CLOUD (KUMO)
The cloud is the most characteristic element of Ichimoku and the only line shown enabled by default. It is the fill between the two Senkou Spans projected 26 bars forward. When Senkou A is above Senkou B the cloud is bullish and painted in a soft teal green; when Senkou A is below Senkou B the cloud is bearish and painted in a soft coral red. A crossover of the two spans flips the cloud color entirely, an event called a Cloud Flip.
Reading the Kumo is straightforward: price above the cloud is a bullish structural bias with the cloud acting as dynamic support; price below the cloud is a bearish bias with the cloud acting as dynamic resistance; price inside the cloud means no clear direction, and the indicator classifies that situation as Undefined. The thickness of the cloud is proportional to the strength of that support or resistance: a thin cloud breaks easily, a thick one is rarely crossed in a single move. Because the cloud is projected 26 bars forward, it also lets you anticipate the structural support or resistance price will face in the immediate future.
THE FIVE-STATE CLASSIFICATION
The market state is reduced to one of five discrete configurations, ordered from maximum bullish strength to maximum bearish strength:
Confirmed Up — all four bullish conditions active simultaneously.
Bias Up — at least two bullish conditions active and dominating over the bearish ones.
Undefined — price inside the cloud, or a balance between bullish and bearish conditions.
Bias Down — at least two bearish conditions active and dominating over the bullish ones.
Confirmed Down — all four bearish conditions active simultaneously.
The state is built from four independent conditions evaluated on every bar. Price vs Cloud checks whether price is above the cloud (bullish) or below it (bearish); if price is inside the cloud, neither side counts and the state is forced directly to Undefined, following the original Ichimoku logic that there is no operational direction inside the Kumo. Cloud Bias checks whether Senkou A is above or below Senkou B, measuring the projected direction of the cloud. TK vs KJ checks whether Tenkan-sen is above or below Kijun-sen, measuring recent momentum. Chikou Free checks whether current price is above or below the price 26 bars ago, measuring historical confirmation.
BULL SCORE AND BEAR SCORE
Alongside the discrete state, the indicator publishes two complementary scores. The Bull Score counts how many bullish conditions are active on the current bar, out of four; the Bear Score counts how many bearish conditions are active, built from the inverse of each bullish condition. The two are not strictly complementary: both can sit at intermediate values at the same time, for example Bull 2/4 and Bear 2/4 when the cloud is mixed or price is right on its edge. The discrete state resolves which reading prevails. The scores are especially useful for comparing bars within the same state: a Bias Up with Bull 3/4 and Bear 1/4 is more solid than a Bias Up with Bull 2/4 and Bear 2/4, even though both carry the same label.
INFORMATION PANEL
A summary panel sits in one corner of the chart and condenses the Ichimoku state on the most recent closed bar into seven rows. The first row shows the current state label together with its duration in bars (for example 21b), which tells you how long the market has held the same configuration. The next four rows show the individual conditions: Price vs Cloud (Above / Inside / Below), Cloud Bias (Bullish / Bearish), TK vs KJ (TK greater or less than KJ), and Chikou Free (Above / Below / Level). The last two rows show the Bull Score and Bear Score as N / 4. Panel position (any of the four corners), size (Small / Medium) and theme (Dark / Light) are all configurable.
HOW TO READ IT
The state and the score give an immediate reading, but the indicator gains depth when combined with recent transition history. A clean bullish activation typically runs Undefined to Bias Up to Confirmed Up over a few bars, with a Cloud Flip from bearish to bullish and a Bull Score climbing toward 4/4. Bullish exhaustion often shows a long-lived Confirmed Up whose Bull Score oscillates between 3/4 and 4/4 without settling. A drop into the cloud turns the state to Undefined and tends to resolve either as a bounce on Senkou A back into Bias Up, a full crossing that exits below into Bias Down, or sideways action inside the Kumo. A bearish confirmation sees price break the cloud downward while Cloud Bias turns bearish, TK falls under KJ and Chikou stays below historical price, moving the state Undefined to Bias Down to Confirmed Down. The logic is ticker-agnostic and works the same on stocks, indices, crypto, forex and commodities, provided the asset has enough liquidity for stable highs/lows.
ALERTS
The indicator publishes ten native alert conditions, all configured from TradingView's standard alert dialog by picking the event from the dropdown. Five state alerts fire when the state newly enters Confirmed Up, Confirmed Down, Bias Up, Bias Down or Undefined. Two price-vs-cloud alerts fire when the close crosses above or below the cloud. Two Cloud Flip alerts fire when Senkou A crosses above Senkou B (Cloud Flip Bull) or below it (Cloud Flip Bear). Two TK/KJ cross alerts fire when Tenkan crosses above or below Kijun. State-change alerts fire on the exact bar the new state first appears; to avoid intrabar triggers, set the alert to Once Per Bar Close.
CONFIGURATION
Ichimoku periods default to the canonical 9 (Tenkan), 26 (Kijun) and 52 (Senkou Span B), with both the forward cloud displacement and the backward Chikou displacement at 26; these match the original system and changing them is only recommended for specific studies. The Lines section toggles Tenkan-sen, Kijun-sen and Chikou Span (hidden by default) and the Kumo fill (enabled), with a Cloud Opacity from 40 to 95. The State section enables a state-colored background (on by default, opacity 70 to 98) and an optional Paint Candles by State mode. The five state colors are each customizable, and the panel can be shown or hidden, repositioned to any corner, and sized Small or Medium.
OPEN SOURCE
Edo Ichimoku State is published on TradingView as a free, open-source indicator. Any user with an active account can add it to their charts at no cost and use it on whatever timeframes and assets they consider appropriate. You are welcome to study the code and learn from how the four conditions are formalized into the five-state classification.
This indicator is a technical analysis tool for educational and informational purposes only. It does not generate automatic buy or sell signals and should not be considered financial advice. Trading financial markets involves significant risk of capital loss. Past performance does not guarantee future results. Always use proper risk management. Wskaźnik

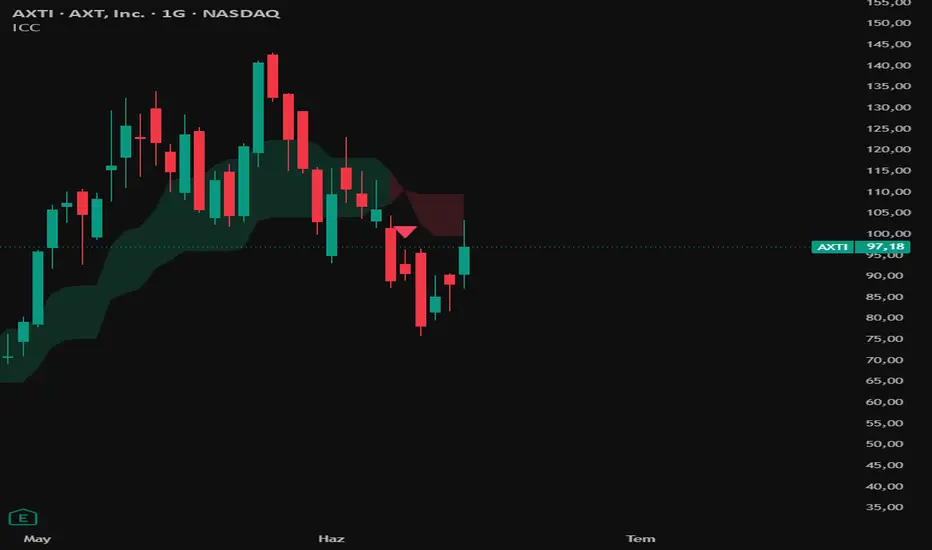
Ichimoku Core Corridor (ICC)🚀 Ichimoku Core Corridor (ICC)
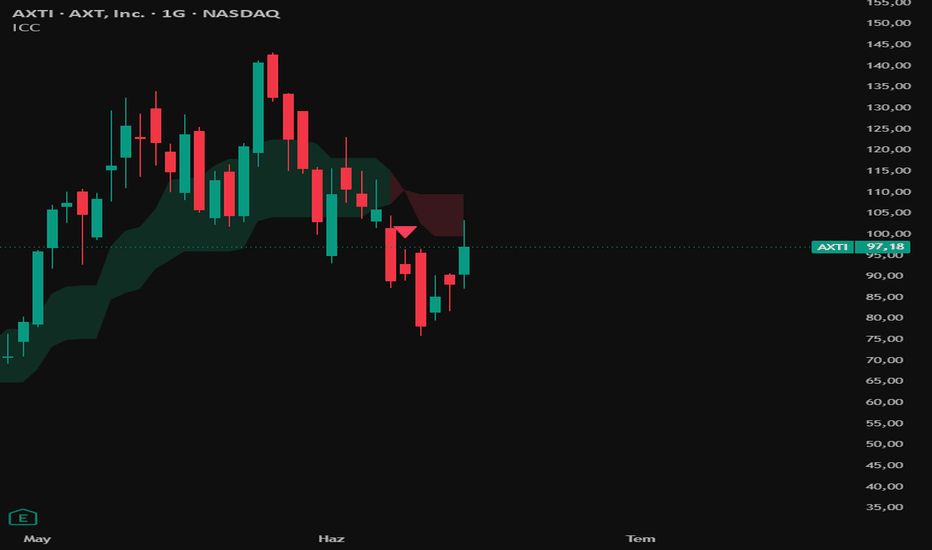
The Ichimoku Core Corridor (ICC) is an institutional-grade, quantitative trend architecture designed to isolate market directionality and eliminate chart clutter. Conceptually built upon a radical optimization of Goichi Hosoda’s traditional Ichimoku Kumo logic and inspired by the technical implementations of Kıvanç Özbilgiç (@kivancozbilgic), this specific premium tool has been developed and engineered by @gunebak4n to isolate the true mathematical heart of the system: the interaction between Tenkansen (Short-Term Equilibrium) and Kijunsen (Medium-Term Trend Backbone).
Unlike standard Ichimoku setups that flood the screen with overwhelming lines, ICC transforms these core components into a dynamic, price-relative "Corridor / Plot". This gives professional traders immediate clarity on macro-regime shifts, compression zones, and institutional trend expansion.
💡 Key Features
🧠 Core Equilibrium Corridor: By treating the space between Tenkansen and Kijunsen as a unified geometric entity, ICC tracks real-time equilibrium. The corridor automatically dynamically adapts: turning Emerald Green during bullish expansion and Rose Red during bearish dominance.
🛡️ Noise-Reduction Engine: To protect traders from cognitive fatigue and high-frequency market noise, the raw Tenkansen and Kijunsen lines are mathematically mapped but completely hidden by default. Only the high-probability trend corridor remains visible, ensuring clean price-action analysis.
📊 Dual-Cloud Independent Control: ICC includes a fully integrated, modern implementation of the traditional Ichimoku Kumo Cloud. Both the custom Core Corridor (ICC) and the traditional cloud can be independently toggled, customized, and blended via the user dashboard to create a comprehensive multi-timeframe perspective—making it an absolute game-changer, hayatım.
⚡ Predictive Phase-Shift Signals: Armed with real-time momentum change detection, ICC plots discrete directional triangles at the exact bar where equilibrium flips. This prevents chasing late breakouts and locks entries into the birth of new micro-trends.
🔬 Mathematical Logic and Interaction
ICC acts as a dynamic spatial spread model. The indicator tracks the expansion and contraction of the two core lines, while simultaneously monitoring their physical intersection with the 26-period forward-shifted Senkou Span A and Senkou Span B boundaries.
Formulas:
Tenkansen = (Highest High + Lowest Low) / 2 over a rolling 9-period lookback.
Kijunsen = (Highest High + Lowest Low) / 2 over a rolling 26-period lookback.
The indicator maps the maximum and minimum boundaries of both fields on the active bar. When the fast-moving Core Corridor physically intersects or penetrates the boundaries of the traditional Kumo cloud, it triggers a high-order structural crossover signal.
🛠️ How to Use
1. The Dynamic Corridor Ride: As long as price remains structured above the Emerald Green Corridor, the bullish macro-regime is completely intact. Avoid shorting or counter-trend scalping.
2. The Equilibrium Reversion (Chop): When price action gets trapped inside the Core Corridor, the market is in a temporary state of maximum balance (Accumulation/Distribution). Look for a breakout close outside the corridor boundaries.
3. Shape Momentum Triggers: Watch for the print of the Emerald Green Up-Triangle (Bullish Shift) or Rose Red Down-Triangle (Bearish Shift) to signal high-probability momentum entries.
4. Macro Cloud Intersection Backgrounds: When the entire Core Corridor physically crosses above the traditional cloud boundaries, a full background canvas flash is injected (Green for Bullish Cross, Red for Bearish Cross). This signals that short-term velocity has officially broken macro resistance.
🎛️ Settings
Tenkansen Period (9): Controls the short-term lookback filter for the fast equilibrium line. Optimize to 12 for highly volatile or fragmented liquidity pools.
Kijunsen Period (26): Controls the medium-term core trend filter. Acting as the ultimate trailing stop-loss anchor.
Show Visibility Toggles: Fully customizable checkboxes allowing you to isolate the ICC corridor, show/hide traditional clouds, or toggle momentum shapes and background intersection flashes.
📌 Credits and Origins
This specific edition is engineered by @gunebak4n (dedicated to the true passion of trading, hayatım), bridging classical Japanese chartism founded by Goichi Hosoda, modern spatial geometry, and quantitative script standards previously highlighted by Kıvanç Özbilgiç (@kivancozbilgic). It is dedicated to professional algorithmic and discretionary traders who demand a mathematically sound, clutter-free view of trend validation and market structure mechanics.
Disclaimer: All financial indicators are purely probabilistic models. ICC is an advanced decision-support architecture and does not guarantee execution success or profits. Always utilize strict risk management protocols and predefined stop-losses. Wskaźnik
Adaptive Ichimoku Equilibrium ChannelADAPTIVE ICHIMOKU EQUILIBRIUM CHANNEL
WHAT IT IS
A modern, single-engine extension of Ichimoku Kinko Hyo. Ichimoku's core insight is that its lines are not moving averages but EQUILIBRIUM midpoints — the centre of the recent high/low range — and that it projects that equilibrium forward as a cloud. This script keeps that DNA and rebuilds it as one adaptive object: the equilibrium adapts to trend efficiency, the channel width breathes with volatility, volume confirms or warns, momentum and breakouts flag turns, equal-high/low liquidity pools become structural targets, the cloud trend is read across four timeframes, and a past-only calibration attaches an honest hit-rate to the signals. A plain-language verdict makes it readable at a glance; an Advanced view exposes the full engine.
It is a single indicator, not a pack. Everything plots in one pane on the price chart.
WHY THESE COMPONENTS ARE COMBINED (mashup justification)
Each layer answers a different question a trend trader must answer at the same moment, and all of them share — and reinforce — the same equilibrium spine, which is why they are fused into one engine rather than left as separate studies that would each repaint the chart and never reference each other:
- EQUILIBRIUM SPINE. Fast and slow range-midpoints (the Ichimoku Tenkan/Kijun idea) blended by an efficiency ratio, so the spine tracks quickly in clean trends and slowly in chop. This is "fair value", and every other layer is measured relative to it.
- KUMO CLOUD + MULTI-TIMEFRAME TREND. The forward-displaced cloud shows trend at a glance. The same cloud trend is then sampled at 1x, 3x, 5x and 15x the chart timeframe and shown as four colour-coded cells, so higher-timeframe alignment is visible without switching charts. Alignment across the four is stronger context; conflict is a caution.
- ADAPTIVE WIDTH / PREMIUM-DISCOUNT. The dealing range around the spine expands when volatility expands and contracts when it compresses (width is ATR-based). This makes "discount" (lower half) and "premium" (upper half) mean the same thing across assets and regimes — a fixed-width channel cannot.
- VOLUME CONFIRMATION. Volume-weighted price versus its simple average shows whether volume agrees with the trend; a volume surge flags conviction. This closes the blind spot of a price-only channel. On instruments that report no volume, volume can be borrowed from a chosen proxy symbol.
- DISTANCE-FROM-EQUILIBRIUM DIVERGENCE. Ichimoku has no native oscillator, so momentum here is reconstructed as price's distance FROM the equilibrium spine: when price makes a higher high that is LESS extended from the spine than the previous high (or a lower low that is less extended), momentum is waning and a divergence is flagged at the extreme — exactly where reversals begin.
- VALIDATED BREAKOUTS. A break of a channel rail is only marked when it is confirmed by displacement beyond the rail, a dominant candle body, above-average volume, and a close that holds beyond the rail (anti-wick). This filters out the wick-pokes that fake breakouts on a naive channel.
- LIQUIDITY POOLS. Clusters of equal highs and equal lows are where stop orders rest. The script tracks the nearest unswept pool above and below price and lets trade targets snap to them, so objectives are structural rather than arbitrary.
- FUTURE BIAS + CALIBRATION. Trend, zone, slope, volume and breakouts are fused into a continuation-versus-reversion probability. Separately, the channel setups and the zone signals each carry a PAST-ONLY forward hit-rate, reported with a Wilson 95% confidence interval, measured on the current symbol.
In short: equilibrium without width gives no zones; width without volume or structure is blind; and neither tells you what is statistically likely next or whether the same setup has worked before on this symbol. Because each piece needs the others to be useful, they are one object.
HOW IT WORKS TOGETHER (reading the chart)
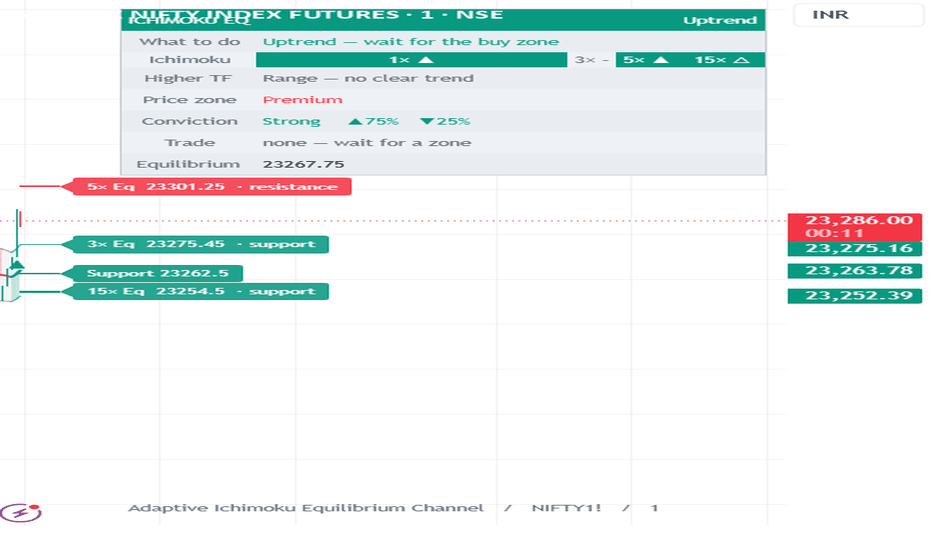
1. The trend-coloured band and its midline are the trend: green up, red down, gold/grey when there is no clear trend. The midline holds its colour until the trend actually reverses, so it does not flicker in chop.
2. Within the band, the lower (discount) half is where to look to engage with an uptrend; the upper (premium) half is extended. A downtrend mirrors this.
3. The short coloured level on the right is the invalidation: the current trend read fails on a close beyond it.
4. The dashboard's Ichimoku row shows the cloud trend on 1x/3x/5x/15x. The Higher-TF row tells you whether trades are permitted (setups are taken only in the higher timeframe's direction).
5. An orange "Div" marker warns of waning momentum at an extreme. A "Break" diamond marks a validated breakout. Cyan EQH/EQL lines are the nearest liquidity pools and act as targets.
6. The verdict box states the trend, where price sits, and the conviction in words. The Advanced view adds the calibrated win-rates, volume read, channel state and any optional inter-market context.
HOW TO USE IT
- Apply to any symbol and timeframe. Read the band colour for trend, the half for location, and the verdict box for the plain-language summary.
- Use the Ichimoku multi-timeframe row to gauge whether the higher timeframes agree before acting on a lower-timeframe signal.
- On-chart markers, from most to least prominent: LONG / SHORT label badges are full trade setups (entry, stop and target); Buy / Sell triangles mark price entering the discount/premium zone; the tiny orange "Div" warns of waning momentum at an extreme; the tiny "Break" diamond marks a validated breakout; cyan EQH/EQL lines are the nearest liquidity-pool targets.
- Treat all markers as context, and check their past-only win-rates in the Advanced view before relying on them.
- This is analysis context for your own decision, not a signal to act on blindly. It places no orders.
ORIGINALITY (versus standard Ichimoku)
Standard Ichimoku is a fixed-length, price-only, single-timeframe tool with no volume, no momentum oscillator, no breakout validation, no targets, and no measure of whether it has worked. This script makes the equilibrium adaptive, makes the width volatility-driven, reconstructs momentum as distance-from-equilibrium, validates breakouts against wicks, turns equal-high/low liquidity into targets, shows the cloud trend across four timeframes, adds volume confirmation, and attaches a past-only calibrated hit-rate to its signals. None of that is provided by classic Ichimoku.
UNIVERSAL DATA (works on any market)
The price source is selectable in Settings (default close; choose hl2, hlc3, or any series), every threshold is ATR-relative, and volume can be borrowed from a proxy symbol for instruments that report none — so the script runs on stocks, futures, FX, crypto and indices without re-tuning. Two optional refinements are off by default and never shown on the simple face: a spot symbol (futures-vs-spot basis) and a volatility index (e.g. VIX / India VIX), which feed conviction and channel width when supplied. The entire display — dashboard, bands, lines, labels and markers — adapts to your chart background automatically (Auto theme), or can be forced to Dark or Light, so it stays readable on any background.
SETTINGS OVERVIEW
Data source (price source, optional borrowed-volume symbol); Equilibrium (Tenkan/Kijun lengths, adaptive blend); Adaptive width; Regime (efficiency, ADX, slope); Inter-market refinement (optional); Multi-timeframe trade filter; Calibration horizon and follow-through; Trades; Breakout validation thresholds; Liquidity tolerance; and Visuals (theme, zones, signals, divergence, liquidity, multi-timeframe levels, dashboard position).
LIMITATIONS
The forward cloud is a PROJECTION of the current equilibrium, not a forecast. Calibration and hit-rates describe PAST behaviour only on the current symbol and are not predictive. Borrowed volume, futures-vs-spot basis and volatility-index refinement are approximations. Everything here is probabilistic context, not certainty.
DISCLAIMER
This is a study/indicator for chart analysis and education only. It is not a strategy, not a recommendation, and not financial advice. It places no orders and guarantees no outcome. Markets carry risk; do your own research and manage your own risk.
Wskaźnik
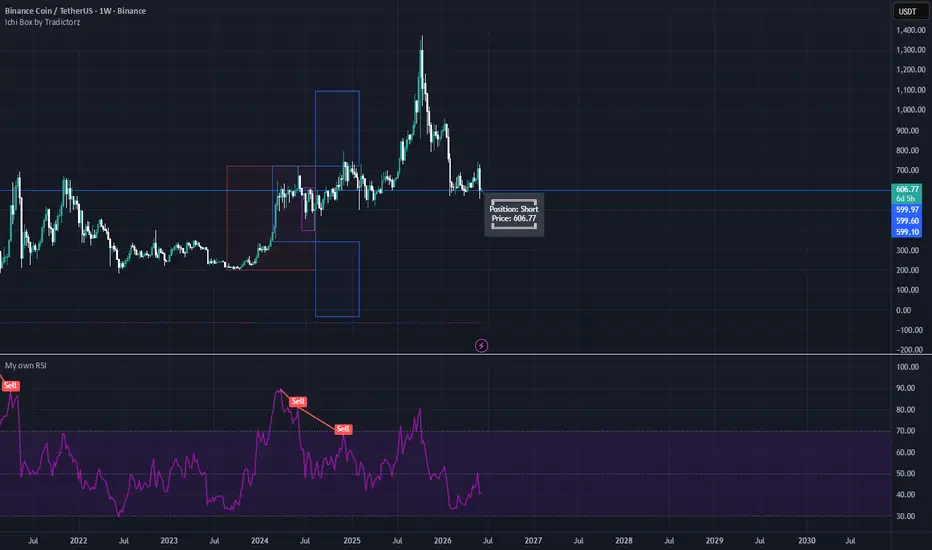
Interactive Ichimoku Box by Tradictorz | Open-Source EditionInteractive Ichimoku Box by Tradictorz | Open-Source Edition
This is the open-source release of Interactive Ichimoku Box by Tradictorz.
The script is designed as a visual Ichimoku-based analysis tool. It combines standard Ichimoku components with interactive projection boxes based on recent high/low ranges. The goal is to help traders visually study price structure, potential range expansion areas, and Tenkan/Kijun relationship directly on the chart.
Main features:
• Ichimoku Tenkan and Kijun lines
• Optional Ichimoku cloud display
• Chikou span display
• Interactive target boxes based on 9-period, 26-period, and 52-period high/low ranges
• Higher and lower projection box options
• Visual Tenkan/Kijun cross indication
• Position label showing current directional bias and price
• Buy/Sell alert conditions based on Tenkan/Kijun crossovers
How it works:
The indicator calculates Ichimoku-style Donchian midpoints for the Conversion Line and Base Line. It then uses recent high/low ranges to draw projected boxes above and below the selected range. These boxes are intended to provide a visual framework for studying possible continuation or expansion zones.
Position label:
The position label displays the current directional state:
• Long: Conversion Line is above Base Line
• Short: Conversion Line is below Base Line
• Range: Conversion Line and Base Line are equal
Alerts:
The script includes alert conditions for:
• Buy Alert: Conversion Line crosses above Base Line
• Sell Alert: Conversion Line crosses below Base Line
Important notes:
This indicator is an analytical and educational tool only. It does not provide financial advice, trade recommendations, or guaranteed buy/sell signals. Historical behavior does not guarantee future results. Always combine this tool with your own analysis, confirmation process, and risk management.
Open-source notice:
This version is published as open source for transparency, educational review, and community feedback. You may inspect the logic, learn from it, and modify it according to TradingView’s open-source rules. If you reuse or publish modified versions of this script, please follow TradingView’s House Rules and credit the original author where required.
License:
This source code is subject to the terms of the Mozilla Public License 2.0.
© parm79 Wskaźnik

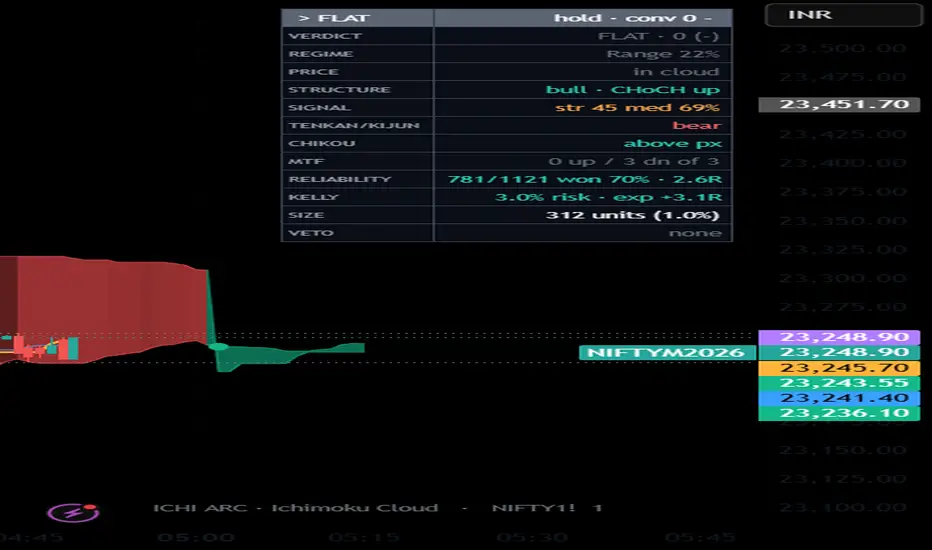
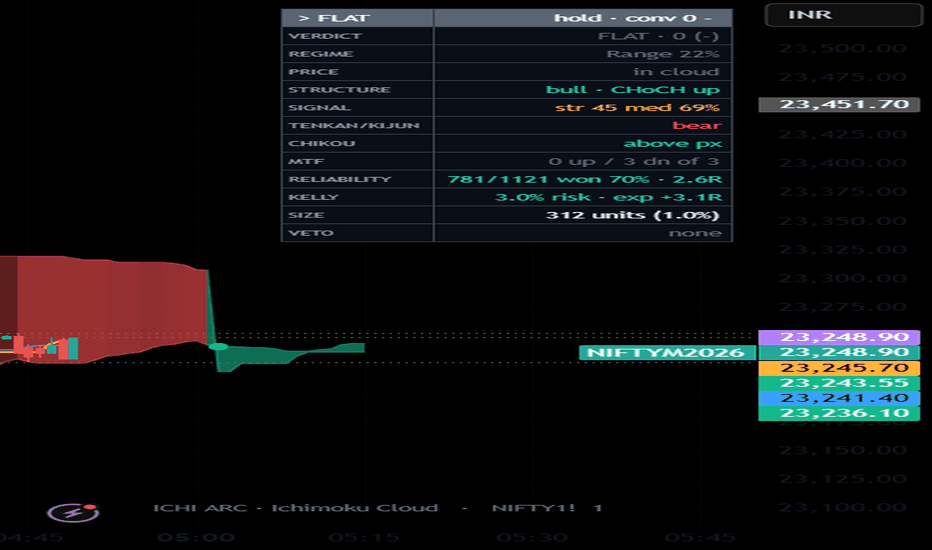
Ichimoku Cloud Calibrated & Multi-Timeframe# Ichimoku Cloud — Strength-Graded, Calibrated & Multi-Timeframe (ICHI ARC)
## What it is
The classic Ichimoku Kinko Hyo five-line system — Tenkan, Kijun, the Senkou A/B cloud (Kumo) and the Chikou span — drawn faithfully, but with the *reading* of it done by a modern engine instead of the eye.
A plain Ichimoku throws six signals at once with no synthesis, uses fixed periods designed for one market in the 1930s, and tells you nothing about whether its signals actually work.
ICHI ARC keeps the cloud exactly as the core, then fuses the whole signal cluster into **one 0–100 strength score per signal**, confirms it with market structure and volume, and **calibrates the score to what actually happened on this symbol**.
It runs on **any symbol, asset class, timeframe and market**. The raw data source and every optional feed are user-selectable; nothing is hard-coded to a market.
---
## Why these components are combined (mashup rationale)
A raw Ichimoku has four well-known weaknesses, and each added layer fixes exactly one of them and feeds the next — none is decorative:
### 1. Adaptive periods (fixes the "one-market settings" problem)
Optionally derive Tenkan/Kijun/Span-B from the measured **dominant cycle** so the cloud fits the instrument and timeframe instead of fixed 9/26/52. Classic mode is the default.
### 2. One strength score (fixes "six signals, no synthesis")
Price-vs-cloud (the master bias), Tenkan/Kijun, Chikou clearance, current cloud colour, the forward Kumo twist, Kijun slope and cloud thickness are weighted into a single 0–100 grade so you read one number, not six lines.
### 3. Market-structure confirmation, BOS / CHoCH (fixes false breakouts)
Swing-pivot structure independently checks whether a cloud breakout is a real structural shift: a same-direction Break of Structure strengthens the signal; a signal against the last Change of Character is vetoed.
This is price geometry, so it is orthogonal to the cloud and to volume.
### 4. Relative-volume confirmation (fixes dead-volume fakeouts)
Real breakouts carry volume; RVOL (volume vs its own average) boosts strong-volume signals and can veto dead-volume ones — a third, independent angle on the same failure mode.
### 5. Regime + multi-timeframe context (keeps it out of chop)
An efficiency-ratio / trend-strength / volatility-cluster classifier and three higher-timeframe clouds gate the signals, since Ichimoku breakouts fail in range-bound tape.
### 6. Conviction, vetoes and Kelly sizing
Everything resolves to one LONG / SHORT / FLAT verdict with hard vetoes, and the calibrated win-rate is turned into a fractional-Kelly position-size suggestion.
Remove any one layer and a specific Ichimoku failure returns (wrong fit, signal overload, false breakout, dead-volume breakout, chop). That is the justification for combining them.
---
## How it is original
ICHI ARC keeps a **self-calibrating quality engine**.
Every cloud-bias signal is checked a fixed window later for whether price actually ran a **favourable target (in ATR)** in the signal's direction — i.e. whether the trade *worked*, not merely whether the cloud held.
From that it reports, live, the **realised win-rate of past signals at each strength tier on this symbol** plus the average favourable move (in ATR), can **auto-learn the strength cutoff** worth acting on, and converts the win-rate into a **Kelly-based sizing suggestion**.
A stock Ichimoku tells you nothing about the quality of its own signals; this one is accountable to its own track record.
---
## What it plots
• The full classic Ichimoku: Tenkan, Kijun, the displaced Senkou A/B **cloud** (with opacity scaled by cloud thickness), the Chikou span, and marked forward **Kumo twists**.
• Strength-graded signal triangles with a score label (`72 S` / `55 M` / `31 w`), and small diamonds marking **Change-of-Character** structure flips.
• A compact **dashboard** featuring:
* Verdict
* Regime
* Price-vs-cloud
* Structure state
* Signal strength and realised win-rate
* Tenkan/Kijun status
* Chikou status
* MTF agreement
* Relative volume
* Calibration statistics
* Kelly / expectancy sizing reference
* Active veto status
---
## How to use it
### 1. Trade with the cloud
Long bias above the Kumo, short bias below, no-trade inside.
### 2. Focus on strength-graded signals
A high-strength signal that also has:
• Same-direction Break of Structure
• Higher-timeframe agreement
• Real volume confirmation
is the A+ setup.
Weak signals during chop regimes are generally the ones to skip.
### 3. Read the VERDICT / VETO rows
WEAK or VETO means stand aside (for example, a signal against structure, in chop, or on dead volume).
### 4. Use the RELIABILITY and KELLY rows
The **RELIABILITY** row shows how this symbol's signals at each strength tier have historically behaved.
The **KELLY** row suggests a risk percentage for journaling and trade review purposes.
The displayed size is a reference only and not an order recommendation.
### 5. Alerts
Alerts cover:
• Bullish cloud signals
• Bearish cloud signals
• Conviction verdict changes
• Kumo twists
---
## Settings (use on any asset / market)
### Raw data source
`close`, `hl2`, `hlc3`, `ohlc4`, or another indicator's plot.
The cloud's highs/lows always use chart high/low.
Works on any instrument.
### Periods
Classic (9/26/52/26) or Adaptive (dominant-cycle).
Displacement remains fixed.
### Structure
Swing pivot length and structure veto controls.
### Volume
RVOL length and minimum thresholds.
Optional low-volume veto.
### Calibration
Judging window and favourable ATR target defining a "good" signal.
Auto-learn cutoff and target win-rate settings.
### Advanced Controls
Regime, MTF, conviction weights, risk controls, Kelly fraction and maximum risk.
### Optional feeds (blank = off)
• Volatility-index symbol (spike veto)
• Cross-asset symbol (confluence)
Both are disabled by default, allowing fully self-contained operation on any market.
---
## Notes
• This is a **study / indicator**, not a strategy, and it places no orders.
• Signals are evaluated on bar close to avoid intrabar repainting.
• Structure uses confirmed pivots and higher-timeframe reads use confirmed values.
• The cloud and Chikou are displaced exactly as in classic Ichimoku.
• Relative-volume features require a symbol that reports volume (such as futures). On volume-less symbols they gracefully revert to neutral behaviour.
---
## Disclaimer
This script is provided for educational and informational purposes only. It is a technical-analysis study, not financial, investment, or trading advice, and not a recommendation or solicitation to buy or sell any instrument.
No indicator can predict markets; past behaviour and any historical statistics shown (including the signal win-rates and any Kelly-based sizing suggestion) do not guarantee future results.
Trading involves substantial risk of loss.
You are solely responsible for your own decisions — do your own research and consider consulting a licensed financial professional before trading.
The author accepts no liability for any loss arising from use of this script.
Wskaźnik
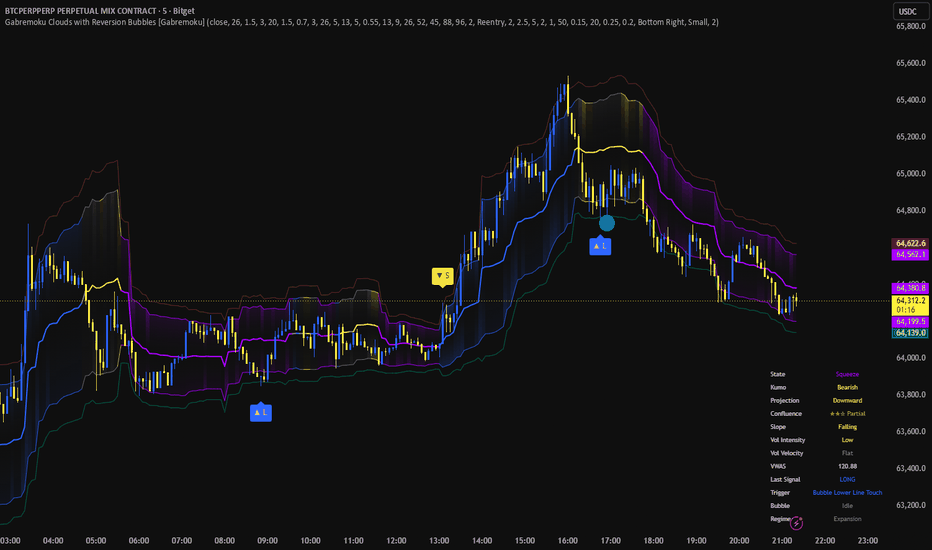
Gabremoku CloudsGabremoku Clouds is a volume-driven equilibrium cloud built to highlight fair-value zones, directional acceptance, and compression/expansion phases in a cleaner and more forward-looking way than traditional cloud indicators. Instead of using classic Ichimoku spans or standard deviation bands, this script builds its structure around a custom volume-weighted equilibrium line and a surrounding cloud whose width is based on Volume-Weighted Average Spread (VWAS). The result is a cloud that reacts not only to price movement, but also to how price is distributed under volume, making it useful for reading consensus, imbalance, and market acceptance.
A key idea behind this indicator is that not all price movement has the same meaning. When volume concentrates inside a tighter range, the cloud compresses and signals balance or consensus. When price expands with broader spread and weaker concentration, the cloud widens and reflects uncertainty or directional transition. This gives the indicator a different purpose from standard volatility envelopes: it is designed less as a generic overbought/oversold tool and more as a market structure and equilibrium map.
The script also includes a 26-period forward projection of the equilibrium cloud. This projected area is calculated from current and historical information only, then shifted forward visually to provide a future reference zone without using lookahead logic. Its purpose is not to predict price in an absolute sense, but to suggest where balance may migrate next if the current slope and cloud conditions remain consistent.
What it helps identify
Trend acceptance when price holds above or below the cloud with supporting volume.
Fair-value reclaims when price rotates back into equilibrium after displacement.
Squeeze-to-expansion transitions when the cloud compresses and then releases into directional movement.
Exhaustion when price reaches a fresh extreme while volume momentum decelerates.
How to use it
Use the current cloud to judge whether price is trading in balance, in directional acceptance, or in transition.
Use the projected cloud as a forward reference area for continuation, reversion, or future balance.
Treat the signals as contextual tools, not standalone trade instructions. They work best when combined with price structure, market context, and risk management.
What is new
Gabremoku Clouds is not a mashup of existing tools. Its core logic is built around a custom equilibrium model that combines volume-weighted price location with volume-weighted spread behavior, then extends that structure into a forward cloud projection. The goal is to give traders a more informative cloud: one that reflects where value is forming now, how stable that value is, and where it may shift next. Wskaźnik
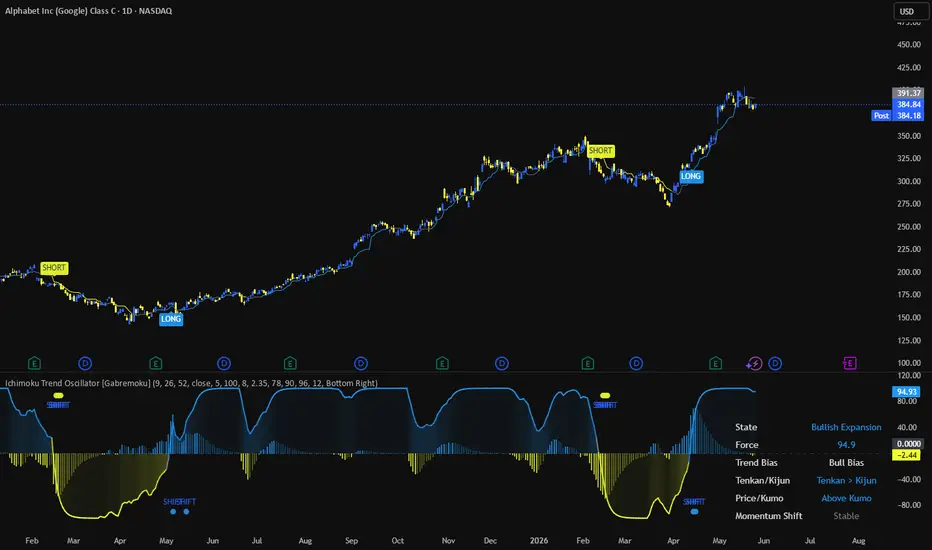
Ichimoku Trend Oscillator [Gabremoku]Ichimoku Trend Oscillator is a custom trend-following oscillator that transforms core Ichimoku components into a normalized trend force model, designed to make bullish and bearish pressure easier to read in a single lower-panel view.
Instead of plotting the full traditional Ichimoku Cloud on price, this script converts the relationship between Tenkan, Kijun, Kumo structure, and price location vs cloud into a smoothed oscillator with:
a central zero line
trend force scoring
histogram confirmation
momentum shift detection
optional Tenkan force overlay on the main chart
The Ichimoku framework is commonly used to evaluate trend, momentum, and support/resistance at a glance, especially through the relationship between price and cloud position, plus the Tenkan/Kijun structure.
What it shows
📉 Trend Force Line — the main oscillator line represents a normalized force score derived from:
Tenkan vs Kijun spread
price location relative to the cloud
bullish or bearish cloud structure
📊 Histogram — visualizes the difference between the force line and its signal line, helping show momentum acceleration or deceleration.
🌈 Soft Gradient Fill — the oscillator fill changes intensity depending on how far trend force is from zero.
📍 Tenkan Force Overlay — optionally plots the Tenkan line on the main chart with dynamic color logic tied to trend condition.
🚦 Signals — the script can display:
LONG on bullish zero-line cross
SHORT on bearish zero-line cross
SHIFT markers when momentum changes sharply without a fresh zero cross
🪧 Dashboard — displays state, force value, trend bias, Tenkan/Kijun relation, price vs Kumo position, and momentum-shift status.
Core logic
The script compresses several Ichimoku readings into one oscillator.
It combines:
Tenkan/Kijun directional spread
price above / inside / below cloud
cloud directional structure
ATR-based normalization
and smoothing for cleaner force transitions
This matters because in standard Ichimoku interpretation:
price above the cloud is usually read as bullish context
price below the cloud is usually read as bearish context
Tenkan above Kijun supports bullish alignment, while the opposite supports bearish alignment
By translating those conditions into a normalized oscillator, the script gives traders a faster way to read trend quality and directional pressure without plotting the full classic system every time.
State model
The oscillator classifies the market into states such as:
Bullish Expansion
Bullish Pressure
Bearish Expansion
Bearish Pressure
Neutral
This is useful because it separates simple directional bias from stronger “expansion” conditions where multiple Ichimoku elements are aligned.
For example:
force above zero suggests bullish pressure
force below zero suggests bearish pressure
stronger positive or negative readings reflect stronger directional alignment
SHIFT signals are used to highlight sudden changes in momentum before a full regime flip
How to use
A practical workflow is:
Use the zero line as the primary directional divider.
Use the force line to judge strength.
Use the histogram to evaluate acceleration or fading momentum.
Watch for SHIFT markers when force changes quickly.
Use the Tenkan overlay on the main chart as an additional structure guide.
In general:
cross above zero = bullish transition
cross below zero = bearish transition
force staying far from zero = stronger trend persistence
shift signals = possible early momentum change without full bias reversal yet
Features
✅ Ichimoku-based lower-panel oscillator
✅ Trend force model built from Tenkan, Kijun, Kumo, and price/cloud relationship
✅ ATR-normalized force engine
✅ Smoothed force line
✅ Signal line and histogram
✅ Soft gradient fill around zero
✅ LONG / SHORT zero-cross signals
✅ Bullish / bearish momentum shift markers
✅ Optional Tenkan force overlay on the main chart
✅ Live dashboard with state and bias information
Notes
This indicator is designed to turn Ichimoku structure into a more compact trend momentum oscillator, not to replace full discretionary Ichimoku analysis. It works best as a directional filter or timing aid when combined with price structure, support/resistance, or a broader trend framework.
Author: Gabremoku
Pine Script v6 Wskaźnik

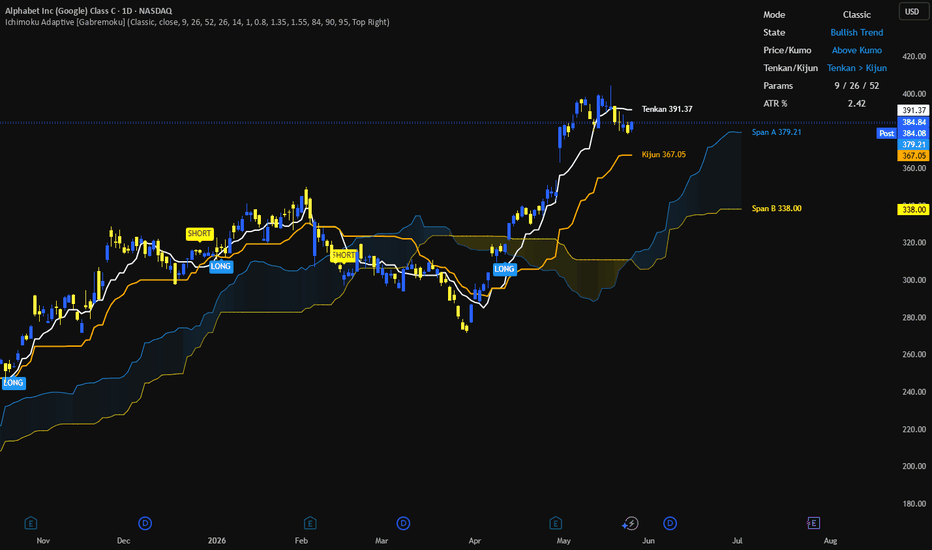
Ichimoku Adaptive [Gabremoku]Ichimoku Adaptive is a full Ichimoku Cloud framework that combines the traditional Classic settings with an optional Adaptive mode that automatically scales the core Ichimoku periods according to market volatility.
The script keeps the original logic of the Ichimoku system — Tenkan, Kijun, Senkou Span A, Senkou Span B, Chikou, and Kumo structure — while adding a volatility-based adjustment engine that can make the framework more reactive or more stable depending on current conditions. The classical Ichimoku model is designed to show trend direction, momentum, and dynamic support/resistance in a single view.
What it shows
☁️ Full Ichimoku structure — Tenkan-sen, Kijun-sen, Senkou Span A, Senkou Span B, optional Chikou Span, and forward Kumo projection.
🧠 Classic or Adaptive mode — use standard Ichimoku parameters or let the indicator adjust its internal lengths according to ATR-based volatility behavior. Adaptive indicators are commonly designed to become more responsive or more conservative depending on changing volatility conditions.
🌈 Dynamic Kumo gradient — the cloud color and fill intensity vary based on bullish/bearish structure and cloud thickness.
🏷️ TK Cross signals — optional LONG and SHORT labels appear when Tenkan crosses above or below Kijun. Tenkan/Kijun crosses are widely used as Ichimoku signals and are often considered stronger when aligned with price position relative to the cloud.
🪧 Dashboard — displays mode, trend state, price vs Kumo location, Tenkan/Kijun relationship, active parameters, and ATR percentage.
📍 Last value labels — optional labels for Tenkan, Kijun, Span A, and Span B.
Core logic
This script is built around the classic Ichimoku reading process:
price vs cloud
Tenkan vs Kijun
future cloud structure
optional Chikou confirmation
In standard Ichimoku interpretation:
price above the cloud suggests bullish structure
price below the cloud suggests bearish structure
price inside the cloud suggests transition or indecision
This indicator keeps that framework intact, then extends it with an adaptive period engine.
Adaptive mode
In Classic mode, the script uses the traditional fixed settings:
Tenkan
Kijun
Senkou B
displacement
In Adaptive mode, those core lengths are scaled according to an ATR-based volatility ratio.
The idea is straightforward:
when volatility changes, fixed settings may become less efficient
adaptive scaling can make the Ichimoku framework more flexible across different environments
higher or changing volatility can justify a different sensitivity profile than calm market conditions
This does not replace classic Ichimoku logic — it simply changes the speed of the framework while keeping the same structural interpretation.
How to read it
A practical reading sequence is:
Check whether price is above, below, or inside the cloud.
Check whether Tenkan is above or below Kijun.
Observe whether the cloud is bullish or bearish.
Use TK crosses as triggers only after checking context.
In Adaptive mode, monitor how the active parameters shift as volatility changes.
In general:
Above Kumo + Tenkan > Kijun supports bullish trend logic.
Below Kumo + Tenkan < Kijun supports bearish trend logic.
Inside Kumo usually suggests weaker trend clarity or transition.
Features
✅ Full Ichimoku Cloud framework
✅ Classic fixed-parameter mode
✅ Adaptive ATR-based mode
✅ Configurable Tenkan / Kijun / Senkou B / displacement
✅ Dynamic Kumo gradient visualization
✅ Optional Tenkan, Kijun, Senkou A, Senkou B, and Chikou display
✅ TK cross signal labels
✅ Dashboard with live state information
✅ Last-value labels for key lines
✅ Built-in alert conditions for bullish and bearish TK crosses
Notes
This indicator is best used as a context and structure tool, not just as a crossover script. Ichimoku signals are generally stronger when multiple elements align, especially price position relative to the cloud, Tenkan/Kijun direction, and overall Kumo structure.
Author: Gabremoku
Pine Script v6 Wskaźnik
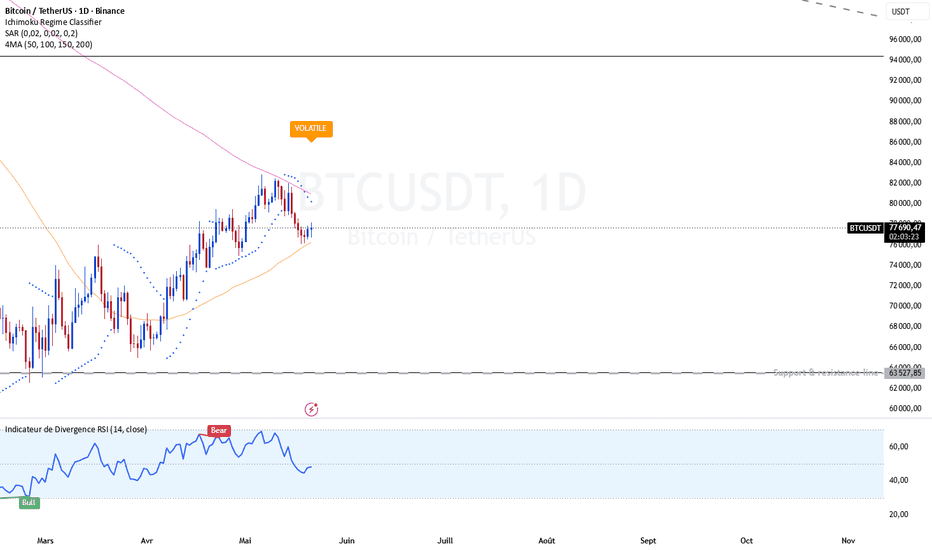
Ichimoku Regime ClassifierIchimoku Regime Classifier is an open-source market regime filter that labels conditions as TREND UP, TREND DOWN, or VOLATILE.
This script is designed to solve a practical problem: many entries fail because traders apply the same setup in all environments.
Its purpose is to classify the current market context first, so strategy rules can be adapted to regime.
Methodology
The classifier uses Daily Ichimoku structure plus ADX trend-strength confirmation:
Bullish regime:
Price above the Kumo
ADX above threshold
Tenkan above Kijun
Chikou-style confirmation (current price vs past price)
Bearish regime:
Price below the Kumo
ADX above threshold
Tenkan below Kijun
Opposite Chikou-style confirmation
Volatile regime:
If neither bullish nor bearish set is fully confirmed
Why this combination
Ichimoku provides structural trend context, while ADX filters weak directional phases.
The combination aims to reduce false directional bias during choppy periods and keep regime logic explicit.
How to use
TREND UP: prioritize long-biased setups
TREND DOWN: prioritize short-biased setups
VOLATILE: reduce risk, be selective, or wait for structure
This indicator is intentionally minimal on-chart (single regime label) to keep output readable and unambiguous.
Limitations
Regime transitions can lag, especially after sharp reversals.
This tool is a context filter, not a standalone entry/exit system.
Open-source notice
Published as open source for transparency, review, and customization.
Educational content only. Not financial advice. Wskaźnik
Wskaźnik

Wskaźnik

Wskaźnik

Dynamic Trend-Sensitive MTF Kijun Panel + IchimokuDynamic Trend-Sensitive MTF Kijun Panel + Ichimoku
This indicator blends the traditional Ichimoku Kinko Hyo system with a modern multi-timeframe (MTF) approach. It provides horizontal support/resistance levels and overall trend direction on a single screen through a dynamic sorting panel.
Key Features:
Full Ichimoku Suite: Plots Tenkan-sen, Kijun-sen, Senkou Span A/B (The Cloud), and Chikou Span for the current chart timeframe.
MTF Kijun-sen Tracking: Monitors Kijun-sen levels across 8 different timeframes (from 1m to Daily) simultaneously on the chart.
Dynamic Sorting Panel: The bottom-right panel automatically ranks Kijun-sen values by price (highest to lowest). This allows you to instantly identify which timeframe acts as resistance or support.
Trend-Sensitive Coloring: Cells in the panel compare the Kijun value of a lower timeframe to its immediate higher counterpart. A green background indicates a bullish alignment (Lower TF > Higher TF), while red indicates a bearish alignment.
How to Use:
Cloud Analysis: First, determine if the price is above or below the Cloud on your current timeframe.
Kijun Magnet: Price tends to be attracted to MTF Kijun levels (the colored lines). Use the panel to find the closest "major" levels above and below the current price.
Confluence Zones: When Kijun lines from different timeframes cluster together, it signifies an exceptionally strong support or resistance zone.
-----------------------------------------------------------------------
Dynamic Trend-Sensitive MTF Kijun Panel + Ichimoku
Bu indikatör, klasik Ichimoku Kinko Hyo sistemini modern bir çoklu zaman dilimi (MTF) yaklaşımıyla birleştirir. Yatay destek/direnç seviyelerini ve ana trend yönünü tek bir ekranda, dinamik bir sıralama paneliyle sunar.
Ana Özellikler:
Tam Ichimoku Seti: Mevcut grafik periyodunuzda Tenkan-sen, Kijun-sen, Senkou Span A/B (Bulut) ve Chikou Span çizgilerini standart olarak çizer.
MTF Kijun-sen İzleme: 1 dakikadan günlük periyoda kadar 8 farklı zaman diliminin Kijun-sen seviyelerini grafik üzerinde anlık olarak takip eder.
Dinamik Sıralama Paneli: Sağ alt köşedeki panel, Kijun-sen değerlerini fiyata göre (en yüksekten en düşüğe) otomatik olarak sıralar. Bu, hangi zaman diliminin direnç, hangisinin destek olduğunu anında görmenizi sağlar.
Trend Renklendirme: Paneldeki hücreler, küçük periyodun Kijun değerini bir üst periyotla kıyaslar. Eğer küçük periyot büyükten yukarıdaysa (boğa sinyali) yeşil, aşağıdaysa (ayı sinyali) kırmızı arka plan rengi alır.
Nasıl Kullanılır?
Bulut Analizi: Mevcut periyotta fiyatın bulutun üstünde mi yoksa altında mı olduğunu kontrol edin.
Kijun Mıknatısı: Fiyat, MTF Kijun çizgilerine (renkli çizgiler) doğru çekilme eğilimindedir. Paneldeki sıralama sayesinde, fiyatın hemen üstündeki ve altındaki "majör" seviyeleri kolayca tespit edebilirsiniz.
Kesişimler: Farklı periyotların Kijun çizgilerinin birbirine çok yaklaşması, o bölgenin çok güçlü bir destek veya direnç olduğunu gösterir. Wskaźnik

OT Bot trend ProOT Bot Supertrend Pro: The Ultimate Trading Guide
The OT Bot Supertrend Pro is an advanced trend-following system. It combines momentum (OT Bot), trend direction (SMA ), and volatility-based support/resistance (Supertrend), all filtered by trend intensity (ADX).
1. The Power of the ADX Filter (Trend Intensity)
Before looking for Buy/Sell signals, the indicator checks the ADX (Average Directional Index) to ensure you aren't trading in a "dead" or "exhausted" market.
• ADX < 20 (Sideways/Weak): The market is flat. Signals are hidden to prevent "Whipsaws" (losing trades in a range).
• ADX 25–40 (The Sweet Spot): The trend is healthy and active. Signals are visible and ready for entry.
• ADX > 40 (Overextended): The trend is too strong and likely to reverse soon. Signals are hidden to prevent "Buying the Top" or "Selling the Bottom."
2. Entry Strategy (The 4-Step Checklist)
To maximize accuracy, only enter a trade when all four conditions are met.
Buy Signal (Long Entry)
1. OT Bot: A "Buy" label appears, and candles turn Blue.
2. SMA : Price must be Above the Yellow line.
3. Supertrend: The dashed line must be Green (acting as support).
4. ADX: Current value must be between 20 and 40 (indicated by the Green dashboard).
Sell Signal (Short Entry)
1. OT Bot: A "Sell" label appears, and candles turn Purple.
2. SMA : Price must be Below the Yellow line.
3. Supertrend: The dashed line must be Red (acting as resistance).
4. ADX: Current value must be between 25 and 40 (indicated by the Green dashboard).
3. Precision Stop Loss (SL) Management
Your Stop Loss is dynamic, using the Supertrend line as a shield. We add a buffer of 100–200 points to avoid being stopped out by minor price spikes.
• For Buy Positions:$$Stop Loss = \text{Supertrend Price} - (100 \text{ to } 200 \text{ points})$$
• For Sell Positions:$$Stop Loss = \text{Supertrend Price} + (100 \text{ to } 200 \text{ points})$ OMXSTO:NOTE on "Points": > * Gold (XAUUSD): 1.00 USD movement = 100 points.
• Forex: The 5th decimal place (0.00001) = 1 point.
4. Exit & Take Profit (TP)
You can use two effective methods to lock in profits:
1. Fixed Risk/Reward: Target a ratio of 1:1.5 or 1:2. If your SL is 200 points, set your TP at 300–400 points.
2. Trend Transition: Close the trade if the candle color changes (e.g., Blue to Purple) or the Supertrend changes color, even if the OT Bot hasn't issued a new signal yet.
5. Pro-Tips for Success
• Recommended Timeframes: Best used on 15m, 1H, or 4H. Using very low timeframes (1m/5m) with ATR 1 may result in too many signals.
• Dashboard Check: Always look at the ADX Dashboard (Top Right). If it is Red, stay out of the market regardless of the "Buy/Sell" labels.
• Confirmation is King: Never "anticipate" a signal. Wait for the candle to Close to confirm the labels and colors before clicking buy or sell. Wskaźnik

Wskaźnik

Wskaźnik

IchimokuTrader Pro - Market Context & Confluence SuiteIchimokuTrader Pro is a framework for traders who want to use Ichimoku as a structured decision model rather than as a collection of isolated visual signals.
The script is designed to separate four important parts of trade evaluation:
• market regime
• trade location
• setup type
• execution structure
Instead of reacting to a single Tenkan/Kijun cross or a basic cloud break, the script evaluates multiple Ichimoku relationships together and translates them into a more organized context model. The goal is to help traders distinguish continuation, breakout, reclaim, and rotation conditions instead of treating all signals as if they belong to the same market environment.
The script uses established Ichimoku references such as price versus cloud, Tenkan versus Kijun, Chikou relationships, cloud state, and structural confirmation because they provide a coherent framework for directional context and market positioning. The value of IchimokuTrader Pro does not come from these components individually, but from how they are filtered, scored, and combined into a structured playbook workflow.
Engine architecture
The framework is built around four main layers that together form a practical decision model.
1. Regime Detection
The script first determines whether Ichimoku conditions support a directional trend environment, a pullback state, a transition state, or a more rotational structure.
This regime read is not based on one condition alone. It evaluates multiple Ichimoku relationships, including:
• price relative to the cloud
• Tenkan relative to Kijun
• Chikou relative to price
• Chikou relative to the cloud
• cloud direction and cloud stability
• agreement versus conflict between Ichimoku components
This matters because a bullish cloud break with supportive Chikou and aligned TK structure is very different from a cloud break that occurs while the rest of the Ichimoku structure remains mixed or contradictory.
To reduce unstable signal flipping, the regime logic favors confirmation and internal consistency over one-bar reactions.
2. Location Assessment
A market can have valid directional context while still offering poor trade location.
For that reason, the script evaluates location separately after regime has been identified. This layer checks whether price is currently positioned in a place that supports the active market condition.
It considers factors such as:
• proximity to Kijun
• interaction with Kumo edges
• reclaim versus rejection behavior
• distance from structural reference points
• whether the current move is already extended relative to the intended setup type
This helps prevent a valid directional idea from being treated as a good entry when the move is already too late or poorly positioned.
3. Playbook Mapping
Once regime and location are aligned, the script maps the situation into a distinct playbook.
The playbook layer is designed to separate different trade archetypes, including:
• Pullback Continuation
• Breakout Acceptance
• Sweep Reclaim
• Range Revert
This is one of the key functions of the script. It does not treat all valid-looking conditions as one generic signal stream. Instead, it attempts to identify what type of opportunity is currently present and what trade logic is most appropriate for that condition.
4. Trade Structure and Quality
For active playbooks, the script derives a practical trade structure from the current context.
This can include:
• directional side
• invalidation area
• target structure
• risk/reward context
• quality scoring based on context, location, and trigger alignment
The purpose is not to generate blind entries, but to show whether a setup is supported by both Ichimoku structure and trade geometry.
Additional context support
For added context, the script can include supporting elements such as structural references, imbalance context, cooldown behavior after invalidation, and confirmation filters. These elements are not included to increase indicator count. Their role is to support the sequence of regime, location, playbook, and execution quality.
Practical workflow examples
Scenario 1: Pullback continuation
Context: the broader Ichimoku structure is bullish. Price remains above the cloud. Tenkan and Kijun are aligned. Chikou confirms the directional state.
Location: price retraces toward Kijun or a nearby cloud edge without fully invalidating the bullish regime.
Action: the script classifies the condition as Pullback Continuation and highlights that the setup remains aligned with the prevailing context.
Scenario 2: Breakout acceptance
Context: price moves through a key Ichimoku boundary and the cloud structure improves rather than immediately failing.
Location: price holds above the breakout area instead of rejecting back into prior range.
Action: the script treats the event as Breakout Acceptance rather than as a simple one-bar breakout, helping the trader distinguish sustained acceptance from weak expansion.
Scenario 3: Transition or conflict state
Context: some Ichimoku elements remain bullish while others begin to conflict. Chikou structure weakens and cloud support becomes less stable.
Action: the script avoids presenting the market as a clean trend condition and instead reflects a mixed or transition state, reducing the risk of treating a structurally conflicted market as a high-quality continuation setup.
Summary
IchimokuTrader Pro is not designed as a generic Ichimoku signal overlay. Its purpose is to organize Ichimoku structure into a practical decision framework so traders can judge what market condition is active, whether current location supports participation, and which type of playbook best fits the setup. Wskaźnik