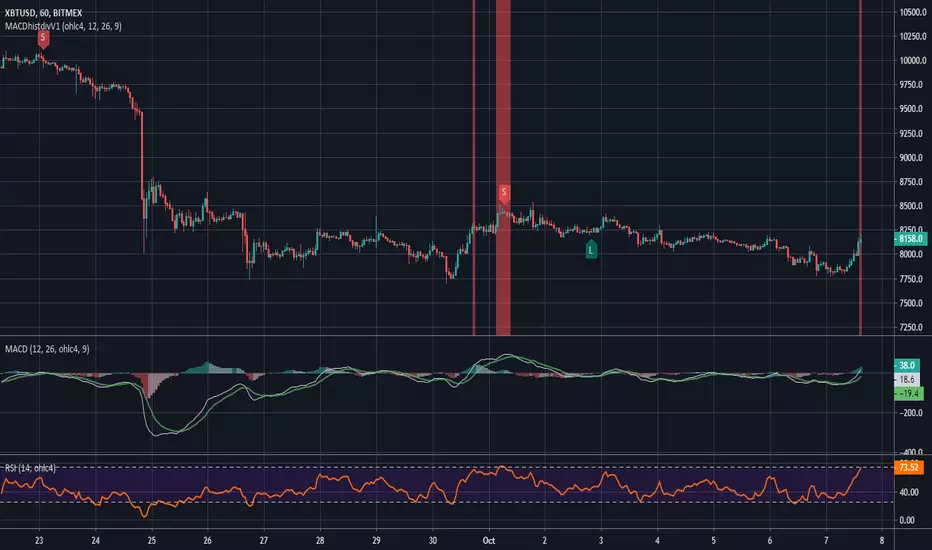
MACD Strategy by SedkurThis gives to you buy-sell signal with MACD histogram value. Use "Fast and Slow length" and "Buy or Sell Histogram Value" inputs to take less or more signal. Strategiaod sedatkurban2139
MAC-Z [ChuckBanger]Here I show the relationship between the MACD and Z-Score in a indicator called MAC-Z. MACD is short for moving average convergence/divergence and is in it self showing the relationship between two EMA. The Z-Score in contrast is related to Bollinger Bands and in MAC-Z the Z-score is the difference between the current price and a moving average divided by the standard deviation of price over the same time period. MAC-Z has its best use in the short term time frames in my opinion compared to MACWskaźnikod ChuckBanger128
Derivative Oscillator Cu [ID: AC-P]The "AC-P" version of the Derivative Oscillator is my personal customized version of Constance Brown's Derivative Oscillator (using Everget's implementation of it as the base), with the the following modifications and additions: VWAP Indication - option to show whether the price input option is above or below the Daily VWAP (red triangles = price input is below vwap, green triangles = price input is above vwap) Bullish and Bearish phases from shayankm's Waddah Attar Explosion V2 () is iWskaźnikod UnknownUnicorn279684111974
Modified Stochastic MACD Oscillator - Vitali ApirineFor all MACD enthusiasts out there, hot off the press, I present this next generation "Modified Stochastic MACD Oscillator" employing PSv4.0, originally formulated by Vitali Apirine for TASC - November 2019 Traders Tips. Just when you may have thought it was the end of the evolutionary line for MACD technology, it's not! Basically it's a NEW hybridization of a MACD and stochastic rolled into one, maintaining scale symmetry to support overbought/oversold defined levels across time frames and asseWskaźnikod ImmortalFreedom7490
Schaff Trend Cycle [ChuckBanger]The Schaff Trend Cycle is a method, developed by Doug Schaff and based on the concept that trends also have repeating high and low patterns, or cycles. This is a modified MACD line, run through a modified stochastic algorithm and smoothed with Wilders’ smoothing in order to estimate the final Schaff Trend Cycle (STC) indicator. Its purpose is to identify the direction, in which a trend cycle is moving and possible peaks and bottoms within this cycle. If this is interesting you should also take Wskaźnikod ChuckBanger4519
Stochastic RSI and MACD leader [ChuckBanger]Here I have combined Stochastic RSI with my MACD leader. MACD leader and Stochastic RSI works well together and they are powerful in combination with My Recursive Bands. It is up to you to back test this properly before you use it in real life trades. But in my opinion it is very powerful. Because of MACD nature it's a little messy when you turn on the MACD's histogram so I commented that out. MACD Leader: My Recursive Bands: Wskaźnikod ChuckBanger8 1.9 K
Easy to Use MACD+RSI Strategy BEGINNERS REJOICE! Easy to use strategy test using MACD with RSI as a confirming indicator. The code is structured to make it easy to manipulate the variables to your choosing. EASY TO CHANGE CODE VARIABLES LINE 2 = Change the amount you invest every trade and the currency LINE 8/9/10 = Change the defval of each of these lines to backtest from a certain date LINE 16/17/18 = Change the MACD sensitivity by changing the defval on each line LINE 21 = Change the value after close toaStrategiaod TrendsAreSexy19 1.8 K
MACD and RSI divergence by Rexio v2Hi everyone! I wrote this indicator for intraday trading and it cannot be use only by itself you need to at least draw some S/R lines to make it useful. It is based at MACD histogram and gives signal when it sees divergence on MACD/RSI/MACD's Histogram (or all at once - settings) when macd's histogram switchs trend. Im using it to playing with a trend most of the time looking for hidden divergence at higher time frame and after that looking for regular divergence at lower time frame. Im not a cWskaźnikod Rexio9993
MACD histogram divergence by Rexio v1Hi everyone! I wrote this indicator for intraday trading and it cannot be use only by itself you need to at least draw some S/R lines to make it useful. It is based at MACD histogram and gives signal when it sees divergence on MACD's Histogram when macd's histogram switchs trend. Im using it to playing with a trend most of the time looking. It highlights candles which can give good singnals to play with a trend (its based on ema200 and RSI overbought and oversold zones). Im not a computer progrWskaźnikod Rexio3207
MACD Leader [ChuckBanger]MACD makes use of moving averages and therefor usually lags behind the price. It is possible to eliminate lag completely but the work around of this is usually by adding a component of the price/MA difference back to MA. This technique is called Zero-lag. It is not zero lag but it is close enough. "MACD Leader" makes use of this to form a leading signal to MACD. First proposed by Giorgos E. Siligardos, "Leader" leads normal MACD , especially when significant trend changes are about to take plaWskaźnikod ChuckBanger3355
ANN MACD (BTC) Logic is correct. But I prefer to say experimental because the sample set is narrow. (300 columns) Let's start: 6 inputs : Volume Change , Bollinger Low Band chg. , Bollinger Mid Band chg., Bollinger Up Band chg. , RSI change , MACD histogram change. 1 output : Future bar change (Historical) Training timeframe : 15 mins (Analysis TF > 4 hours (My opinion)) Learning cycles : 337 Training error: 0.009999 Input columns: 6 Output columns: 1 Excluded columns: 0 Grid TraininWskaźnikod Noldo13342
ANN MACD Future Forecast (SPY 1D) NOTE : Deep learning was conducted in a narrow sample set for testing purposes. So this script is Experimental . This system is based on the following article and is inspired by an external program: hackernoon.com None of the artificial neural networks in Tradingview work and are not based on completely correct logic. Unlike others in this system: IMPORTANT NOTE: If the tangent activation function is used, the input data must also have tangent values (compared to the previous values of 1 bWskaźnikod NoldoZaktualizowano 15637
MACD - Baby WhaleI spiced the standard MACD indicator up a bit to make it more visible. When using the MACD: 1. Never go short when the MACD lines are in the negative. 2. Never go long when the MACD lines are in the positive. 3. Always wait for an uptick / downtick on the histogram before you start your trade. The MACD Histogram can also show you Divergence. When the price goes up but the Histogram can't make new highs, it might be a good time to think about shorting. If you want access, just send a message pWskaźnikod BabyWhale831109
MACD BF 🚀Customised MACD strategy with dynamic stop losses based on ATR. Signals are generated when the delta value becomes positive or negative (when it crosses the zero line) Stop losses are printed on the chart in yellow and orange. They are based on recent average True Range to allow for volatility. INSTRUCTIONS Green background = long Red background = short Yellow dotted line = stop loss placement for long Orange dotted line = stop loss placement for short White background = you have been Strategiaod bennef5164
TSI MACD by Jwammo12The TSI MACD indicator is a combination of the TSI (True Strength Index) and MACD (Moving Average Convergence Divergence) technical indicators. The TSI MACD indicator is a momentum indicator, considering that it comes from two momentum indicators. Ultimately, the TSI MACD indicator is used to gauge the strength of a trend, as well as its accompanying momentum. The indicator is shown to oscillate between -110 and +110, while its signal baseline is on the zero level (a level that determines theWskaźnikod jwammo1210443
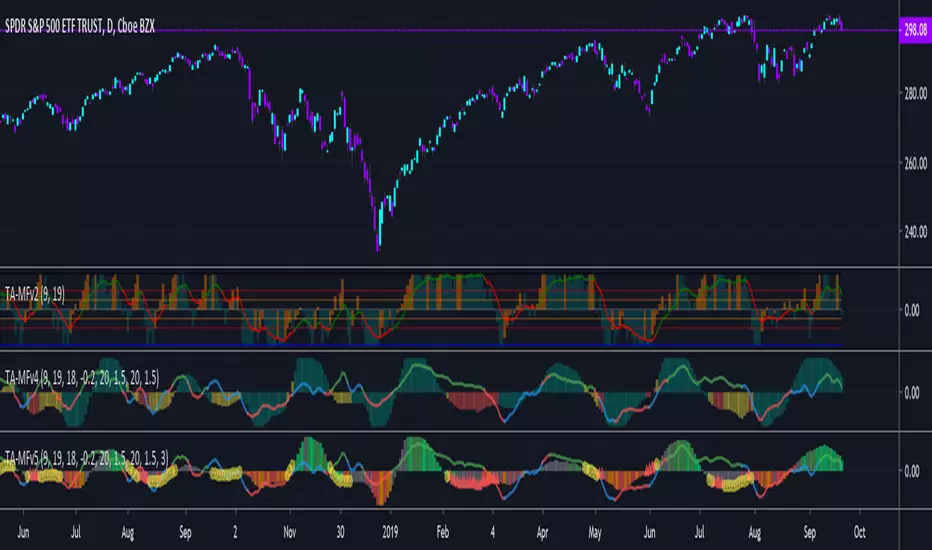
TA-Money Flow-Version5This is the MACD of a stochastic OBV movement indicator, Squeeze Momentum Indicator, and addition coloring for Market Direction Indicator . It is good (right) to work with both price and volume. In this version we've moved the divergence highlighting to symbols at the ends of the histograms. Same coloring scheme as previous, yellow is divergence of either OBV or SQZ , red is both divergence. In the previous version we added in the "squeeze on - blue" highlighting to show follow through of diverWskaźnikod kocurekc3376
MACD with RSI WarningI like using both MACD and RSI for my strategies to confirm patterns, but I really only check RSI to see if it is outside of the normal range. So I rewrote the MACD indicator to color bars that are above or below the set RSI boundaries in a different color (yellow by default) so I can quickly check that parameter without needing both indicators up. This is my first indicator, so please feel free to let me know how I might clean it up!Wskaźnikod JoshJaySalazar9259
MACD [Gu5]Extremely popular indicator MACD (Moving Average Convergence/Divergence) Same design of my previous indicators Show Cross Line for a better visualization ``` Setting recommended for BTC "Fast Length" = 21 "Slow Length" = 55 "Signal Smoothing" = 14 Other markets try "Fast Length" = 12 "Slow Length" = 26 "Signal Smoothing" = 9 ``` -- El MACD (Convergencia/Divergencia de Medias Móviles) es uno de los mas populares indicadores Continuando con el mismo estilo de diseño de mis anteriores indicWskaźnikod gu5tavo71Zaktualizowano 1653
MACD Histogram BacktestTesting the trades signaled by the daily MACD histogram to see how they would have performed, compared to regular MACD Crosses. I'm going to take the 'List of trades' and analyse it seperately as some of the profit percentages seem a little off in the tradingview calculation, though it could just be my bad math! Hi CryptoLove :) Hope this helps your investigation RE: www.youtube.com Strategiaod Biffy2247
MACD_Clean_AFJust a cleaned up version of MACD with some custom settingsWskaźnikod hundredtoamillionZaktualizowano 67