Wskaźnik
Wskaźnik momentum (MOM)

UCS_S_Steve Primo - Strategy #8Hello Fellas,
Hope you are trading fantastic and fine. Here is another setup from Steve Primo (Stocks) Setups. He claims this can be applied on any market, and you can. Primarily focused on Stocks and Futures market.
NOTE : I DID CODE THE BOTTOM INDICATOR, NOT PUBLISHING IT, ITS JUST RSI(5)
What did I change, ofcourse I don't publish what I find, There is a bit of me in the codes.....
1. Setup only shows up at meaningful levels, Stringent Filter
Myself and tradearcher will keep this upto d
Wskaźnik

UCS_Murrey's Math Oscillator_V2Hello, Murrey Math lovers, Thanks for those who showed interest on this. Based on a request, I have updated the plot / candle coloring, for Version - 2.
This has been in the queue for a while.
There was a Glitch found with the Multiplier. Will Fix in the next version. The Current Version (and the previous version) only supports 1/8 fractions. Will not support 0.25. The code needs to be updated, to automate the fractal line glitches for other ratios, Planned for future update.
Good Luck and
Wskaźnik

Mirrored MACD [LazyBear]This is a famous indicator I have seen used by many Forex traders in MT4 platform. This indicator uses the difference between EMA of "close" and EMA of "open" to form the oscillator lines (not just a convergence/divergence calculation between EMA of "close")
Current market state is determined by which histogram is above zero line. For more confirmation, wait for it to cross above Signal line too. Crossing down the signal or zeroline should be the exit condition. Also, look for divergences.
Us
Wskaźnik

Wskaźnik

UCS_Top & Bottom CandleThis is an experimental Indicator based on Momentum. Picks the Top & Bottom Candle for most Swing. Please post your opinion or suggestion to improve this indicator.
I have not back tested this completely. This is recently developed Indicator.
Wskaźnik

RSI-Stochastic HybridThis is a very simple idea - an average of RSI and the Stochastic Oscillator. However it offers plenty of flexibility for tuning to your requirements. You can change the lengths of either indicator and the weighting of each. By default it's set to 50/50 (just change the percent RSI to adjust). There is also an optional EMA which can be used as a signal line.
This idea comes from Greg Morris who likes to use it for trend following. I would buy when the indicator hits the overbought line and se
Wskaźnik

UCS_Squeeze_OptimizationSqueeze Momentum Indicator - Optimized
All Updates from Version 3 + Squeeze Optimized further.
Wskaźnik

UCS_Squeeze_Timing-V3Another Version with More Features . I am confident enough this works fine now. I am Sure this will be a valuable tool for you guys who love squeezes.
///////////////// This can be further optimized, Let me know with a comment, if you still need this to be optimized. ////////////////////
This update includes
- Added Options to detect squeeze using Heikin Ashi Candle
- Added Options to use BBR or Momentum (ROC) for the Momentum Histogram
- Custom Momentum Smoothing time period
- Removed the
Wskaźnik

Anchored Momentum [LazyBear]Anchored Momentum (AMOM), by Rudy Stefenel, is a modified momentum indicator to capture the relative momentum. AMOM uses SMA as the reference for deriving momentum, thereby anchoring it to that MA rather than "value of close n bars back".
Mr.Stefenel suggests using this like other oscillators -- crossing signal line, crossing zero, divergences.
For alerts, use "Momentum", "Signal" and "ZeroLine" plots.
Configurable options:
- Momentum Period: Default is 10.
- Signal Period: Default is
Wskaźnik

UCS_Squeeze_Timing-V2Statistically, Squeeze fires in the direction of strength (Up or Down). By replacing the Rate of Change with Bollinger Band % BB, allows us to easily pick the direction to trade the Squeeze. With the knowledge of Price Pattern, it makes it even easier.
I have identified 4 Setups that works wells with this. I will let you explore and comment. Could possibly initiate arguments and can identify a few more.
Nothing is perfect, but probable.
Using this with the Timing V1 Signals - It is easier
Wskaźnik

Stochastic Momentum Index _ UCSgearsThe Stochastic Momentum Index (SMI) was introduced by William Blau in 1993 as a way to clarify the traditional stochastic oscillator. SMI helps you see where the current close has taken place relative to the midpoint of the recent high to low range is based on price change in relation to the range of the price. This is a range based indicator, when used right. It can help momentum changes.
For those looking for help understanding this -
wiki.timetotrade.eu
www.tradingstrategyideas.com
tlc.th
Wskaźnik

UCS_Momentum Oscillator - Version 2This is Version - 2 of the Momentum Oscillator, Like i said on the prior version, This version has an Indicator for Trends.
Marks only Overbought and Oversold Based on the TREND.
The Trend dots are calculated exactly like the Slingshot system trend.
Wskaźnik

UCS_Momentum OscillatorI am not sure if someone else has already thought about it. But this is something I use to measure the meaningful oversold and overbought level, provided the stock is in a trend. I will add a Trend Indicator along with this in the next version.
I have added RSI, ROC, Stoch to compare. From the code below, i am using Stochastic, but the idea is same, if you use RSI. Experiment with your own comfortable time frames.
This is not a holy grail, The oversold and overbought in a trend transition per
Wskaźnik

Relative Momentum Index The Relative Momentum Index (RMI) was developed by Roger Altman. Impressed
with the Relative Strength Index's sensitivity to the number of look-back
periods, yet frustrated with it's inconsistent oscillation between defined
overbought and oversold levels, Mr. Altman added a momentum component to the RSI.
As mentioned, the RMI is a variation of the RSI indicator. Instead of counting
up and down days from close to close as the RSI does, the RMI counts up and down
d
Wskaźnik

Momentum HistogramThis creates a replica of relative distance from the moving averages, a good way to measure the strength, divergences etc.... short, mid and long term waves.
List of All my Indicators - www.tradingview.com
Wskaźnik

rs_Chande's Momentum Oscilator - MMAChande's Momentum Oscilator, with added MA's for momentum strenght.
Wskaźnik

Indicator: Intrady Momentum IndexThe Intraday Momentum Index (IMI), developed by Tushar Chande, is a cross-breed between RSI and candlestick analysis. IMI determines the candle type that dominated the recent price action, using that to pinpoint the extremes in intraday momentum.
As the market tries to bottom after a sell off, there are gradually more candles with green bodies, even though prices remain in a narrow range. IMI can be used to detect this shift, because its values will increase towards 70. Similarly, as the marke
Wskaźnik

Indicators: MMA and 3 oscillatorsGuppy Multiple Moving Averages
---------------------------------
Developed by Daryl Guppy, the basic idea of Multiple moving average(MMA) is to view the trend as two band of moving averages – short term band and long term band.
Shortterm averages capture the inferred behaviour of traders and long term represents the investors. Uses fractal repetition to identify points of agreement and disagreement which precede significant trend changes.
Short intro on interpreting the signals:
drive.goog
Wskaźnik

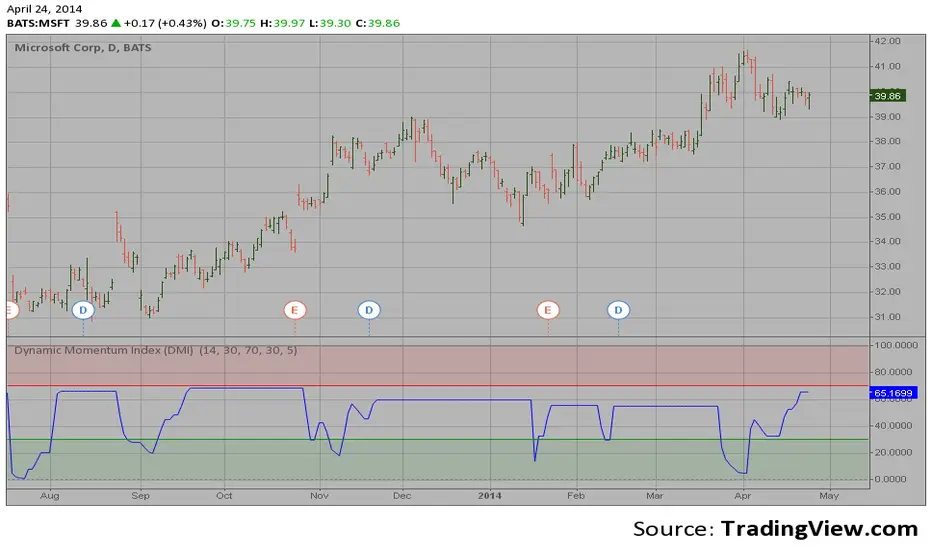
Dynamic Momentum Index (DMI) This indicator plots Dynamic Momentum Index indicator. The Dynamic Momentum
Index (DMI) was developed by Tushar Chande and Stanley Kroll. The indicator
is covered in detail in their book The New Technical Trader.
The DMI is identical to Welles Wilder`s Relative Strength Index except the
number of periods is variable rather than fixed. The variability of the time
periods used in the DMI is controlled by the recent volatility of prices.
The more volatile the prices
Wskaźnik