Wskaźnik

Wskaźnik

Wskaźnik

Wskaźnik

Strategia

Strategia

Money Wave Script (Visual Adaptive MFI)This Script is a visual modification of the Money Flow Index (MFI)
//@version=5
indicator(title="Money Flow Index", shorttitle="MFI", format=format.price, precision=2, timeframe="", timeframe_gaps=true)
length = input.int(title="Length", defval=14, minval=1, maxval=2000)
src = hlc3
mf = ta.mfi(src, length)
plot(mf, "MF", color=#7E57C2)
overbought=hline(80, title="Overbought", color=#787B86)
hline(50, "Middle Band", color=color.new(#787B86, 50))
oversold=hline(20, title="Oversold", color=#787B86 Wskaźnik

Wskaźnik

Wskaźnik

Wskaźnik

Wskaźnik

Wskaźnik

Wskaźnik

Wskaźnik

Wskaźnik
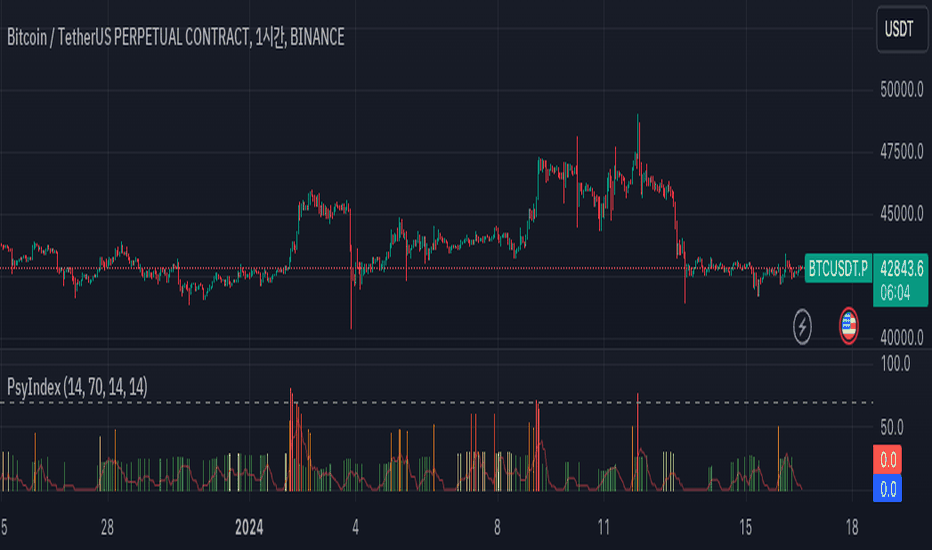
Wskaźnik

Wskaźnik

Wskaźnik

Wskaźnik

Wskaźnik

Wskaźnik

Wskaźnik

Wskaźnik

D-BoT Alpha Volume SpikeHello traders, Let me explain the code and provide an example of how to trade using this indicator.
The code you provided is a Pine Script indicator that combines multiple technical indicators, such as Supertrend, ADX, RSI, and MFI, to generate buy and sell signals. Here's a breakdown of the code:
User Settings:
The user can adjust parameters like overbought_limit, oversold_limit, volume_multiplier, volume_ma_length, volume_spike_multiple, lookback_period, and use_extremities_confirmation a Wskaźnik


