Wskaźnik
Średnie kroczące

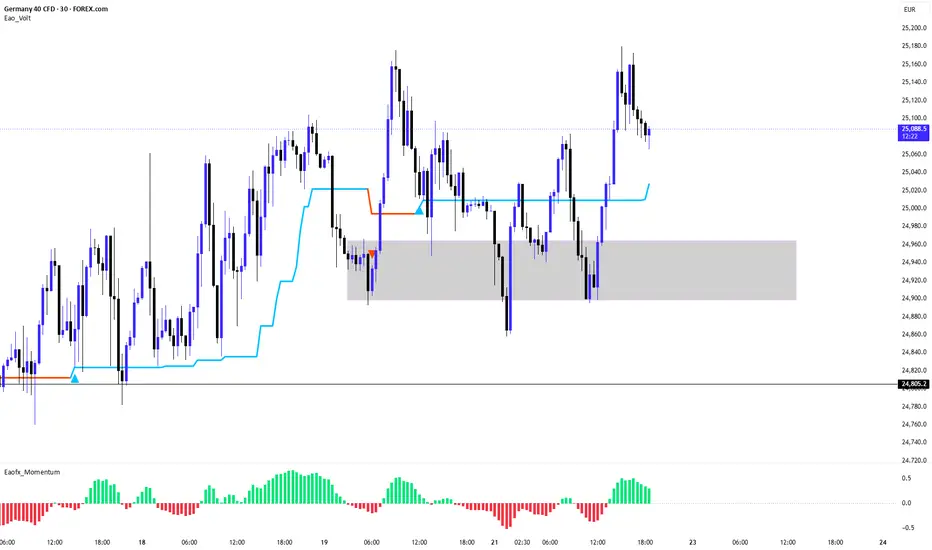
Eao_VoltMulti-condition trend indicator using smoothed highs/lows and range extremes to filter noise. Line trails as dynamic support/resistance; color flips on confirmed regime change. Arrows signal reversals. Adjustable Amplitude for scalping through swing trading. Best used with higher timeframes alignment and proper risk management always.
Wskaźnik

Wskaźnik

Eao_VoltEao_Volt — Multi-condition trend indicator using smoothed highs/lows and range extremes to filter noise. Line trails as dynamic support/resistance; color flips on confirmed regime change. Arrows signal reversals. Adjustable Amplitude for scalping through swing trading. Best used with higher timeframes alignment and proper risk management always.
Wskaźnik
MrRexo RBS# MrRexo Setup
MrRexo Setup is an open-source market structure and setup-mapping indicator for TradingView. It combines higher-timeframe bias, previous-period levels, all-time high tracking, BOS, FVG, price GAPs, high/low moving average bands, and optional entry markers in one chart overlay.
The script is designed for a dark, technical chart layout and is intended to help traders quickly read directional context, structure breaks, imbalance zones, and potential continuation setups without stacking multiple separate indicators.
## What This Indicator Shows
MrRexo Setup focuses on several core areas:
- Higher-timeframe bias for daily, weekly, and monthly context.
- Previous day, week, and month high/low levels.
- All-time high based on the chart history available to the script.
- Break of Structure levels.
- Fair Value Gaps.
- Candle-to-candle price GAPs.
- Distance and estimated closure probability for the nearest FVG and GAP above and below price.
- Fast and slow high/low moving average bands.
- Optional LONG/SHORT setup markers based on band behavior.
## Bias Panel
The compact panel shows directional bias for:
- D - daily bias
- W - weekly bias
- M - monthly bias
Bias can be calculated using either:
- close versus previous range,
- fast/slow moving average relationship.
The panel also shows the nearest FVG and GAP distance in both directions, together with a heuristic closure probability.
## Previous-Period Levels
The indicator can draw:
- PDH - previous day high
- PDL - previous day low
- PWH - previous week high
- PWL - previous week low
- PMH - previous month high
- PML - previous month low
- ATH - all-time high from available chart history
Each group has configurable colors, labels, line style, line width, and extension behavior.
## Market Structure
Break of Structure is detected using pivot-based structure levels. BOS labels are placed directly on the structure line to keep them visually different from entry markers.
Bullish and bearish BOS colors can be configured independently.
## FVG and GAP Zones
The script detects both Fair Value Gaps and candle-to-candle price GAPs.
FVG features:
- wick or body based definition,
- minimum size in ticks,
- right extension,
- optional hide-after-fill behavior,
- configurable expiration in days,
- label with date and size in ticks.
GAP features:
- minimum size in ticks,
- right extension,
- optional hide-after-fill behavior,
- configurable expiration in days,
- label with date and size in ticks,
- partial consumption: the GAP zone shrinks as price fills it and disappears after full closure.
## Moving Average Bands
MrRexo Setup includes fast and slow high/low bands. Each band is calculated from high and low prices, not just close.
Supported average types:
- EMA
- SMA
- SMMA
- WMA
Default band settings:
- Fast band: 33
- Slow band: 144
- Band type: WMA
## Entry Markers
The indicator can show optional LONG/SHORT setup markers. These are not strategy orders and do not execute trades.
Supported signal types:
- Cross through band
- Return to band
- Bounce from band
Each entry marker is displayed as:
- L for long setups,
- S for short setups,
- a vertical line from the signal candle upward,
- a tooltip with the full signal type, such as SHORT BOUNCE F or LONG RETURN S.
Entry labels can be positioned using:
- Dynamic top
- Range top
- Fixed price
This makes it possible to keep markers visually aligned at the top of the chart.
## Default Settings
Default values are tuned for a clean, technical layout:
- Fast/slow bands: 33/144
- Band type: WMA
- Minimum FVG size: 80 ticks
- Minimum GAP size: 150 ticks
- FVG/GAP expiration: 14 days
- Entry signal spacing: 15 minutes
- Bias background: disabled by default
- GAP and FVG zones: extended to the right by default
All key colors, labels, line widths, visibility toggles, and zone settings can be adjusted from the indicator settings panel.
## Important Notes
This is an indicator, not a strategy. It does not place orders, run backtests, or provide financial advice.
ATH is calculated from the historical data available to the script on the current TradingView chart. It may differ depending on symbol type, chart history, futures contract settings, continuous contract adjustments, and available data.
The closure probability shown for GAPs and FVGs is a heuristic model based on distance and zone age. It is not a statistical guarantee.
Use this tool as part of a broader trading plan, with your own confirmation process and risk management.
## Suggested Tags
market structure, bias, BOS, FVG, gap, price action, support resistance, trend, WMA, EMA, multi timeframe, liquidity, trading setup
Wskaźnik

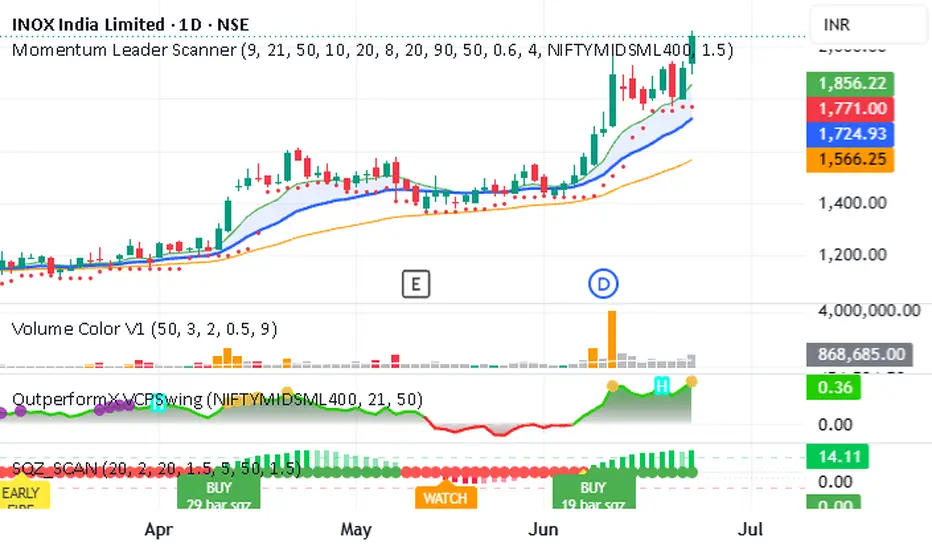
Momentum Leader Scanner - AshishMomentum Leader Scanner — a systematic tool for catching high-conviction momentum stocks after their initial breakout (EP candle), while they consolidate quietly in the EMA9/21 cloud before the next leg up. Combines relative strength vs. benchmark, proximity to 52-week highs, and a low-volume pullback filter to surface coiled setups — then locks a precise breakout trigger price the moment a setup is confirmed, so you can place your entry order in advance instead of reacting after the move has already started.
How it works
The script anchors its analysis to the most recent qualifying EP candle (a single-day move of 8%+ by default) and measures the stock's outperformance against a benchmark (default: NIFTYMIDSML400) since that candle — not over an arbitrary fixed window. This avoids one EP candle alone inflating a "strength" reading; the outperformance has to be sustained after the move, not just caused by it.
A setup requires four conditions together:
Outperformance vs benchmark since the EP candle exceeds a minimum threshold (default 10%)
Proximity to 52-week high (default within 20%) — confirming the stock hasn't lost its leadership
A qualifying EP candle within the detection window
A healthy pullback — price sitting inside the EMA9/EMA21 cloud (with a small tolerance for wick excursions) while the EMA9 > EMA21 > EMA50 stack stays intact, on below-average volume
When all four align, the script locks a breakout trigger price — the highest high since the EP candle — letting you pre-place a GTT order rather than waiting for a confirmed close above resistance, which is often a day or more late.
What it's good for
Catching stocks in the "coil after the jump" phase: violent move, quiet digestion, then continuation. It explicitly tracks how many separate EP candles have fired (visible as a diagnostic) so you can judge whether a stock had one clean catalyst or has been repeatedly volatile.
What it isn't built for
Slow, low-volatility grinders that never have a sharp EP candle (a different system altogether), and stocks that move too fast and too cleanly to ever pull back into the cloud on a daily timeframe.
Status
Actively used and refined against live market data — published as-is for traders who understand swing/momentum trading and want to incorporate systematic outperformance and pullback logic into their own process. Not financial advice; verify every signal against your own risk management before acting on it.
Wskaźnik
ADR 5 DAY Calculates ADR using the previous 5 or 10 completed trading days.
Automatically detects Forex instruments and displays values in pips.
Displays Futures, Indices, and Stocks in points.
Clean table display directly on the chart.
Useful for setting realistic profit targets and managing trade expectations.
Helps identify whether an instrument has already reached or exceeded its typical daily movement.
Wskaźnik

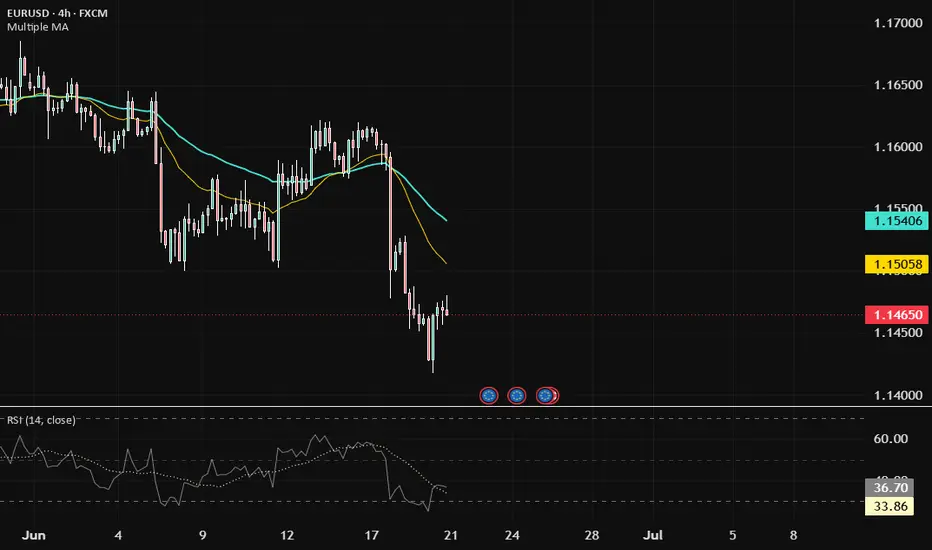
Really Moving Averages [BruzX]█ OVERVIEW
This indicator shows the the current values of up to five different moving averages (MA) as horizontal levels. Each moving average can have a different length and timeframe. This enables you to see quickly, easily and minimalistically the current values without having clutter your chart with multiple plots. The levels are displayed in a style which is visually consistent with the other indicators in the free and open-source "Really" series and they look good together. The lines start at the bar where the currently shown value is valid from, i.e. from the starting bar of the chosen timeframe. The averages are shown correctly for timeframes both greater than and less than the current chart timeframe. Note that the indicator uses the same dividends adjustment, back-adjustment and/or settlement price settings as are used on your charts, so make sure you have the charts set up as intended.
█ FEATURES
Shows the currently value of up to five moving averages with freely selectable lengths and timeframes. Add more instances for move that five MAs.
You can choose between Simple Moving Average (SMA), Exponential Moving Average (EMA) or Relative Moving Average (RMA), also known as the Wilder's Moving Average or the Smoothed Moving Average (SMMA). A single MA type is used for all the MAs. To use different MA types, add multiple instances of the indicator.
For symbols that have Extended Trading Hours (ETH) you can force the indicator to use only bars from Regular Trading Hours (RTH) even when the chart is showing ETH.
You can choose to include the currently forming bar (which causes repainting) or only bars which are confirmed in the chosen timeframe.
You can choose a colour, line style and line width. The same is used for all MAs. To use different colours, line styles or widths, add multiple instances of the indicator and configure each one differently.
Visually similar to other indicators in the free "Really" series (e.g. Really Key Levels).
█ RATIONALE
Why does this indicator exist? What does it bring over other MA indicators? Why isn't is part of Really Key Levels?
A simpler version of this indicator with three fixed lengths and timeframe used to be part of Really Key Levels. It was split out into this separate indicator to allow more options, to not overload Really Key Levels with options and since Really Key Level is not really meant for levels which usually change on every bar (as is the case with moving averages).
Most other MA indicator use plots, and when you want to monitor multiple MAs in parallel, this will cause the chart to quickly fill with lots of wiggly lines and can overwhelm the chart with clutter. This indicator only shows the current values as a limited length horizontal line.
The indicator is visually consistent with other "Really" indicators and looks good together with them. Users using other "Really" indicators may want to use this one for MAs to have pretty charts.
Handling data correctly from timeframes which can be either greater than or less that the chart timeframe is not trivial; this indicator does it right.
It was originally created by request from some users of the other "Really" indicators.
█ DISCLAIMER
This indicator is provided for information only and should not be used in isolation without a good understand of what is it showing and without considering other factors. You should not take trades using real money based solely on what this indicator says. Any trades you take are entirely at your own risk.
Wskaźnik

9 & 15 EMA Strategy [Trade Room]OVERVIEW
This indicator combines a fast/slow EMA crossover (default 9 and 15) with a
trend-slope filter and price-action candle confirmation to generate long and
short signals, along with automatically calculated take-profit and stop-loss
levels based on a user-defined risk:reward ratio.
The EMA 9/15 crossover is a long-standing, widely taught trend-following
concept in retail trading education. This script is my own original
implementation of that concept, built with additional filters to reduce
false signals in choppy conditions.
HOW IT WORKS
1. Trend filter: the script checks whether the fast EMA is above or below
the slow EMA to establish bullish or bearish bias.
2. Slope filter (optional): both EMAs must be sloping steeply enough,
measured as percentage change over a short lookback, to confirm the
move has real momentum rather than chopping sideways. This is adjustable
so it can be tuned per instrument and timeframe.
3. Price action filter (optional): a signal only fires when price pulls
back to the fast EMA and the resulting candle matches one of three
patterns — pin bar, engulfing, or an above-average range "big bar" —
in the direction of the trend.
4. TP/SL: stop-loss is placed at the signal candle's high/low, and take-
profit is calculated as a multiple of that risk distance, set by the
Risk:Reward input (default 1:2).
WHY IT'S USEFUL
Most EMA crossover scripts only plot crossovers, leaving the trader to
manually judge trend strength and risk levels. This script adds an
objective slope threshold and candle-pattern confirmation layer on top of
the crossover, and automatically plots calculated TP/SL levels so risk
is defined before entry, not after.
SETTINGS
- Fast/Slow EMA length — fully adjustable, not fixed to 9/15
- Slope filter toggle and threshold — tune sensitivity per asset/timeframe
- Candle pattern filter toggle
- Risk:Reward ratio for TP calculation
- Independent show/hide toggles for EMAs, labels, TP, and SL
- Alert conditions for both signal types
LIMITATIONS
Like any trend-following tool, this indicator will produce false signals
in ranging or low-volatility conditions. The slope filter is designed to
reduce — not eliminate — this. No indicator predicts price; this is a
decision-support tool, not financial advice, and past signal behavior is
not indicative of future results. Always backtest on your specific
instrument and timeframe and use proper risk management.
Wskaźnik

Wskaźnik

Price x Volume with MAs (Plus)Price × Volume with MAs (Plus)
Overview
The Price × Volume with MAs (Plus) indicator is a liquidity tracking tool designed to isolate major institutional accumulation and capital flow anomalies. While standard volume indicators only track the number of shares traded, this script computes the actual fiat dollar volume (Traded Value) using multi-timeframe anchoring, complete with dynamic background alert triggers for high-liquidity anomalies.
Key Features
Institutional Capital Spikes (Volatilty Alerts): The script continuously tracks immediate liquidity surges. If the raw currency volume exceeds its 20-period moving average by 1.8x or more, it triggers a clear Red Background Alert indicating a massive "institutional footprint." Normal market liquidity defaults to an Aqua background.
Anchored Daily Data Pipeline: No matter what intraday chart timeframe you view (e.g., 5-minute, 15-minute, or 1-hour), the main indicator panel uses request.security to strictly calculate and lock the Daily Typical Price and Daily Volume. This avoids localized scaling errors and presents the true macro daily capital allocation.
3-Tiered Capital Moving Averages: It features three independent moving averages (10-day, 25-day, and 75-day periods) to track short, medium, and long-term capital trends.
Clean Visual Architecture: To keep your workspace from getting cluttered, the Medium (25-day) and Long (75-day) lines run invisibly in the background by default (display = display.none). They handle backend trend alignment but can be turned back on instantly with a single checkmark in the indicator settings.
Core Moving Average Configurations
10-Day Moving Average (Green Line): Active by default. Captures fast, immediate short-term capital rotations.
25-Day Moving Average (Blue Line): Hidden by default. Tracks the one-month structural baseline for institutional activity.
75-Day Moving Average (Red Line): Hidden by default. Serves as a macro, quarterly trend line to identify permanent structural drift in big-money wallets.
How to Interpret and Trade This Script
Spotting the Whales (The Red Dynamic Background): When the background flashes Red, an unusually large sum of money has entered the asset relative to its historical trend line. This signal is crucial for identifying institutional block orders, heavy sector rotations, or earnings-related accumulation/distribution.
True Momentum Confirmation: When price is pushing higher and the plotted histogram columns climb comfortably above the Green 10-Day MA line, it indicates strong market commitment behind the trend, confirming that the move is well-funded rather than a low-liquidity retail trap.
Wskaźnik

TVMT- Alert Testing Indicator (Firing Test only)This indicator is exclusively for TVMT users. It is created for testing signal firing and alert demonstrations only, and should not be considered a complete trading strategy.
For more information, please visit: tvmt.lorghic.com
Wskaźnik

Kevin's swingdicatorsKevin's swingdicators
Kevin's swingdicators is a combined indicator for swing trading analysis. It includes an RSI divergence module and a configurable moving average ribbon.
The moving average module plots up to six moving averages on the price chart. By default, the first four moving averages are enabled: 20 SMA, 50 SMA, 100 SMA and 200 SMA. The fifth and sixth moving averages are disabled by default and can be configured manually. Users can change the moving average type, source, length and color.
The RSI module is displayed in a separate pane below the price chart. It includes optional detection of regular and hidden RSI divergences. Divergences are detected by comparing RSI pivots with the corresponding price highs or lows on the same bars.
Regular bullish divergence occurs when price makes a lower low while RSI makes a higher low. This can indicate weakening bearish momentum and a possible bullish reversal.
Regular bearish divergence occurs when price makes a higher high while RSI makes a lower high. This can indicate weakening bullish momentum and a possible bearish reversal.
Hidden bullish divergence occurs when price makes a higher low while RSI makes a lower low. This is generally interpreted as a possible bullish trend-continuation signal.
Hidden bearish divergence occurs when price makes a lower high while RSI makes a higher high. This is generally interpreted as a possible bearish trend-continuation signal.
The RSI divergence module includes three preset modes:
- Conservative: RSI length 14, pivot left 5, pivot right 5.
- Medium: RSI length 7 or 9, pivot left 3, pivot right 3.
- Aggressive: RSI length 5, pivot left 1, pivot right 3.
The conservative preset produces fewer signals and is intended to reduce noise. The aggressive preset produces more signals and reacts faster, but it may also produce more false signals. The medium preset is a compromise between both.
This indicator is intended for educational and analytical use only. It does not provide financial advice, buy signals or sell signals. RSI divergences should not be used in isolation. They are best interpreted together with market structure, support and resistance, trend direction, moving averages, volume, Fibonacci levels and other forms of technical analysis.
Dutch documentation is provided below.
## Nederlandse documentatie
Handig als je de gratis versie van Tradingview hebt of als je in 1 keer de setup klaar wil hebben zoals Kevin trade. Alles binnen 1 indicator, dus ruimschoots binnen de twee die je bij een gratis account van TV mag gebruiken.
De volgende indicatoren zijn hier gebundeld:
# Zes moving averages
Bij default staat dit ingesteld:
* 20SMA, blauw
* 50SMA, rood
* 100SMA, oranje
* 200SMA, grijs
Je kunt er desgewenst nog twee extra toevoegen, als je dat graag wilt. Deze staan default uit. Uiteraard kun je eventueel ook het type MA veranderen (bijv. exponentieel) en de kleuren wijzigen. Maar de defaults passen bij de instellingen die Kevin hanteert.
# Relative Strength Indicator
De RSI staat in een pane onder de chart.
## RSI divergentie
Als extra opties kan de RSI indicator ook bearish en bullish divergences identificeren (maar dat kun je ook uit zetten). Je kunt divergenties op meerdere manieren bepalen, de default is de "conservatieve" setting:
* Conservatief: gebruikt de lengte 14 (de wereldwijde RSI standaard), gebruikt 5 bars links en 5 bars rechts om een relevante low of high te bepalen.
* Aggresief: lengte 5 en 1 bar links en 3 rechts. Dit geeft veel meer divergenties en dus ook meer ruis. Maar als je aggresiever wilt traden, dan is dit er voor je.
Je kunt ook zelf de diverse instellingen wijzigen naar smaak en trading stijl.
Een **RSI-divergentie** ontstaat wanneer de prijs en de RSI niet meer dezelfde richting bevestigen. De prijs maakt bijvoorbeeld een nieuwe high of low, terwijl de RSI dat niet doet. Omdat RSI momentum meet, kan zo’n verschil erop wijzen dat de kracht achter de huidige beweging afneemt of juist dat een correctie binnen een trend bijna klaar is.
RSI-divergenties worden meestal berekend door twee opeenvolgende **swing points** of **pivots** met elkaar te vergelijken:
```text
Prijs-pivot 1 versus prijs-pivot 2
RSI-pivot 1 versus RSI-pivot 2
```
In deze indicator worden de pivots gevonden op basis van de RSI. Daarna wordt op dezelfde bars gekeken wat de prijs deed. Een bullish divergentie gebruikt doorgaans RSI-pivot lows en prijs-lows. Een bearish divergentie gebruikt RSI-pivot highs en prijs-highs.
---
# Reguliere RSI-divergentie
Een **reguliere divergentie** wijst meestal op een mogelijke **trendomkeer**. De prijs zet de bestaande beweging nog door, maar de RSI bevestigt die nieuwe extreme niet meer.
## Regular bullish divergence
Een **regular bullish divergence** ontstaat wanneer:
```text
Prijs: lagere low
RSI: hogere low
```
Berekening:
```text
current price low < previous price low
current RSI low > previous RSI low
```
Interpretatie:
De prijs maakt een nieuwe lagere bodem, maar de RSI maakt juist een hogere bodem. Dat betekent dat de neerwaartse beweging in prijs niet meer volledig wordt bevestigd door momentum. De verkoopdruk kan dus afnemen.
Voorbeeld:
```text
Prijs low 1 = 100
Prijs low 2 = 95
RSI low 1 = 25
RSI low 2 = 32
```
De prijs is zwakker, maar de RSI is sterker. Dit wordt meestal gezien als een mogelijk bullish reversal-signaal.
---
## Regular bearish divergence
Een **regular bearish divergence** ontstaat wanneer:
```text
Prijs: hogere high
RSI: lagere high
```
Berekening:
```text
current price high > previous price high
current RSI high < previous RSI high
```
Interpretatie:
De prijs maakt een nieuwe hogere top, maar de RSI maakt een lagere top. De opwaartse beweging wordt dus niet meer volledig bevestigd door momentum. De koopdruk kan afnemen.
Voorbeeld:
```text
Prijs high 1 = 100
Prijs high 2 = 106
RSI high 1 = 75
RSI high 2 = 67
```
De prijs is sterker, maar de RSI is zwakker. Dit wordt meestal gezien als een mogelijk bearish reversal-signaal.
---
# Hidden RSI-divergentie
Een **hidden divergence** is anders. Waar een reguliere divergentie meestal op een mogelijke draai wijst, wijst een hidden divergence meestal op mogelijke **trendvoortzetting**.
Bij hidden divergence blijft de prijsstructuur in de richting van de trend intact, maar de RSI corrigeert sterker dan de prijs. Dat kan betekenen dat de markt intern momentum heeft “gereset”, terwijl de trend zelf nog niet gebroken is.
---
## Hidden bullish divergence
Een **hidden bullish divergence** ontstaat meestal binnen een bestaande uptrend.
Voorwaarde:
```text
Prijs: hogere low
RSI: lagere low
```
Berekening:
```text
current price low > previous price low
current RSI low < previous RSI low
```
Interpretatie:
De prijs blijft relatief sterk, omdat hij een hogere bodem maakt. De RSI maakt echter een lagere bodem, wat aangeeft dat de oscillator dieper is gecorrigeerd. Dit kan betekenen dat de pullback voldoende is afgekoeld terwijl de bullish prijsstructuur intact blijft.
Voorbeeld:
```text
Prijs low 1 = 100
Prijs low 2 = 104
RSI low 1 = 40
RSI low 2 = 31
```
De prijs maakt een hogere bodem, maar RSI maakt een lagere bodem. Dit wordt vaak gezien als een bullish continuation-signaal.
---
## Hidden bearish divergence
Een **hidden bearish divergence** ontstaat meestal binnen een bestaande downtrend.
Voorwaarde:
```text
Prijs: lagere high
RSI: hogere high
```
Berekening:
```text
current price high < previous price high
current RSI high > previous RSI high
```
Interpretatie:
De prijs blijft relatief zwak, omdat hij een lagere top maakt. De RSI maakt echter een hogere top, wat aangeeft dat de oscillator sterker is opgeveerd dan de prijs. Dit kan betekenen dat de tijdelijke bounce voldoende is afgekoeld, terwijl de bearish prijsstructuur intact blijft.
Voorbeeld:
```text
Prijs high 1 = 100
Prijs high 2 = 96
RSI high 1 = 58
RSI high 2 = 69
```
De prijs maakt een lagere top, maar RSI maakt een hogere top. Dit wordt vaak gezien als een bearish continuation-signaal.
---
# Belangrijkste verschil tussen regular en hidden divergence
Het verschil zit zowel in de **berekening** als in de **interpretatie**.
| Type | Prijs | RSI | Meestal geïnterpreteerd als |
| --------------- | ----------: | ----------: | -------------------------------- |
| Regular bullish | lagere low | hogere low | mogelijke omkeer omhoog |
| Regular bearish | hogere high | lagere high | mogelijke omkeer omlaag |
| Hidden bullish | hogere low | lagere low | mogelijke voortzetting uptrend |
| Hidden bearish | lagere high | hogere high | mogelijke voortzetting downtrend |
Kort gezegd:
```text
Regular divergence = prijs maakt een nieuw extreme, RSI bevestigt niet.
Hidden divergence = prijsstructuur blijft intact, RSI corrigeert dieper.
```
Of nog compacter:
```text
Regular divergence = mogelijke reversal
Hidden divergence = mogelijke continuation
```
---
# Gebruik in de praktijk
Een RSI-divergentie is geen zelfstandig koop- of verkoopsignaal. In Kevin's aanpak gebruiken we divergenties als contextsignaal.
Een reguliere bullish divergence is sterker wanneer die verschijnt rond steun, na een duidelijke daling, of wanneer daarna een hogere high in prijs ontstaat. Een reguliere bearish divergence is sterker rond weerstand, na een duidelijke stijging, of wanneer daarna een lagere low in prijs ontstaat.
Hidden bullish divergence is vooral relevant in een bestaande uptrend. Hidden bearish divergence is vooral relevant in een bestaande downtrend. Zonder trendcontext zijn hidden divergences minder betrouwbaar, omdat ze bedoeld zijn als voortzettingssignalen.
Gebruik RSI-divergenties alleen in combinatie met sterke levels, ronde getallen, Fibonacci, tend, moving averages, et cetera.
Wskaźnik

EMA Zone Retest (20/50)Work in progress, EMA indicator which uses retesting EMA x3 times for buy signals and x1 EMA retest for sells. Use own risk management if using, and don't use the indicator blindly. On back test 1st June to 19th June it had a 65% success rate on 2:1RR
Wskaźnik

PRIORAXIS Zone BandsPRIORAXIS 200W Zones
WHAT IT SHOWS
This indicator measures how far Bitcoin's price is stretched from its
200-week moving average — one of the most-watched secular levels in BTC —
and ranks that distance against its own history on a 0–1 scale. The result
is split into five zones, Deep Value through Distribution, drawn as price
bands on the chart and colored on the bars.
HOW IT WORKS
Each week it takes the ratio of price to its 200-week MA, then finds where
that ratio sits in its own historical distribution (a rolling percentile).
The zone boundaries are percentile thresholds; each band is the price level
where that percentile historically sat, multiplied by today's 200-week MA.
Because the percentiles roll forward, the bands self-adjust as new cycles
print — the upper band compresses over time on its own, reflecting
Bitcoin's diminishing cycle amplitude. No fixed multipliers, no
curve-fitting.
HOW TO USE IT
Run it on the weekly timeframe, on a log price scale, on a long-history
Bitcoin symbol. Read it as secular context, not a timing signal: it tells
you whether price is historically cheap or expensive relative to its
long-term mean, so accumulation and distribution decisions are anchored to
data instead of emotion. The zone boundaries are inputs — adjust them to
your own framework.
WHAT IT IS NOT
This is a single factor. It lags, it does not call tops or bottoms, and its
extremes are estimated from a small number of historical cycles — treat the
boundaries as approximate, not precise. It is one input of a broader
multi-factor framework, not a complete model and not a trading system.
OPEN SOURCE BY DESIGN
The full code is public and verifiable. If you can read it, you can check
exactly what it does. No black box.
For informational and educational purposes only. This is not financial
advice, not a recommendation to buy or sell any asset, and past behavior
does not predict future results. Do your own research.
Wskaźnik

EMA + Horizontal Levels + ATHEMA + Horizontal Levels + ATH
อินดิเคเตอร์รวม 3 ฟีเจอร์ในตัวเดียว ออกแบบมาเพื่อใช้ดูแนวรับ-แนวต้านและทิศทางเทรนด์ในการเทรด เหมาะกับการเทรดทอง (XAU/USD) และสินทรัพย์อื่นๆ
ฟีเจอร์หลัก
EMA 5 เส้น – เปิด/ปิดและตั้งค่าได้อิสระทุกเส้น (ความยาว/สี) พร้อมป้ายแสดงราคาปัจจุบันของแต่ละเส้น
Horizontal Lines อัตโนมัติ – ลากเส้นแนวนอนรอบราคาปัจจุบัน ห่างกันเท่าๆกันตามค่าที่ตั้ง (default ห่างกัน 5) พร้อมป้ายราคากำกับทุกเส้น ช่วยดูระดับราคาได้ละเอียดในกรอบที่กำลังเคลื่อนไหว
ATH Levels – ลากเส้นระดับราคาสูงสุดเป็นประวัติการณ์ (All-Time High) ตามค่าที่กำหนดไว้ล่วงหน้า ปรับแก้ไขรายการราคาได้เองในช่อง Input พร้อมป้ายกำกับ
EMA + Horizontal Levels + ATH
An all-in-one indicator combining 3 features, designed to help you read support/resistance levels and trend direction at a glance. Great for gold (XAU/USD) trading and other instruments.
Key Features
5 Configurable EMAs – Enable/disable and customize each EMA independently (length, color), with live price labels for each line.
Automatic Horizontal Lines – Draws evenly spaced horizontal levels around the current price (default spacing: 5), each labeled with its price. Helps you spot fine-grained price levels within the current trading range.
ATH Levels – Plots All-Time High price levels from a fully customizable list. Edit the values directly in the inputs, with optional labels for each level.
Wskaźnik

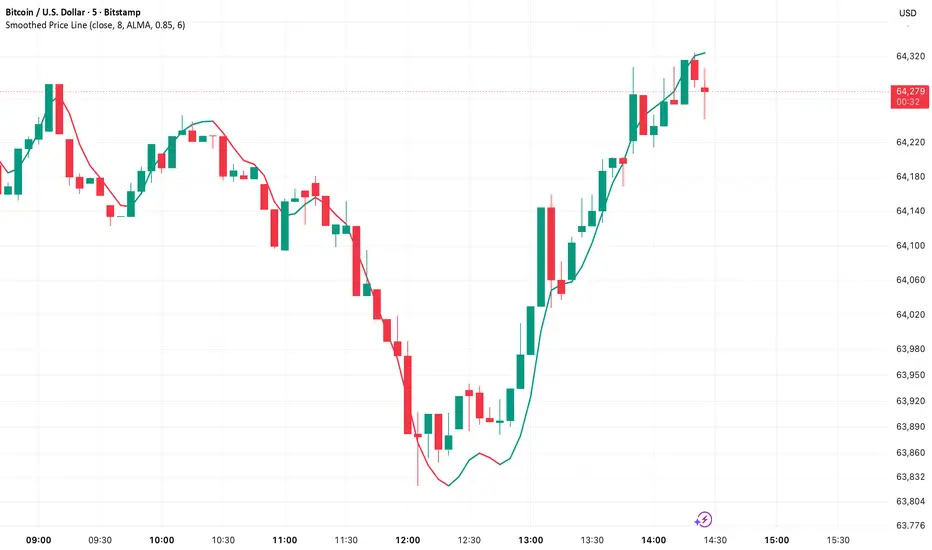
Smoothed Price LineThis pinescript indicator smoothens the line chart of the price. You can turn off the body and wicks in the chart to only see the indicator. the smoothness is adjustable.
Wskaźnik
CodeTrades Sub-50ms Webhook FormatterMost Indian F&O traders bleed capital because they route TradingView webhooks through third-party servers (Zapier/Make), introducing 1.5s+ of queuing latency during breakouts.
This script formats the exact, strict JSON payload required to bypass those third-party queues. It is designed to be routed directly into a localized Python Flask middleware utilizing a Pandas RAM-cache for O(1) memory lookups. This drops your execution latency to sub-50ms and entirely eliminates DH-905 rejection errors on Dhan and Zerodha.
You can download the mandatory backend Python infrastructure to run this script for free on my GitHub: github.com
Wskaźnik

ATH & 52W high with 8 MAsTracks all time highs and 52w high along with 8 highly customisable moving averages , default setting are suitable for stock markets and can be curated anyhow within limits at your own discretion
Wskaźnik

Price X Volume with MAs (10, 25, 75)Price X Volume with MAs (10, 25, 75 MAs + Real-Time Summary Dashboard)
Overview
Volume alone only tells you how many shares changed hands, but it completely ignores the monetary size of those transactions. Trading a million shares of a $2 stock is vastly different from trading a million shares of a $200 stock.
The Daily Traded Value indicator solves this by calculating the exact Dollar Volume (Typical Price × Volume) traded every single day, regardless of what intraday timeframe you are currently viewing. It smooths this institutional capital flow using three optimized moving averages (10-day, 25-day, and 75-day) and overlays a real-time, clean Summary Dashboard right in the corner of your indicator panel for instant data reading.
Key Features
True Daily Dollar Volume: Multiplies the daily volume by the daily typical price ((High+Low+Close)/3) to show the actual monetary value entering or exiting the asset.
Multi-Timeframe Anchoring: No matter if you are looking at a 5-minute chart or a 1-hour chart, the indicator uses request.security to strictly compute and display the Daily values.
3-Tiered Trend Analysis: Features three independent moving averages (10, 25, and 75 periods) to track short, medium, and long-term capital trends.
On-Screen Summary Dashboard: A semi-transparent floating table in the top-right corner displays today's exact traded capital alongside the precise values of all three moving averages.
Smart Auto-Formatting: The summary table automatically formats massive numbers dynamically into easily readable Millions (M) or Billions (B) depending on the stock's liquidity pool.
Understanding the 3 Moving Averages
By evaluating capital flow across three distinct horizons, you can easily read institutional behavior:
10-Day Moving Average (Yellow Line): Tracks immediate, fast-reacting momentum. Highlights sudden retail frenzies or immediate algorithmic buying spikes.
25-Day Moving Average (Orange Line): Represents the roughly 1-month structural baseline. This acts as the medium-term equilibrium for money flow.
75-Day Moving Average (White Line): Represents a macro, quarterly trend (approx. 75 trading days in a quarter). This is the key line used to identify heavy institutional accumulation or distribution.
How to Trade / Interpret This Indicator
Institutional Accumulation (Bullish Trend Confirmation): Look for a perfect bullish stack where the 10 MA is above the 25 MA, and the 25 MA is above the 75 MA, with all lines sloping upward. This proves that big funds are consistently maintaining buying pressure over a full financial quarter.
The Volume Crossover Entry: When a stock is consolidating sideways and the short-term 10-day MA crosses aggressively above the 25-day or 75-day line, it implies a massive influx of capital is entering the stock relative to its historical baseline—often preceding a major price breakout.
Liquidity Exhaustion (Divergence): If the price is making new highs but today's Traded Value bars and the fast 10-day MA are failing to breach older volume peaks, liquidity is drying up. This divergence warns you that the rally is hollow and thin, suggesting a potential trend reversal.
Inputs & Customization
Through the indicator settings gear icon, you can completely customize:
Short MA Period: Default is 10.
Medium MA Period: Default is 25.
Long MA Period: Default is 75.
Colors & Styles: Easily adjust the line thicknesses or colors to perfectly match your chart's theme.
Author Note: This tool is designed to help value investors and momentum traders track exactly where the "Big Money" is moving. If you find this script useful, please leave a like and follow for more custom utilities!
Wskaźnik

Multiple SMAs/EMAsMulti.MA displays up to 9 configurable moving averages, with automatic HighTimeFrame/LowTimeFrame logic that adapts the visible MAs based on the chart timeframe.
Wskaźnik
Cyberbikes Fusion (SMAEMA+MACD+RSI)## Cyberbikes Fusion (SMAEMA+MACD+RSI)
### What it is
A **trend + momentum fusion** indicator. Instead of watching three separate tools, it folds them into one signal:
1. **SMA+EMA blend** — your 8 moving averages (4 EMAs + 4 SMAs at 9/21/80/200) are merged into one combined line, then smoothed into its own SMA and EMA. This is the **trend** backbone.
2. **MACD histogram** — the **momentum** of the trend (is it accelerating or fading).
3. **RSI** — **overbought/oversold** pressure (0–100).
All three are normalized to the same 0–100 scale and weighted-averaged into a single "universal" reading. A light-blue **EMA (thick)** and **SMA (thin)** are drawn from that, and the gap between them is painted **green when bullish / rising** and **red when bearish / falling**.
### What each piece tells you
| Component | Answers the question |
|---|---|
| Combined SMA+EMA | *Which way is the broader trend leaning?* |
| MACD | *Is momentum building or stalling?* |
| RSI | *Is price stretched (overbought/oversold)?* |
| **Green/red color** | *Are all of the above agreeing right now?* |
The whole point is **confluence** — the signal only commits to green or red strongly when trend, momentum, and RSI **agree**. When they disagree, they partially cancel and it sits neutral. That agreement-filter is what reduces false signals versus reading any one indicator alone.
### How to use it
**The green/red flip is the primary signal:**
- **Red → green** = bullish shift (trend + momentum turning up together). Look for **long** setups.
- **Green → red** = bearish shift. Look for **exits or shorts**.
**Best practice — treat it as confirmation, not a standalone trigger:**
1. **Direction first** — only take longs while it's green, shorts while it's red. Don't fight the color.
2. **Confirm your entries** — when your own setup (support bounce, breakout, pullback) lines up *and* the color agrees, that's a higher-probability entry.
3. **Watch for the EMA/SMA cross** — the thick EMA crossing the thin SMA marks the momentum turn; the alerts (`Bullish`/`Bearish`) fire there.
4. **Stay out of chop** — if the color is flickering green/red rapidly, the market is ranging and signals are unreliable. Wait for a clean, sustained color.
### Timeframe behavior
The smoothing length **auto-adjusts to your chart timeframe** (shorter on higher timeframes), so it stays responsive without re-tuning. Higher timeframes (4h/Daily) give cleaner, fewer signals; lower timeframes (1–15m) give more signals but more noise.
### Honest limitations
- It's a **blend of lagging + momentum** tools — it confirms moves, it doesn't predict tops/bottoms.
- In **sideways/low-volume** markets it will whipsaw like any MA-based system. Size down or stand aside.
- Best used **with** price-action and a risk plan (stops/position sizing), never as a sole auto-trade trigger.
---
Want me to **bake this description into the script as a header comment block** (so it travels with the code), or write it up as a short `.md` doc saved next to the `.pine` file?
Wskaźnik

SMA & EMA 9/10/20/21/50/100/200Dual-Type Averages: Combines 5 Simple Moving Averages (SMAs) and 5 Exponential Moving Averages (EMAs) into a single, unified indicator.
Wskaźnik
