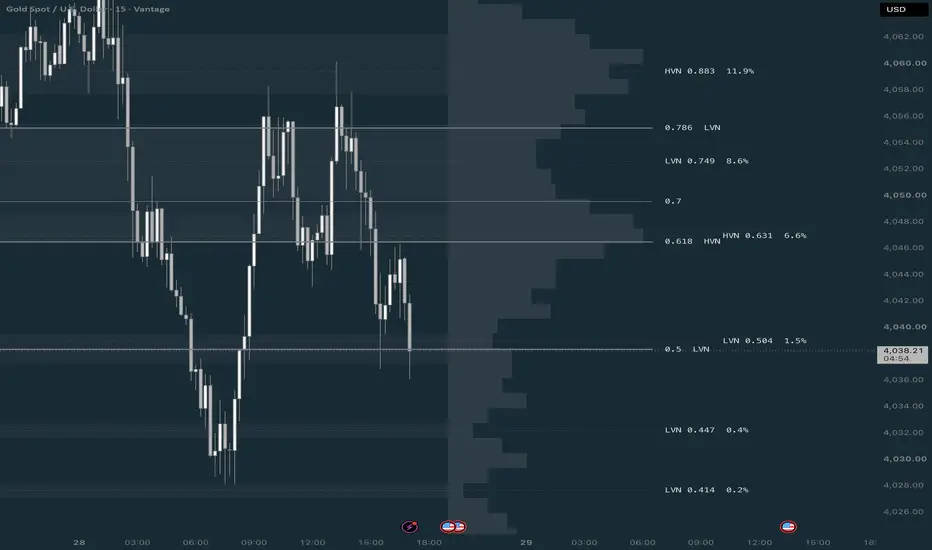
Wskaźnik
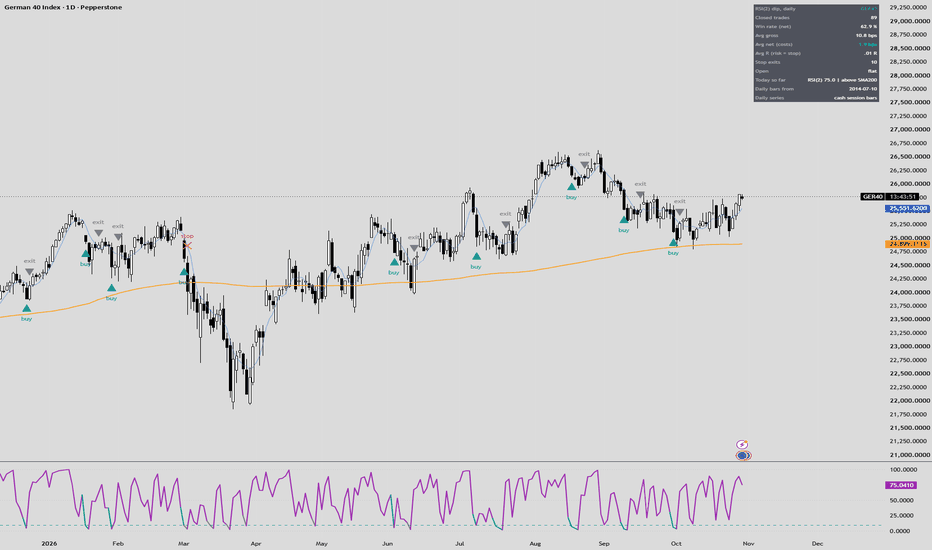
Wskaźnik
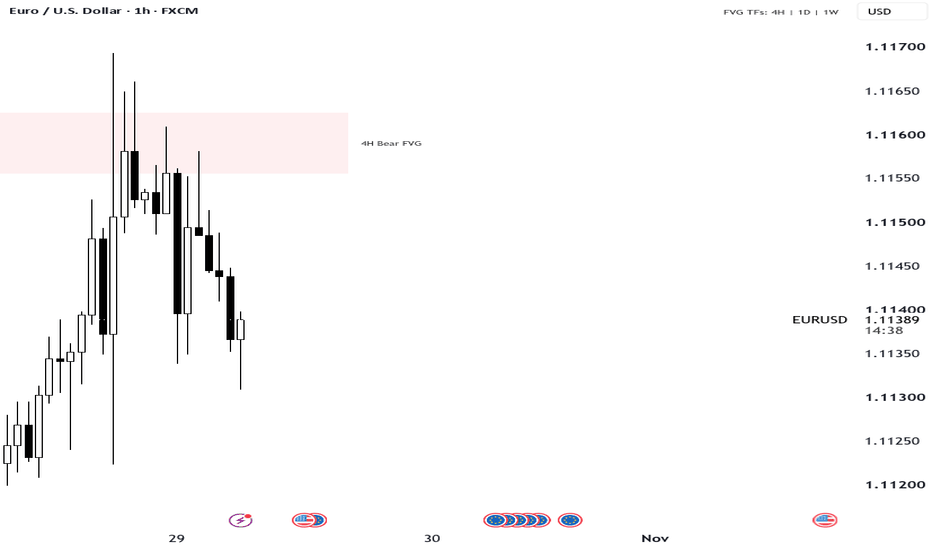
Wskaźnik
Wskaźnik
Wskaźnik
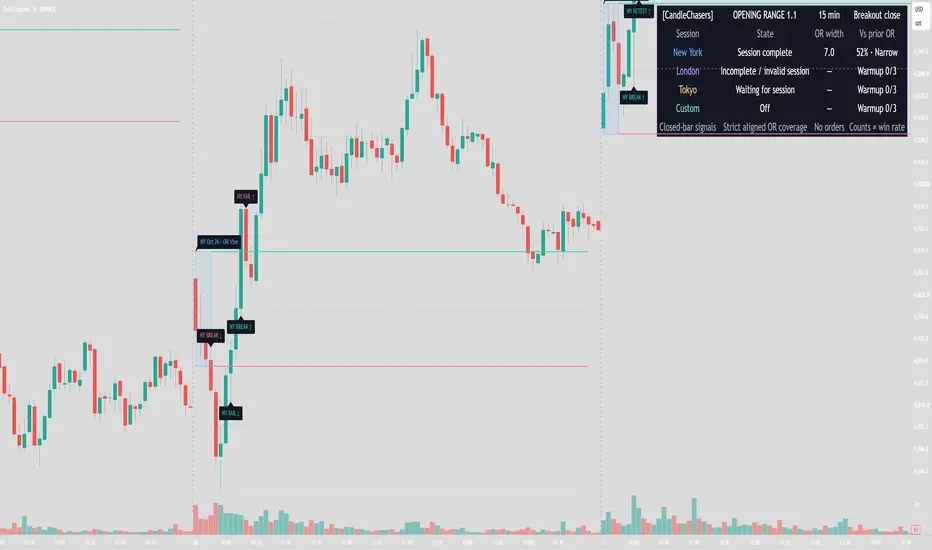
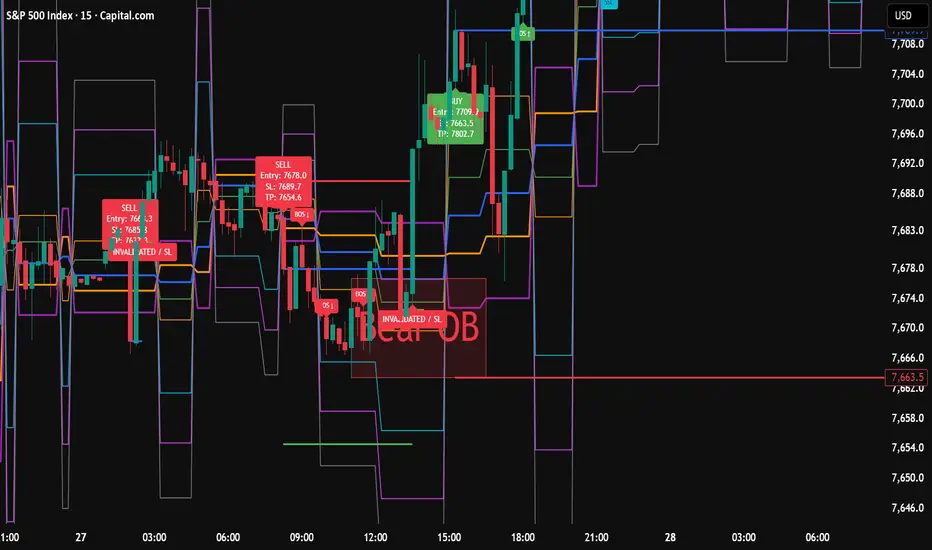
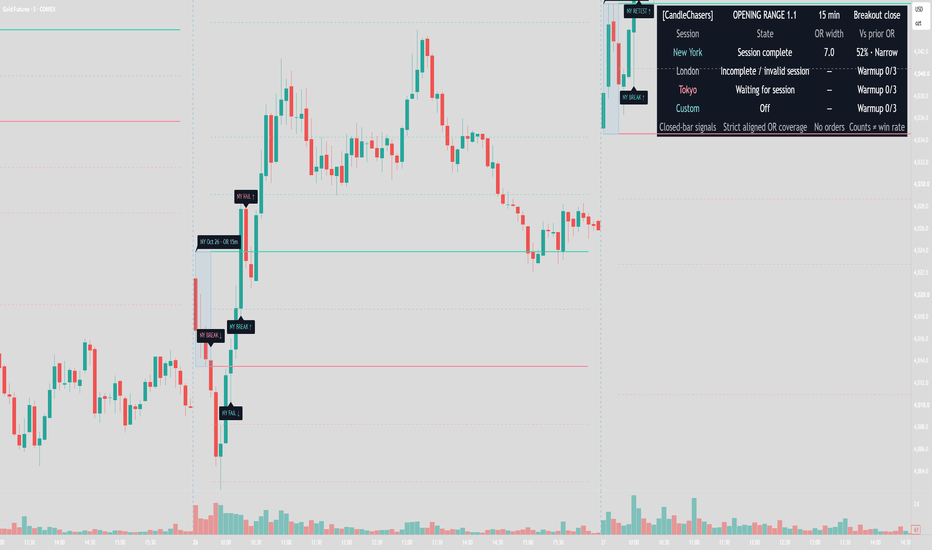
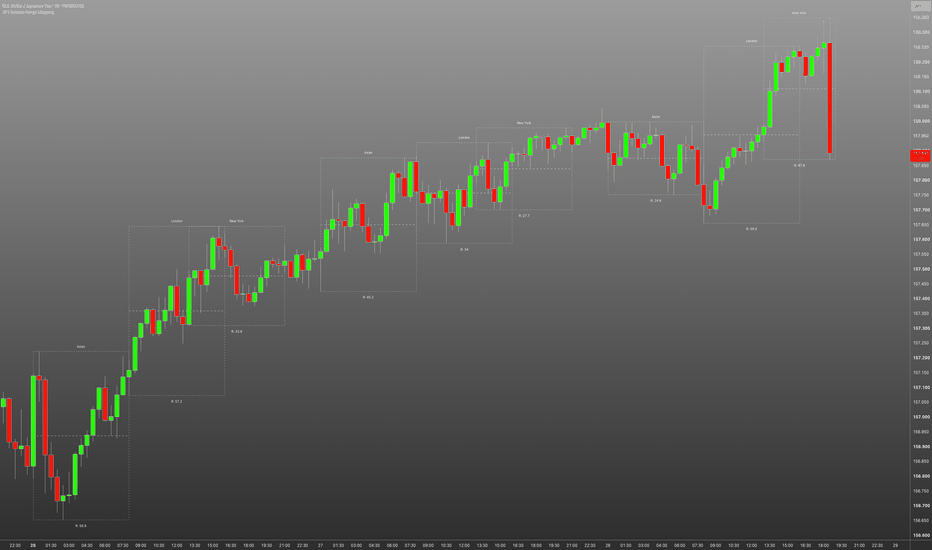
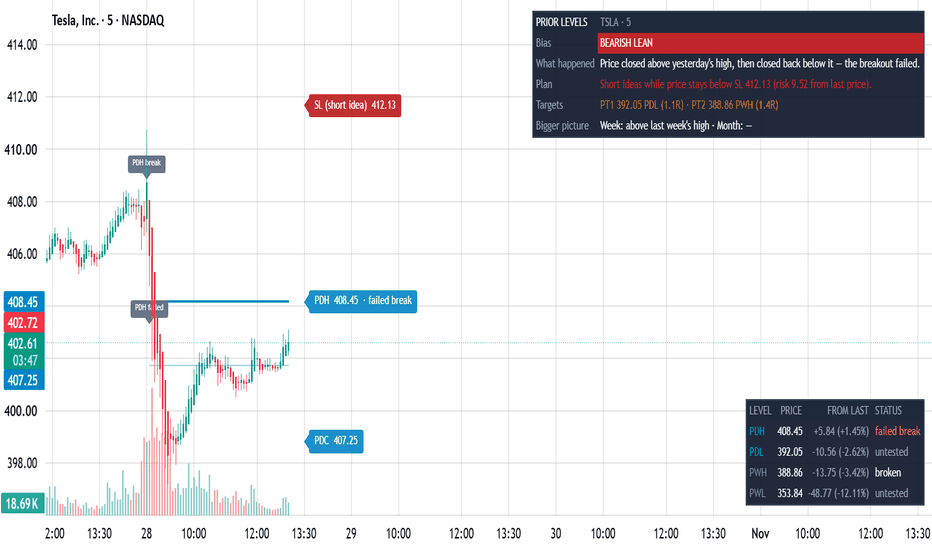
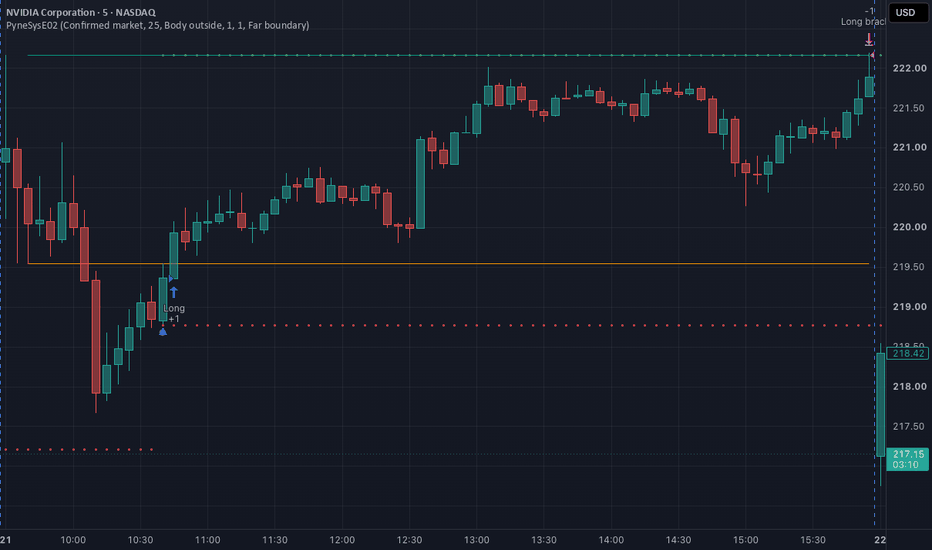
Opening Range & Session Breakouts [CandleChasers]Opening Range & Session Breakouts
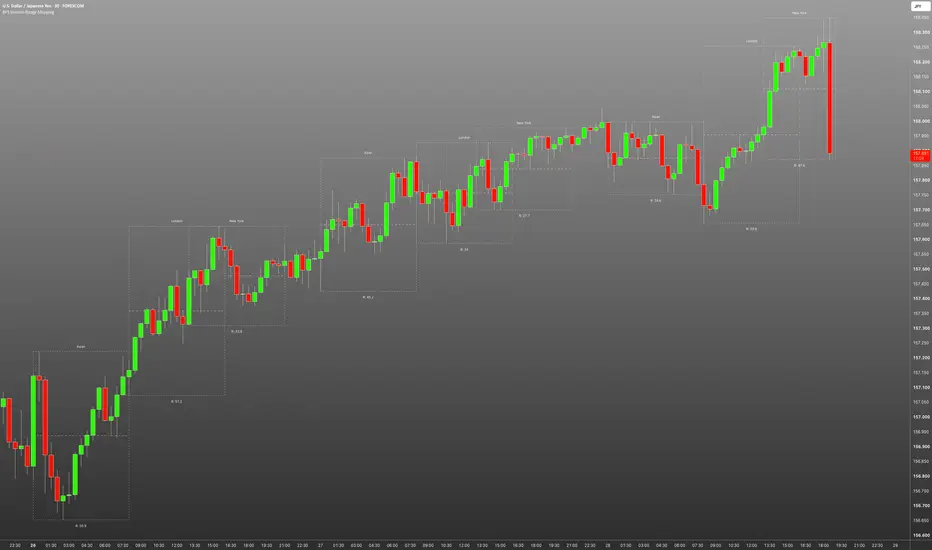
A session-based opening range indicator for tracking completed range levels, closing breakouts, retests, and failed breakouts. Independent session windows, optional qualification filters, range extensions, historical drawings, and configurable alerts provide a consistent framework for intraday analysis.
OPENING RANGE
Choose a 5-, 15-, 30-, or 60-minute opening range, or enter a custom duration.
The indicator tracks the opening high and low, then locks t Wskaźnik
Wskaźnik
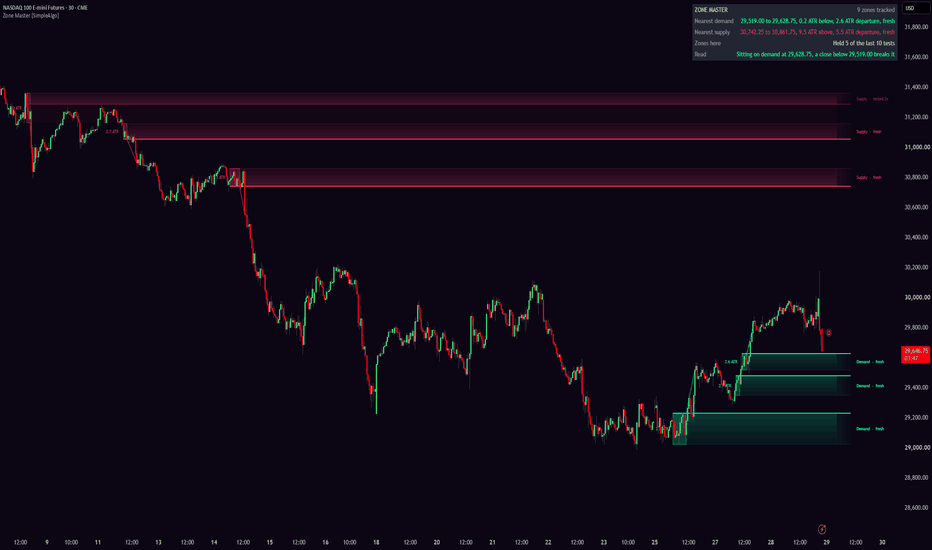
Wskaźnik
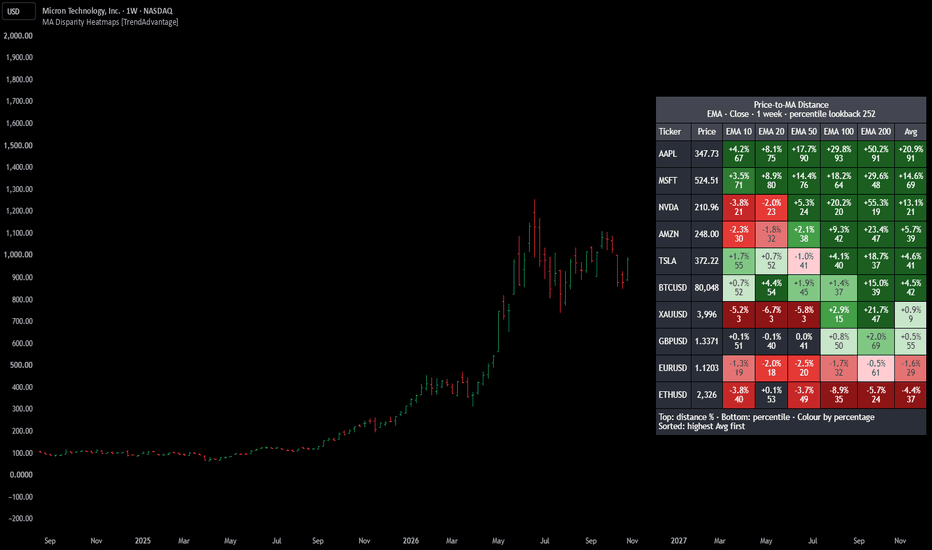
Wskaźnik
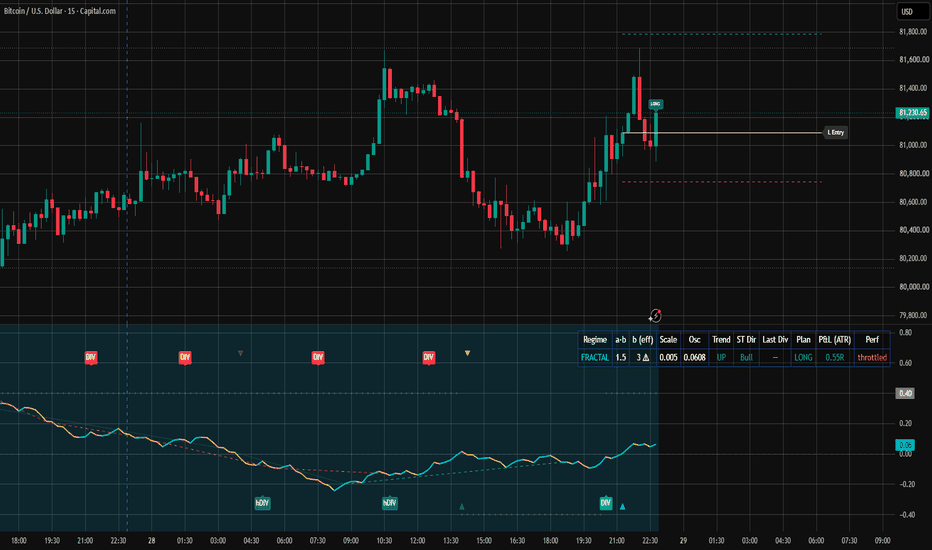
Wskaźnik
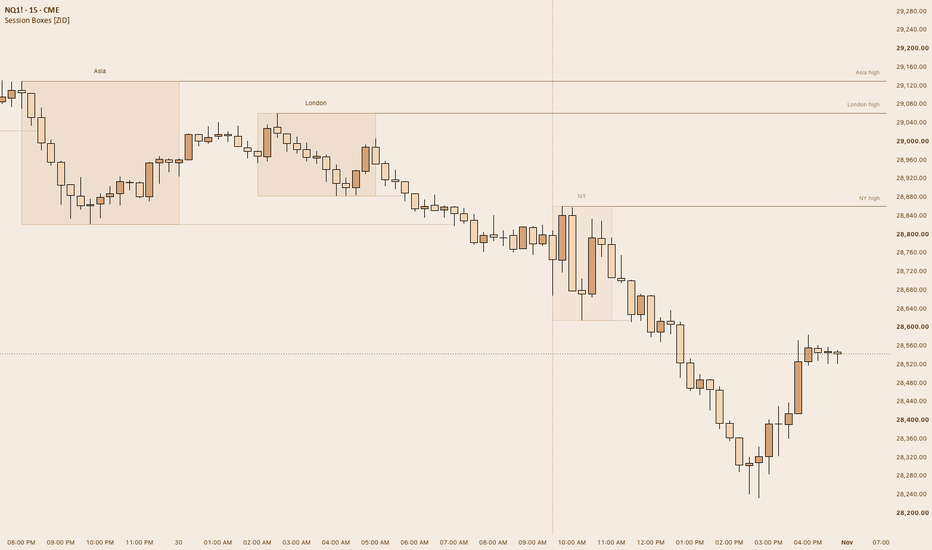
Wskaźnik
Wskaźnik
Wskaźnik
Wskaźnik
Wskaźnik
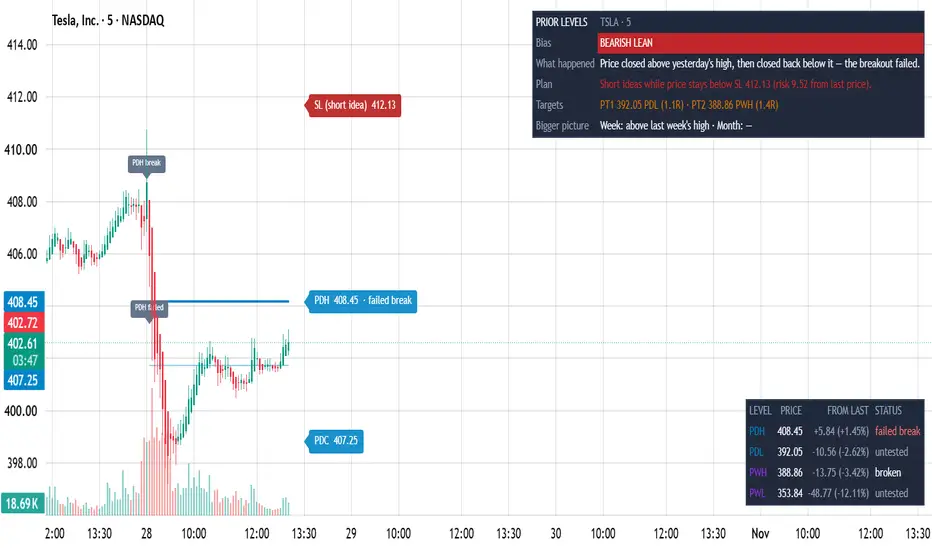
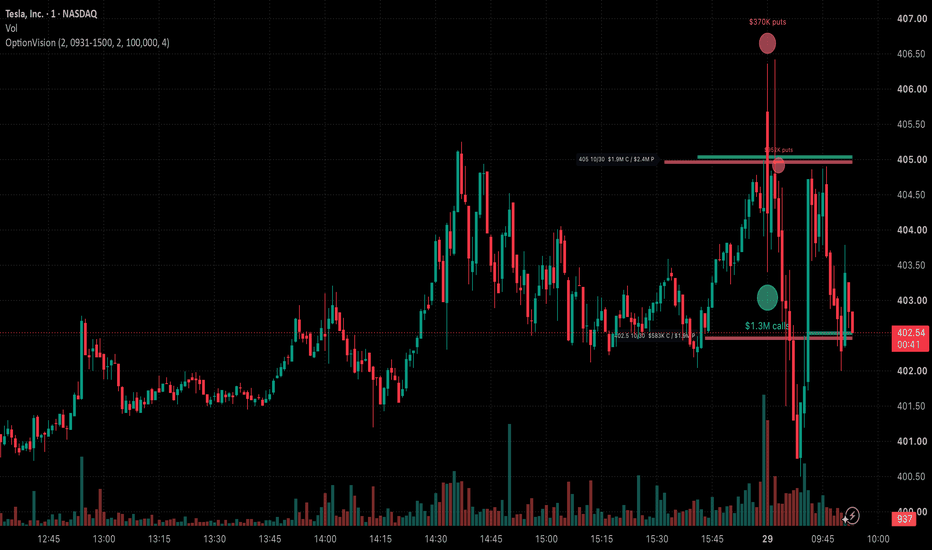
OptionVision: Live Options Flow & Signals for TSLA, NVDA, SPYLive options flow, unusual options activity and option signals overlaid right on the price chart. See where big option orders hit, which strikes are busiest today, and when an option's premium breaks its high of the day, on TSLA, NVDA, SPY, QQQ, AAPL, MSFT, META, AMD, NFLX, MRNA, HOOD, INTC, MSTR, SMCI, MU and any other optionable US stock or ETF.
OptionVision puts live option activity on the stock chart, computed entirely from TradingView's own OPRA option data. Nothing is hard-coded: signals, Wskaźnik
Wskaźnik
Wskaźnik
Wskaźnik

Strategia
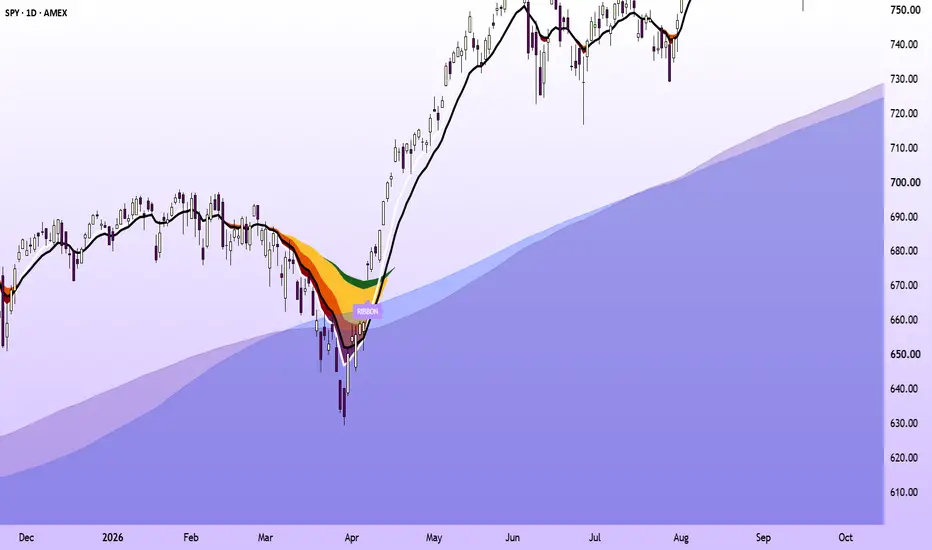
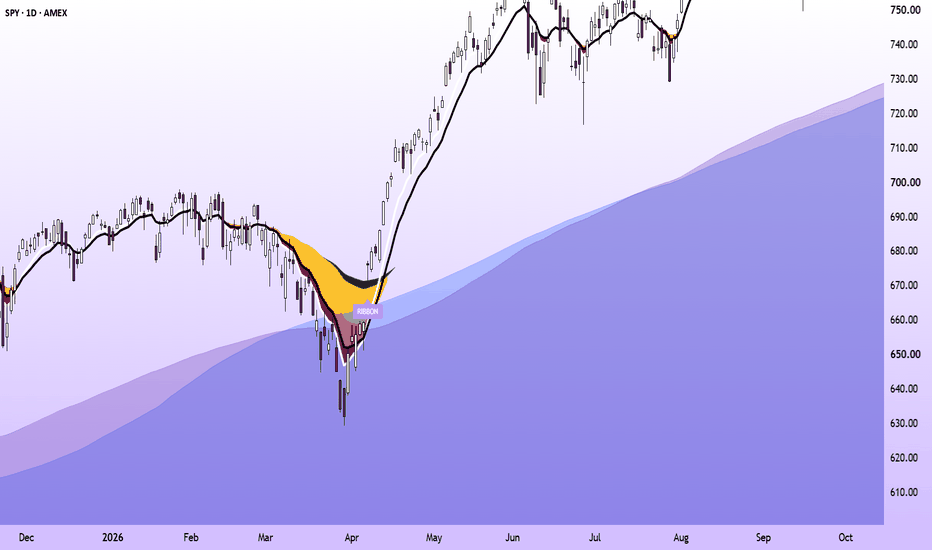
Riverstone RibbonRiverstone Ribbon draws an eight-EMA ribbon (8, 12, 21, 50, 72, 100, 150, 200) and marks one specific event on it: the cascade cross, where a pullback turns much of the ribbon upside down and the 8 EMA then crosses back above the 12. The goal is to mark the end of a deep pullback inside a longer uptrend, rather than every short-term EMA cross. 200-period SMA and EMA areas, from both the chart's timeframe and the daily chart, show the long-term trend the signal is filtered against.
WHAT'S ORIGIN Wskaźnik
Wskaźnik
Wskaźnik
Wskaźnik