Wskaźnik
Relative Strength Index (RSI)

Hybrid Regression & Dual PVT Flow🇺🇸 ENGLISH DESCRIPTION TEXT
Overview
Hybrid Regression & Dual PVT Flow is an institutional-grade hybrid analysis system designed to uncover the footprints of market whales. It bridges the gap between pure price geometry and volume-weighted momentum, preventing retail traders from falling into "bull/bear traps" by exposing hidden institutional accumulation and distribution phases.
Key Technical Pillars:
Linear Regression Core: Computes a noise-filtered baseline representing the true mathematica
Wskaźnik

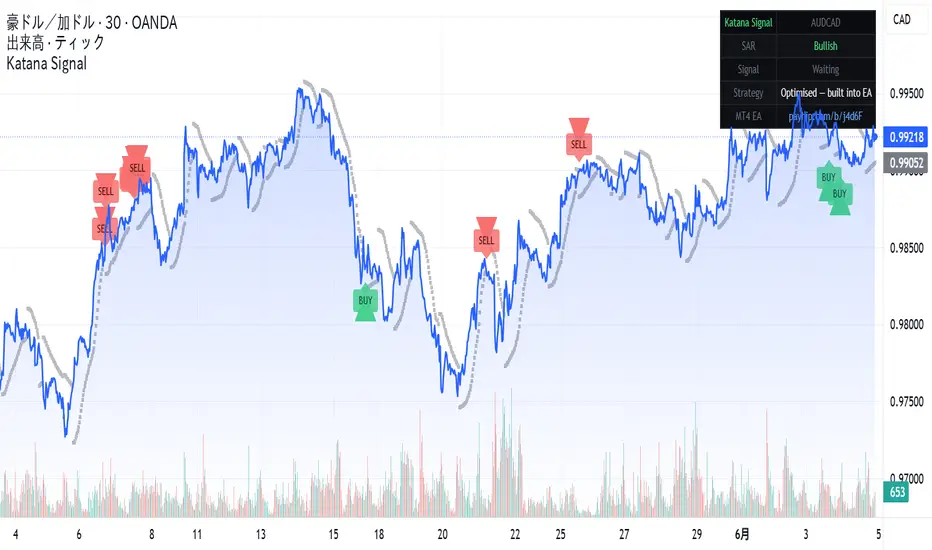
Katana Signal AUDCAD Entry Indicator2AUDCAD Mean-Reversion Signals — Automated with Katana EA (MT4)
This indicator plots entry signals for a mean-reversion
strategy on AUDCAD 30min.
HOW IT WORKS:
- RSI oversold/overbought extreme
- Parabolic SAR confirms on prior closed bar (no repainting)
- Both conditions must align simultaneously
WHY AUDCAD:
AUD and CAD are commodity currencies that move together.
When they temporarily diverge, mean-reversion has structural
reasons to work.
AUTOMATED VERSION (Katana EA v1.4) on MT4:
- Dynam
Wskaźnik

Katana Signal AUDCAD Entry IndicatorThis indicator visualises the entry logic behind Katana EA v1.4
— an MT4 Expert Advisor I developed privately in 2022 and have
been running on a live account ever since.
━━━━━━━━━━━━━━━━━━━━━━━━━━━━━━━━
HOW THE SIGNAL WORKS
━━━━━━━━━━━━━━━━━━━━━━━━━━━━━━━━
Entry is triggered only when TWO conditions align on the prior
closed bar (shift=1, no repainting):
BUY signal:
• RSI reaches oversold extreme
• Parabolic SAR is below the prior bar's low
SELL signal:
• RSI reaches overbought extrem
Wskaźnik

Katana Signal AUDCAD Mean-Reversion Entry IndicatorThis indicator visualises the entry logic behind Katana EA v1.4
— an MT4 Expert Advisor I developed privately in 2022 and have
been running on a live account ever since.
━━━━━━━━━━━━
HOW THE SIGNAL WORKS
━━━━━━━━━━━━
Entry is triggered only when TWO conditions align on the prior
closed bar (shift=1, no repainting):
BUY signal:
• RSI reaches oversold extreme
• Parabolic SAR is below the prior bar's low
SELL signal:
• RSI reaches overbought extreme
• Parabolic SAR is above the prior bar's
Wskaźnik
Z-Score Source MonitorZ-Score Source Monitor
What this script does:
Z-Score Source Monitor calculates a rolling Z-Score on any external indicator line connected via the source input. It answers one question: how statistically extreme is the current reading of any oscillating indicator relative to its recent history?
A Z-Score of 0 means the source is exactly at its rolling mean. A reading of ±1 is within normal range. A reading beyond ±2 occurs roughly 5% of the time statistically, and beyond ±3 less than 1% of t
Wskaźnik

Adaptive Trend Structure Engine v2Adaptive Market Structure Engine (ATSE) is a technical analysis tool designed to help visualize and interpret evolving market structure in real time. It focuses on detecting shifts in price behavior by constructing a synthetic structure model that reacts dynamically to volatility and directional movement.
Unlike traditional indicators that rely solely on fixed moving averages or standard oscillators, this script builds a behavior-based price structure that adapts to changing market conditions.
Wskaźnik

Flow & Value
■Flow & Value
■Description
■NOTICE / DISCLAIMER
This architecture is NOT a conventional technical analysis tool relying on a combination of superficial, lagging indicators. It is a highly advanced algorithmic volume allocation and multi-state logic simulation engine, specifically designed to extract mathematical edges through the aesthetics of subtraction. It functions as a rigorous state machine, evaluating the convergence of momentum, market structure anomalies, and liquidity distribution
Wskaźnik

RSI Candlestick Trend SuiteRSI Candlestick Trend Suite
This indicator presents the Relative Strength Index (RSI) as candlesticks instead of a traditional line, providing a different perspective on momentum behavior and trend development.
The script combines several RSI-based analytical tools into a single oscillator panel:
• RSI Candlestick Visualization
* Displays RSI values as candle structures.
* Highlights momentum expansion and contraction.
* Improves visibility of short-term RSI direction changes.
• Moving Aver
Wskaźnik

[3Commas] BCH Heikin Ashi RSI Fade - Short Indicator BCH Heikin Ashi RSI Fade — Short Indicator
🔷 What it does:
This is the signal-only companion to the BCH Heikin Ashi RSI Fade Short strategy. It tracks a virtual short position and fires webhook-ready alerts on three events — entry, Take Profit, and Stop Loss — without running a backtest engine. A virtual short is opened when the 15-minute Heikin Ashi prints a defined number of consecutive bullish candles AND the long-window RSI is above a soft-bias threshold on the same timeframe. The trade is
Wskaźnik
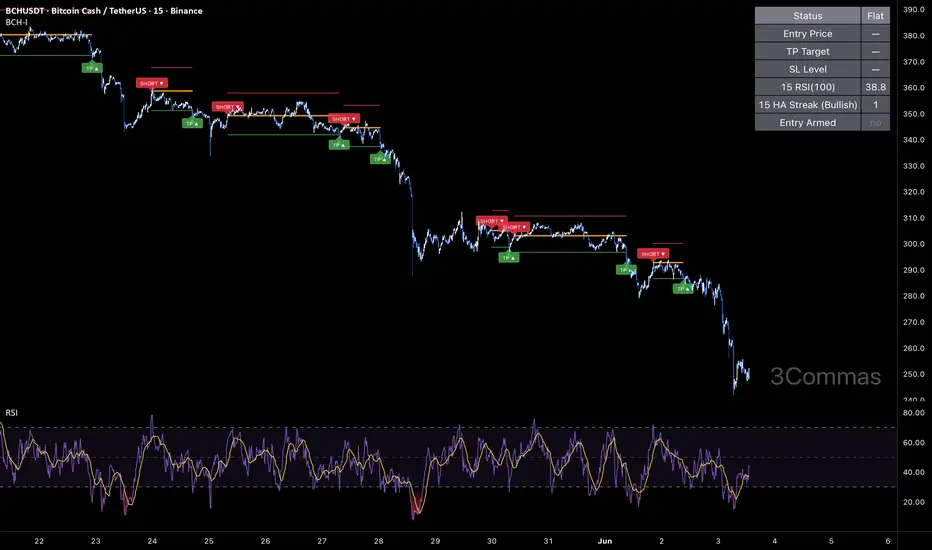
[3Commas] BCH Heikin Ashi RSI Fade - Short StrategyBCH Heikin Ashi RSI Fade — Short Strategy
🔷 What it does:
This is a short-only strategy that fades an extended Heikin Ashi bullish streak, confirmed by a long-window RSI bias filter on the same timeframe. A short entry is opened when the 15-minute Heikin Ashi prints a defined number of consecutive bullish candles AND the smoothed RSI is above a soft-bias threshold — the combination targets exhausted bullish thrusts on BCH that have run far enough to invite a pullback. The exit is a fixed Take P
Strategia

RSI Candle Coloring**RSI Candle Coloring**
Visualize momentum strength instantly — without glancing at a separate RSI panel.
This indicator dynamically recolors each candlestick based on the current RSI value, letting you read overbought and oversold conditions directly from the price chart. Both the RSI period and threshold levels are fully adjustable to fit your trading style.
---
**🎨 Color Zones**
🔴 RSI ≥ 70 — Overbought / Strong Bullish Momentum
🟠 RSI 60–69 — Bullish Bias / Approaching Overbought
⚪ RSI
Wskaźnik

Adaptive Dynamic BB Clouds [PRO] - Auto MA & Double SqueezeWelcome to the Adaptive Dynamic BB Clouds. Traditional Bollinger Bands use a static standard deviation multiplier (usually 2.0) and a fixed moving average (SMA). However, market conditions are constantly shifting between ranging, trending, and highly volatile states.
This indicator introduces an Adaptive Algorithmic Engine that dynamically adjusts both the Basis Line (Moving Average) and the Band Width based on real-time Volume, Trend Strength (ADX), and Momentum (RSI).
🌟 Core Features:
1. Auto-
Wskaźnik

RSI Sequential Exhaustion & Divergence**RSI Sequential Exhaustion & Divergence — Multi-Factor Oscillator**
**What it is**
A single RSI-based reversal oscillator for spotting momentum exhaustion, then filtering and grading those signals so only the better-supported ones stand out. It is one integrated tool, not a pile of separate indicators sharing a pane.
**What it plots**
- The RSI line with a glow/gradient style coloured by momentum side, plus overbought/oversold/midline levels and an optional zone fill.
- Sequential Exhaustio
Wskaźnik

Ellipse Price Action Indicator- BkThe Ellipse Price Action Indicator is a trend and market-structure tool that combines moving-average focus points, volatility envelopes, momentum analysis, and compression detection into a single framework.
Instead of relying on a single trend-following method, the indicator evaluates multiple market conditions simultaneously to identify areas where trend continuation or directional expansion may occur.
Core Concepts
Focus Points
Two moving averages act as dynamic focus points:
Fast Focus Av
Wskaźnik

V-AEMA VMR [LB]Concept
The V-AEMA VMR (Volume-Adaptive Exponential Moving Average with Volatility-Modulated Regime) is a hybrid trend-following indicator that combines an EMA baseline with a volatility-based drift component. It produces a dynamic core line whose colour reflects the trend regime, surrounded by two levels of adaptive bands that expand or contract based on volume intensity. The indicator generates directional entry signals when price breaks the first band in the direction of the trend, and proje
Wskaźnik

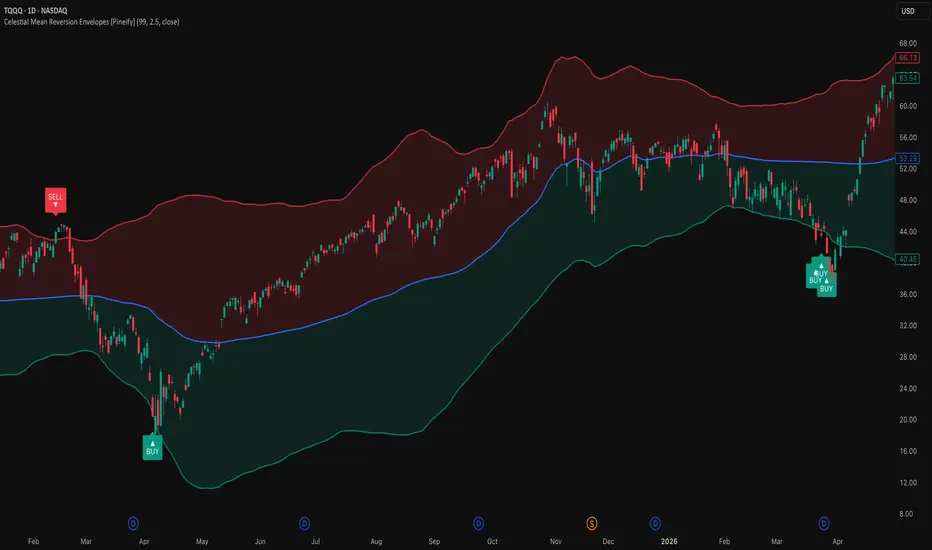
Celestial Mean Reversion Envelopes [Pineify]Celestial Mean Reversion Envelopes
This indicator identifies mean reversion opportunities by wrapping an adaptive moving average in standard deviation envelopes and signaling when price snaps back inside after piercing a band. Rather than using a fixed-period moving average as the baseline, the central line adapts its speed based on how frequently price is setting new highest highs or lowest lows — it tracks price quickly in trending conditions and almost freezes in ranges, so the bands shift
Wskaźnik
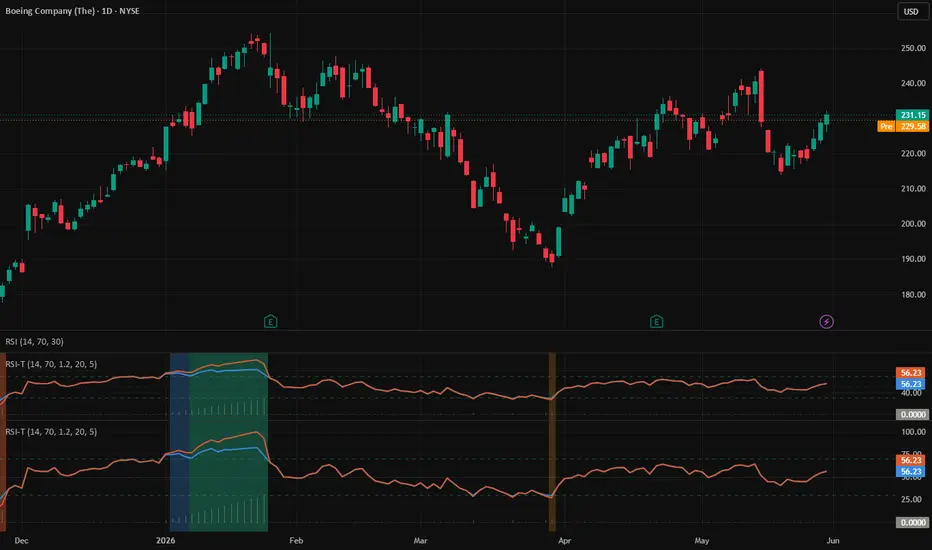
RSI-T (RSI + Time)
RSI-T
RSI with Time Parameter
Technical White Paper & User Guide
Dimitrios Kataliakos
May 2026
Based on the theory: "Market as Expanding Dough"
(Agora os Diogkoumeno Zymari)
Table of Contents
Table of Contents 1
1. Executive Summary 1
2. Theoretical Foundation 1
2.1 The Market as Expanding Dough 1
2.2 Time as a Curvature Factor 1
2.3 Regime Classification 1
3. Mathematical Definition 1
3.1 Core Formula 1
3.2 Parameters 1
3.3 Derived Metrics 1
4. Timeframe Analysis 1
4.1 Timeframe Weight 1
Wskaźnik
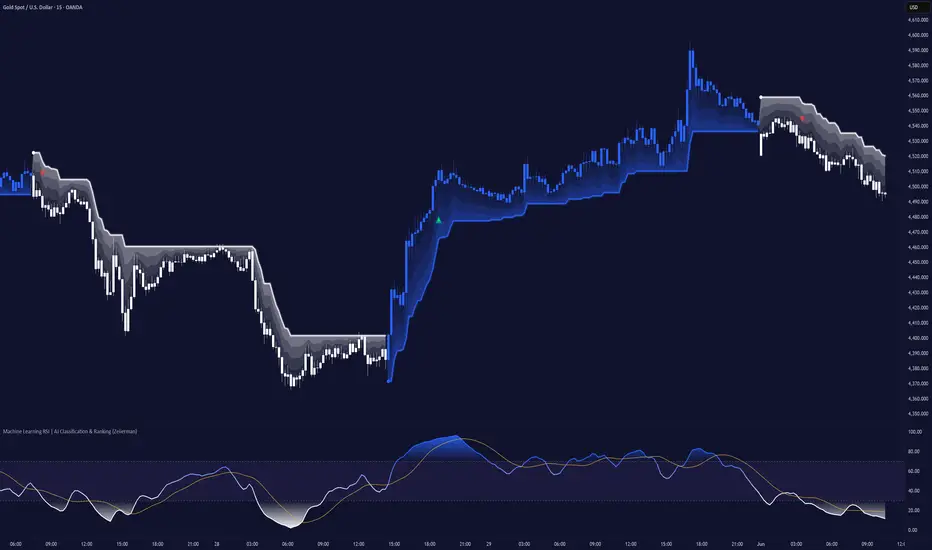
Machine Learning RSI | AI Classification & Ranking (Zeiierman)█ Overview
The Machine Learning RSI | AI Classification & Ranking (Zeiierman) is an adaptive RSI intelligence system that combines momentum analysis, historical analog recognition, machine learning classification, confidence scoring, and dynamic trend management into a single framework.
Rather than interpreting RSI solely through traditional overbought and oversold thresholds, the indicator examines how similar RSI environments have behaved historically and uses those observations to classi

Wskaźnik
SOL RSI DCA - Long StrategySOL RSI DCA - Long Strategy
🔷 What it does:
This is a long-only DCA strategy that opens a base long while SOL's higher-timeframe momentum is depressed, then averages down on a geometric price-deviation ladder if the dip extends. A long entry arms whenever the 1-hour RSI(14) sits below a configurable level (default 44). Up to three averaging orders ladder the position deeper on widening deviation steps and growing order sizes. Exit is a fixed Take Profit from the running average entry. No traili
Strategia

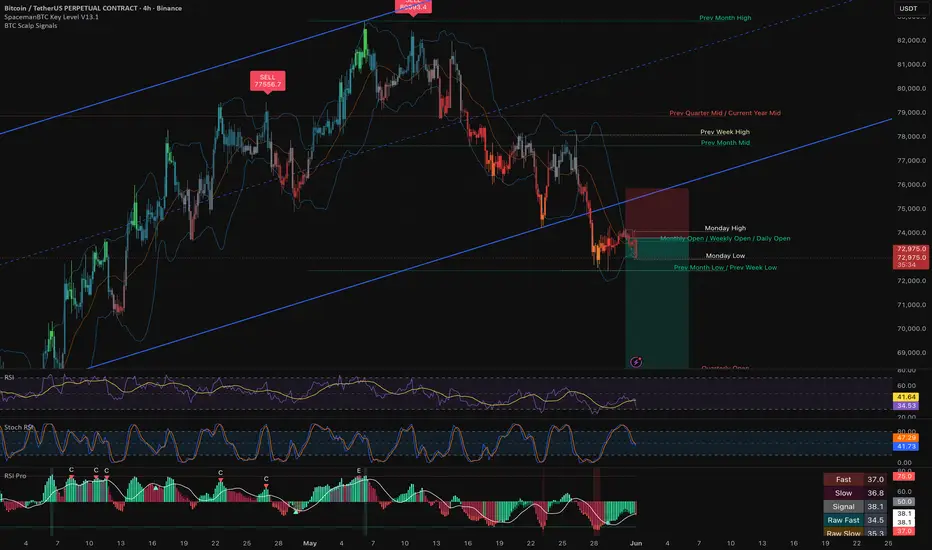
RSI Pro - KiyotakaThe RSI Pro is a D/7R-inspired advanced momentum oscillator that upgrades the standard Relative Strength Index (RSI). Instead of a single, jagged line that often gives false signals, this indicator smooths the data and uses multiple moving averages to create a visual
"Ribbon." It is designed to help traders identify trend strength and reversals without the noise associated with a standard RSI.
How It Works:
Dual RSIs: It calculates two RSIs:
Fast RSI (14): Reacts quickly to price changes.
S
Wskaźnik
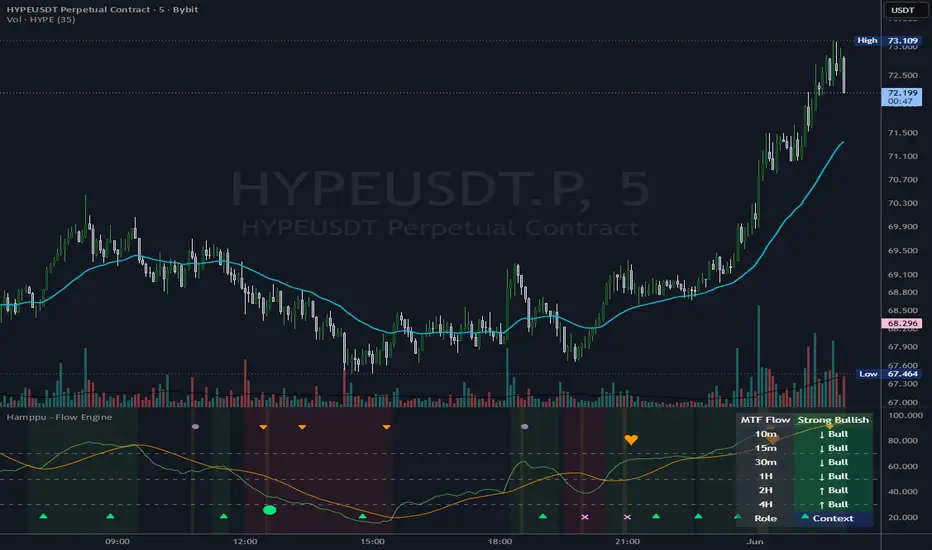
Hamppu - Flow EngineHamppu - Flow Engine is an open-source crypto intraday context engine built in Pine Script v6.
It is designed to help read market context, not to provide standalone buy/sell signals.
The script combines multi-layer RSI regime logic, RSI compression/release, WaveTrend-style stretch reclaim/reject context, liquidity sweep quality scoring, displacement after sweep, HTF with-flow / counter-flow classification and a dynamic MTF Flow Stack.
The goal is transparency. Markers are not magic signals. T
Wskaźnik
ATR EMA MultipleA TradingView (Pine Script v6) oscillator that measures how far price has stretched from its moving average, expressed in units of ATR (Average True Range).
Instead of asking "how many dollars/points is price away from its average?", this indicator asks "how many typical bars of volatility is price away from its average?" That makes the reading comparable across different symbols, timeframes, and volatility regimes.
WHAT IT PLOTS
The main line (white) is the oscillator:
oscillator = (c
Wskaźnik

Price historyПростой индикатор для сезонных инструментов (природный газ, например). Накладывает историю цены прошлых лет на текущий год. Применять на старших таймфремах.
A simple indicator for seasonal instruments, such as natural gas. It overlays historical price data from previous years onto the current year. Use it on higher timeframes.
Wskaźnik
