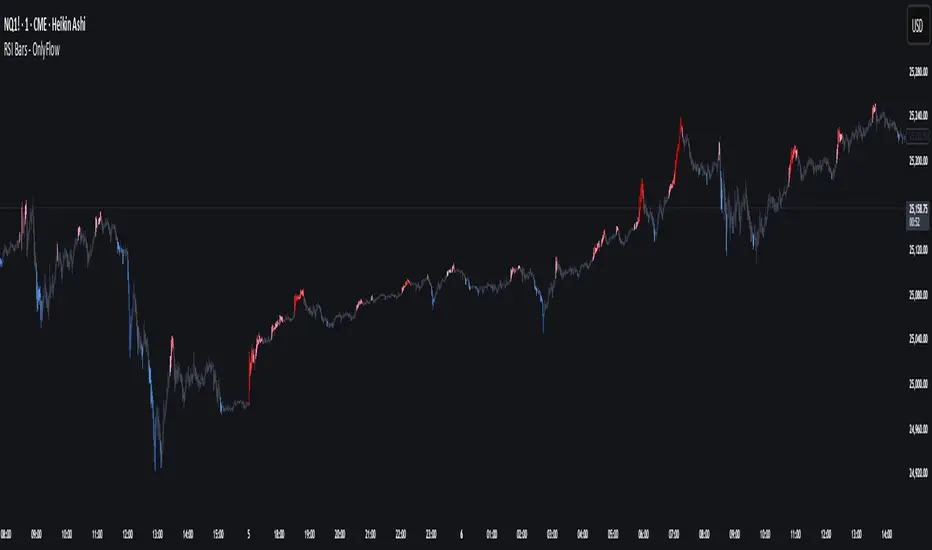
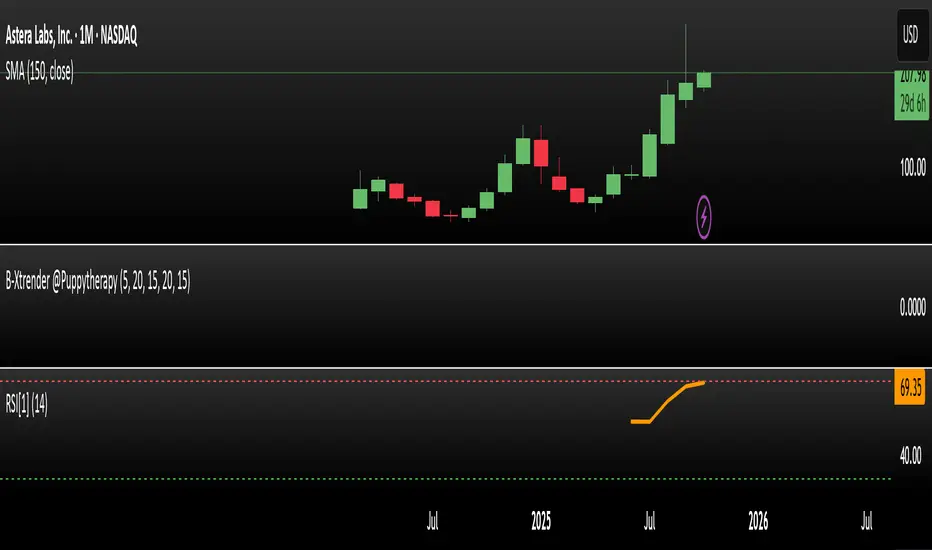
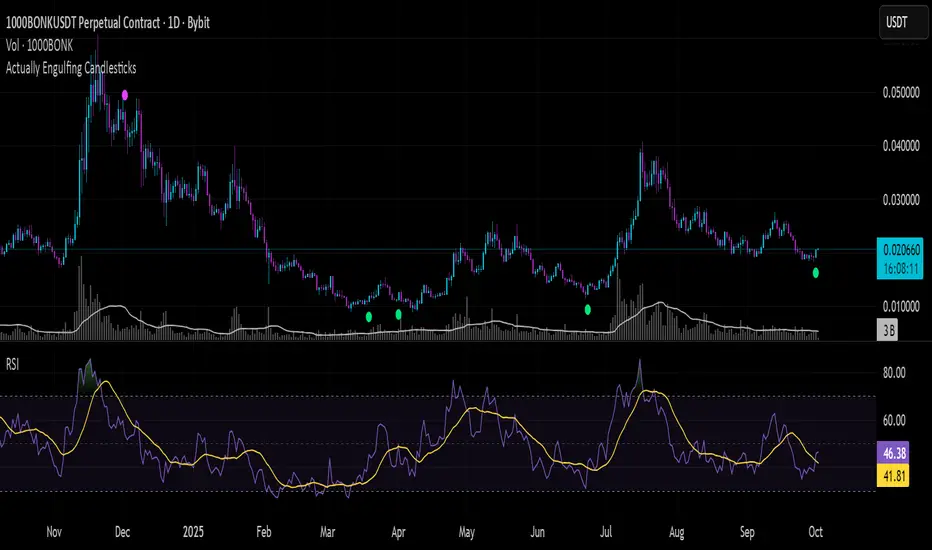
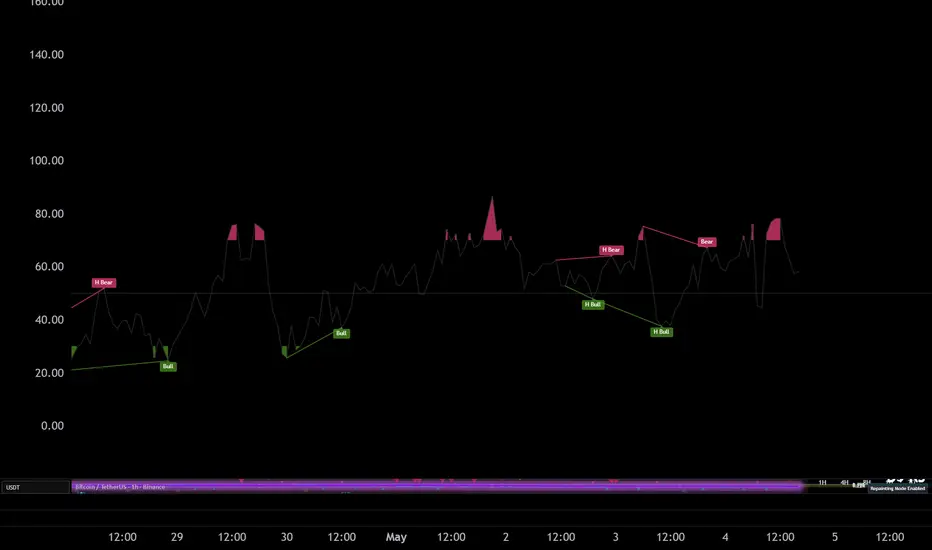
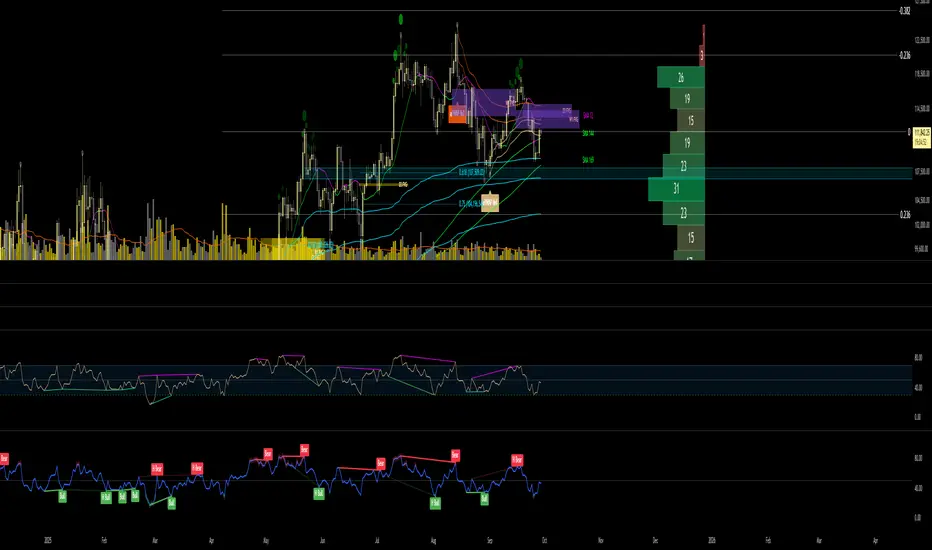
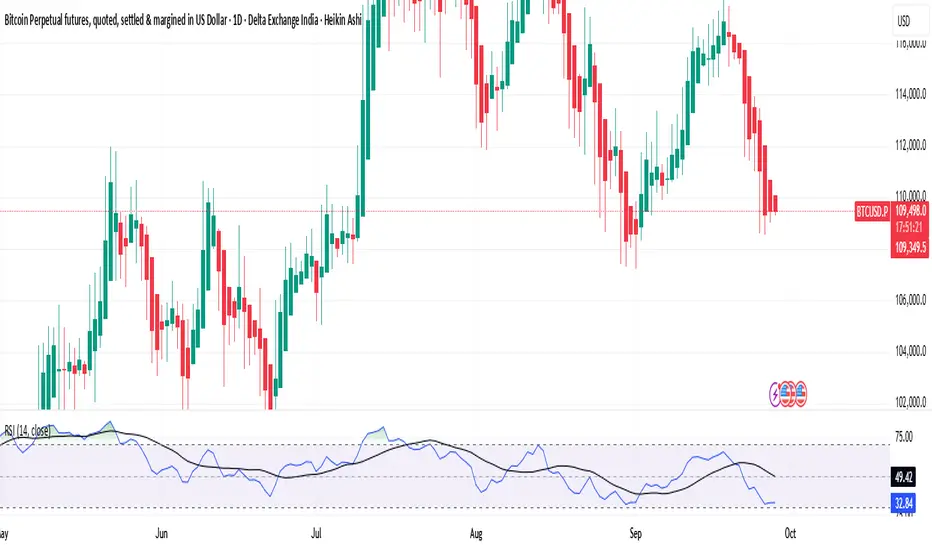
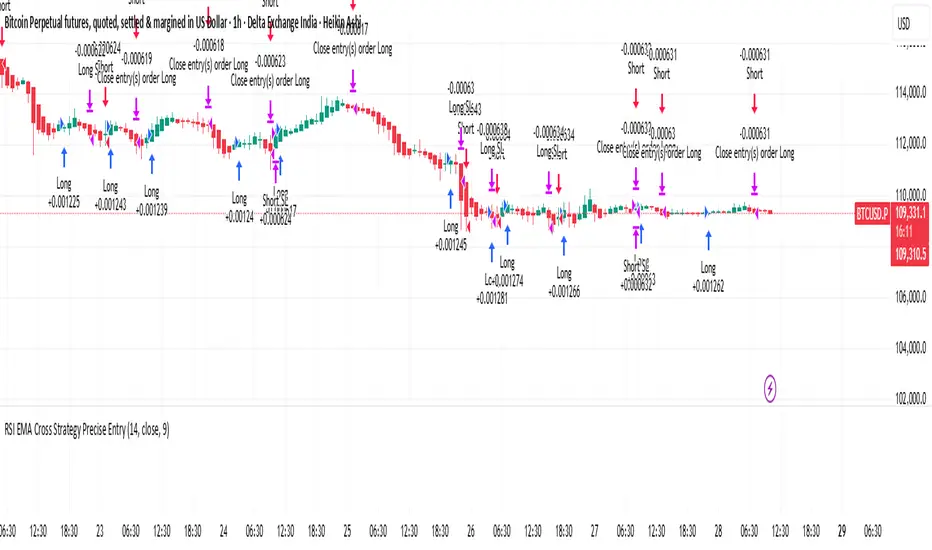
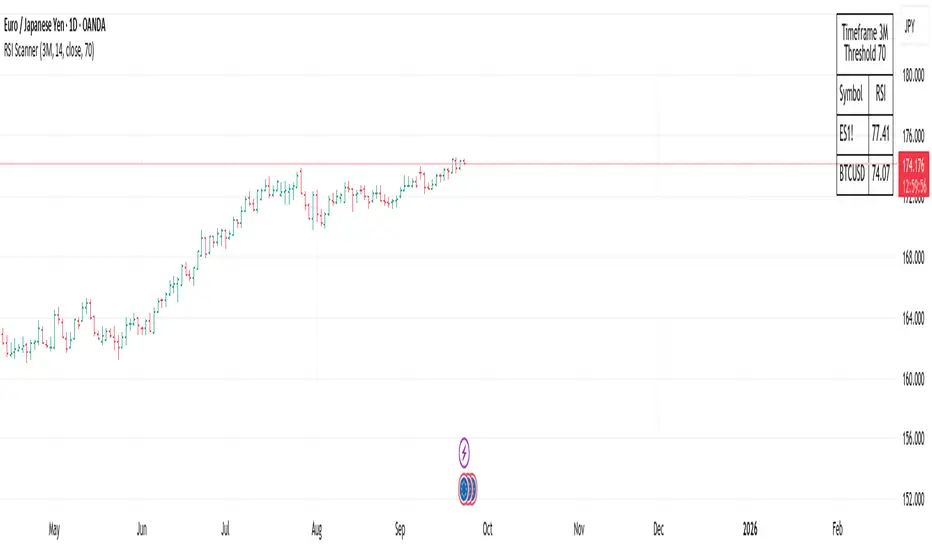
RSI Bars - OnlyFlowThis indicator applies the RSI (Relative Strength Index) to candle coloring so that bar colors reflect momentum conditions instead of a fixed scheme.
RSI Logic: Bars shift color when RSI values move into overbought or oversold regions, with intensity scaled by how far RSI extends beyond the thresholds.
Gradient / Step Mode: Choose between a smooth gradient or a 3-step palette to visualize strength.
Directional Neutral Colors: Neutral zones can follow candle direction for clearer trend context
Wskaźnik