3 EMA Trend by TradeZeneThree EMAs in 1 Indicator
Overview
The 3 EMAs in 1 Indicator is a clean, lightweight trend-following tool that plots three customizable Exponential Moving Averages (EMAs) on a single chart, making it easy to identify the short-, medium-, and long-term market trend at a glance.
Designed for traders who prefer simplicity over clutter, this indicator provides visual trend confirmation through subtle background coloring while keeping the chart clean and easy to read.
Features
✅ Three fully customizable EMAs
EMA 1 (Default: 9)
EMA 2 (Default: 27)
EMA 3 (Default: 108)
✅ Individual show/hide options for each EMA
✅ Automatic trend background
Light Blue: Price is above EMA 2 (Bullish Bias)
Light Orange: Price is below EMA 2 (Bearish Bias)
✅ Lightweight and fast
Works smoothly on all timeframes and market instruments.
Suggested Usage
Many traders use the three EMA combination to:
Identify the overall market trend
Stay on the right side of momentum
Filter counter-trend trades
Improve trade selection alongside price action
Combine with support/resistance, VWAP, market structure, or volume analysis
This indicator is intentionally simple so it can fit into almost any trading strategy.
Default Settings
EMA 1: 9
EMA 2: 27
EMA 3: 108
These values can be customized to suit your trading style.
Disclaimer
This indicator is provided for educational and informational purposes only. It should not be considered financial or investment advice. Trading involves risk, and past performance does not guarantee future results. Always perform your own analysis and manage risk appropriately.
If you find this indicator useful, please consider giving it a 👍, adding it to your favorites, and share with your trader friends.
Happy Trading! Wskaźnik

TRADLEWARE-Gaussian Channel + StochRSI ETH
Gaussian Channel + Stochastic RSI ETH
This strategy combines a fast Gaussian Channel with a Stochastic RSI filter and a 200-day SMA bull-market gate, aimed at catching trend continuation while sitting out confirmed downtrends.
How it works
The Gaussian Channel is a smoothed price envelope built with an IIR (infinite impulse response) filter — a mathematically elegant alternative to a simple moving average. It applies a bell-curve weighting across recent bars, producing smooth, low-lag output. The channel is formed by adding and subtracting a filtered measure of true range (volatility) around the central filter line.
The channel turns green when the filter is rising (uptrend) and red when it is falling (downtrend). A separate 200-day simple moving average acts as a bull/bear regime switch: the strategy only trades when price is above it.
Entry
A long position is opened when all five conditions are true simultaneously:
The channel is green (filter rising — uptrend confirmed)
Price closes above the upper band (breakout above the channel; an optional buffer above the band can require more room, but testing found this counterproductive — see Parameters)
Stochastic RSI %K is either above 80 (strong momentum confirming the breakout) or below 25 (oversold dip within the uptrend)
Price is above the 200-day SMA (bull regime — can be disabled)
The signal bar itself closes above its own open — a bullish candle (can be disabled)
The bullish-candle check filters out breakout bars that clear the upper band intrabar but still close weak — a common precursor to an immediate whipsaw exit on the next bar.
The 200-day SMA gate exists specifically to block breakout entries that fire during bear-market bounces — dead-cat rallies that look like trend resumption on the channel and oscillator alone but occur underneath a still-falling long-term average.
Exit
The position is closed when either:
Price closes back below the upper band (breakout has failed or the trend is cooling), or
The channel reverses from green to red (trend direction has flipped)
An optional stop-loss (on by default) is placed at the lower band and trails as the channel moves, providing a floor on losses if price drops sharply through both the upper and lower bands in the same move. The regime gate only blocks new entries — it does not force an exit on its own if price falls back below the 200-SMA mid-trade.
Parameters
Poles: 4 (filter smoothness — higher = smoother but more lag)
Sampling Period: 89 (faster channel than the baseline version, reacts sooner to trend changes)
True Range Multiplier: 1.5 (controls channel width)
Stochastic RSI overbought threshold: 80
Stochastic RSI oversold threshold: 25 (a parameter sweep found a stable plateau from 22-28; 25 sits at its center rather than its single best value)
200-SMA regime gate: on by default, can be disabled; length is adjustable
Bullish entry candle requirement: on by default, can be disabled
Entry breakout buffer: 0% (off) by default; tested at multiple levels above 0% and found to reduce returns at every level, so left disabled
Stop-loss at lower band: on by default, can be disabled
Start/End date range inputs let you restrict the backtest window without editing code
Costs modelled
0.1% commission per side, 3 ticks slippage, fills at next bar's open.
Intended assets and timeframe
Daily bars. Designed and validated on ETH/USDT. Likely applicable to other trending crypto assets; not validated on equities .
Known limitations
Underperforms in choppy or ranging markets — the upper band breakout condition generates whipsaws when price oscillates without directional conviction. The regime gate is a trade-off: it blocks bear-bounce false starts, but it also means the strategy can miss the first leg of a genuine new uptrend until price reclaims the 200-day SMA. The filter requires several hundred bars of history to fully converge; results on very short histories may differ from the validated backtest. The strategy trades infrequently (around 28 trades on the validated window), so treat any single backtest run as a small sample rather than a statistically strong result.
Credit
The Gaussian Channel filter is from the open-source "Gaussian Channel (DW)" indicator by DonovanWall. This script reuses that filter and adds the Stochastic RSI entry filter, the 200-day SMA regime gate, exit rules, stop-loss, and full strategy order management on top of it.
Strategia

Bollinger-Fibonacci Trend Extension [MarkitTick]💡 This tool automates the identification of three-point corrective price structures (A-B-C swings) and projects a suite of Fibonacci-based extension targets from them, filtered through a Bollinger Band mean-reversion confirmation layer and an optional trend-strength gate. Rather than requiring a trader to manually draw retracement/extension tools every time price forms a pullback, the script continuously scans pivot structure in real time, validates the geometry of each swing against strict corrective-wave rules, and projects a set of forward-looking price zones — including a shaded "Golden Zone" between the 1.5 and 1.618 extensions — the moment a qualifying structure is confirmed.
✨ Originality and Utility
Fibonacci extension tools are common on TradingView, but most require manual anchor placement on every swing and provide no objective criteria for which swings are valid setups. This script closes that gap by fully automating structure detection: it runs a custom zigzag engine with a significance threshold (ATR-based or percentage-based) to filter noise, then validates any three consecutive pivots against explicit corrective-structure rules (alternating high/low sequence, with the C-point required to retrace between the A and B extremes) before it will draw anything.
Two independent confirmation layers are stacked on top of raw structure detection: a Bollinger Band basis-cross filter that requires price to be trading on the correct side of its short-term mean before a new structure is accepted, and an optional ADX/DMI filter that suppresses structures formed during low directional-strength conditions. A configurable "adaptive filter" further lets traders pre-smooth the high/low series feeding the pivot engine using one of eight smoothing methods — including a Kalman filter and an LLAMA (linear-regression-slope-adjusted moving average) implementation — before pivots are ever detected, changing the sensitivity and lag characteristics of what counts as a swing point. The combination of automated, rule-based structure validation, dual confirmation filters, and selectable pre-smoothing is what differentiates this from a static or manually-drawn extension tool.
🔬 Methodology and Concepts
• Adaptive Pivot Detection
The script identifies swing highs and lows using a symmetric lookback/lookforward window (the "Pivot Lookback Depth" input): a bar qualifies as a pivot high only if no other bar within that window on either side has a higher value, and analogously for pivot lows. Traders can choose to feed this detection engine either raw high/low price or a smoothed version of it via the Adaptive Filter setting. Available smoothing methods include standard SMA, EMA, and RMA; a Double WMA (a WMA applied twice in succession, sharpening lag reduction); a Triple VWMA (volume-weighted MA applied three times); HMA (Hull Moving Average); LLAMA, a custom method that adds a linear slope projection (calculated from the change in price over the lookback window) on top of a simple average; and a lightweight Kalman filter that recursively updates a state estimate based on a fixed process/measurement noise ratio. Smoothing the pivot source changes which swings register as significant, effectively tuning the sensitivity of the whole structure-detection pipeline.
• Significance Threshold
Not every alternating high/low pair is kept — a new pivot only replaces the prior point of the same type, or is added as a new leg, if it clears a minimum distance threshold from the last opposite-type point. This threshold can be set as a multiple of ATR (Average True Range, over a configurable period) or as a fixed percentage of the current close, letting the sensitivity of the zigzag scale with volatility or stay fixed in percentage terms.
• A-B-C Structure Validation
Once at least three qualifying zigzag points exist, the script inspects the most recent three (A, B, C) to determine whether they form a valid corrective structure. A bullish setup requires the sequence low → high → low (A is a low, B a high, C a low), with the additional geometric constraint that point C must close above point A but below point B — meaning the pullback from B did not fully retrace into new lows and did not exceed the origin of the move. The bearish case is the mirror image (high → low → high, with C bounded between A and B). Structures that don't satisfy these geometric constraints are rejected outright; the script will not draw a structure from just any three consecutive swings.
• Bollinger Band Confirmation Filter
When enabled, a newly detected A-B-C structure is only accepted if the prior confirmed close is positioned correctly relative to the Bollinger Band basis (an SMA of price, with upper/lower bands built from standard deviation multiples): bullish structures require the close to be above the basis, bearish structures require it to be below. This filters out structures forming against the prevailing short-term mean, reducing the incidence of countertrend triggers.
• ADX/DMI Trend-Strength Filter (optional)
When the ADX filter is enabled, new structures are only confirmed if the ADX value (calculated from the Directional Movement Index over a configurable length) meets or exceeds a user-defined threshold. This is intended to suppress structure formation during ranging, low-momentum conditions where corrective patterns are statistically less reliable.
• Fibonacci Extension Projection
Once a structure is confirmed, the script projects forward price targets from the A-B-C swing using the standard extension formula: target = C + ((B − A) × ratio). An optional logarithmic-scale calculation is available, which performs the equivalent projection in log-price space before converting back — useful on instruments or timeframes where percentage moves are more meaningful than absolute point moves. Selectable extension ratios include 0.618, 1.000, 1.272, and 1.618, each independently toggleable, plus a fixed internal 1.5 ratio used only to bound the shaded "Golden Zone." Each level is optionally annotated with a loose Elliott Wave association label (e.g., the 1.618 level is labeled "Wave 3") purely as a descriptive reference point for traders familiar with that framework — the script does not perform full Elliott Wave counting or degree analysis.
• Structure Invalidation
Active structures are continuously monitored: a bullish structure is invalidated if the close trades back below point A, and a bearish structure is invalidated if the close trades back above point A. This uses the point-A extreme as a structural stop level, consistent with the idea that a valid corrective pattern should not be revisited past its origin. On invalidation, the trader can choose to have the structure's drawings grayed out in place (to preserve chart history) or fully deleted.
🎨 Visual Guide
Gold and blue lines plotted directly on price represent the Bollinger Bands: the basis (gold, an SMA of price) and the upper/lower bands (blue, basis ± a standard-deviation multiple). These can be hidden independently of the confirmation filter itself.
Solid colored lines connect point A to point B, and dashed colored lines connect point B to point C, forming the visual "A-B-C" skeleton of each detected structure. Color reflects direction: the Bullish Structure Color for up-setups and the Bearish Structure Color for down-setups (both user-configurable, default green/red).
Small labeled tags marked "A," "B," and "C" are placed at each swing point, color-matched to the structure's direction, with their vertical orientation (label above or below price) automatically flipped depending on whether the point is a high or a low.
Dotted horizontal lines extending from point C represent each active Fibonacci extension level (0.618, 1.000, 1.272, 1.618, as enabled). The 1.618 level is rendered as a solid line rather than dotted, distinguishing it as the primary extension target. Each line carries a right-aligned label showing the ratio, its optional Elliott Wave tag, and the exact price level.
A shaded rectangular zone between the 1.5 and 1.618 extension levels — tinted in the structure's directional color — marks the "Golden Zone," a commonly-referenced confluence area for potential reversals or profit-taking, with a "Golden Zone" text label at its midpoint.
When a structure is invalidated and the "Gray Out" invalidation action is selected, all of the above elements (lines, labels, the zone fill) desaturate to the Invalidated Structure Color, visually distinguishing historical, no-longer-valid structures from the currently active one without removing them from the chart.
An on-chart dashboard (top-right by default, repositionable) displays: the current symbol and timeframe, an overall directional Bias read from the most recent structure, the current ATR value, the active significance threshold in price terms, a visual bar-gauge showing how many structures are currently tracked relative to the configured maximum, the pass/block state of the Bollinger Band filter, the live ADX reading and pass/fail state, the selected Adaptive Filter method, and a log of the last structural event (new bullish/bearish structure, or bullish/bearish invalidation).
📖 How to Use
Wait for a complete A-B-C structure to be drawn and confirmed — the script only finalizes structures on confirmed bar closes, so no signal will repaint intrabar.
A newly confirmed bullish structure (green by default) suggests the recent pullback (B to C) may extend toward the plotted Fibonacci levels; the 1.618 extension and the shaded Golden Zone are commonly treated as primary target/reaction areas.
A newly confirmed bearish structure works symmetrically to the downside.
Point A acts as the structural invalidation level: if price closes back through point A against the direction of the setup, treat the structure as void — the script will automatically flag this via graying-out or deletion, along with a dashboard "Last Event" update and an optional alert.
Use the Bollinger Band filter to avoid structures forming against the short-term mean, and the ADX filter to avoid trading corrective setups during flat, low-momentum conditions.
The dashboard's Bias, Threshold, and filter-status rows are designed to be checked at a glance before acting on any newly drawn structure.
Built-in alerts are available for new bullish/bearish structures and for bullish/bearish invalidations, each firing a JSON-formatted payload (ticker, timeframe, direction, entry, TP, SL) suitable for direct use with webhook-based automation, with the action keywords for each alert type fully customizable in the Alerts group.
⚙️ Inputs and Settings
Pivot Lookback Depth — the number of bars checked on each side of a candidate bar when detecting swing highs/lows. Larger values produce fewer, more significant pivots and slower reaction time; smaller values increase sensitivity and structure frequency.
Use ATR-Based Threshold / ATR Period / ATR Multiplier — when enabled, the minimum move required to register a new zigzag leg scales with recent volatility (ATR × multiplier) rather than a fixed percentage.
Fixed Deviation % — used instead of the ATR threshold when ATR-based thresholding is disabled; sets the minimum percentage move required between opposite-type pivots.
Enable Structure Invalidation — toggles whether structures are automatically invalidated when price closes back through point A.
Keep Last N Structures — caps how many structures remain tracked/drawn simultaneously; older structures are cleaned up once the cap is exceeded.
Enable BB Confirmation Filter / BB Length / BB StdDev Mult — controls the Bollinger Band basis-cross requirement for new structures, and the parameters of the underlying Bollinger Band calculation.
Use ADX Filter / ADX Threshold / ADX Length — controls the optional trend-strength gate and its calculation parameters.
Adaptive Filter / Adaptive Filter Length — selects the smoothing method (if any) applied to the high/low series before pivot detection, and its lookback length.
Invalidation Action — choose whether invalidated structures are grayed out in place or deleted from the chart.
Show Bollinger Bands / Use Logarithmic Scale — visual toggle for the BB plots, and whether extension targets are computed in log-price space.
Show 0.618 / 1.000 / 1.272 / 1.618 Level — independently toggle each Fibonacci extension line.
Extend Lines Right — extends extension lines indefinitely to the right instead of stopping at the current bar.
Show A-B-C Labels / Show Structure Lines / Show Elliott Wave Labels — independent visibility toggles for each drawing category.
Show Dashboard / Position — toggles the on-chart dashboard table and sets its screen corner.
Alert action fields (Open Long/Short, Close Long/Short) — customizable text keywords embedded in the JSON alert payloads, matching the syntax expected by the trader's automation/webhook setup.
Enable Test Alert — fires a payload on every confirmed bar close, intended only for verifying webhook routing before disabling it.
Color inputs — full control over structure colors, label backgrounds, invalidated-structure color, Bollinger Band plot colors, and dashboard styling.
🔍 Deconstruction of the Underlying Scientific and Academic Framework
The script's structural core rests on the concept of a zigzag transformation, a standard technique in technical analysis for reducing noisy price series into a simplified sequence of significant turning points, filtered here by a volatility-normalized (ATR-scaled) or percentage-based significance threshold rather than a fixed tick count — a design choice that keeps the sensitivity of the transformation consistent across instruments and volatility regimes.
The A-B-C labeling convention and the specific extension ratios offered (0.618, 1.000, 1.272, 1.618) draw on the Fibonacci sequence and its derived ratios, which have a long history of application in corrective-wave analysis, most notably within Elliott Wave Theory and W.D. Gann's work on proportional price projections. The mathematical basis is the golden ratio (φ ≈ 1.618) and its reciprocal/power relationships, which recur in the ratios above; their use in this script is descriptive and pattern-based rather than derived from any claim of causal market structure — the script projects targets from these ratios but does not assert that price is mechanically obligated to reach them.
The optional Bollinger Band filter is grounded in the standard statistical definition of a Bollinger Band: a moving-average basis with bands set at a multiple of the rolling standard deviation, functioning here as a simple mean-reversion/trend-context gate rather than a full volatility-breakout system.
The ADX/DMI filter derives from Welles Wilder's Directional Movement System, which measures trend strength independently of trend direction by comparing the magnitude of directional price movement to overall volatility (true range) over a smoothing period; using it as a pre-condition for structure confirmation is consistent with its original design purpose of distinguishing trending from non-trending regimes.
The adaptive smoothing options span several distinct estimation philosophies: SMA/EMA/RMA represent classical fixed- and exponentially-weighted moving averages; the Double WMA and Triple VWMA apply cascaded weighted/volume-weighted averaging to reduce lag at the cost of some smoothness; HMA (Hull Moving Average) is a weighted-average construction specifically designed to reduce lag while preserving smoothness; the Kalman filter implementation applies a simplified recursive Bayesian estimation approach (balancing a process-noise and measurement-noise ratio to continuously re-weight new observations against the prior estimate), a technique originally developed for state estimation in control systems and adapted here for price smoothing; and the LLAMA method combines a simple average with a linear slope term derived from the net change in price over the lookback window, a basic linear-regression-style adjustment for trend drift.
⚠️ Disclaimer
All provided scripts and indicators are strictly for educational exploration and must not be interpreted as financial advice or a recommendation to execute trades. We expressly disclaim all liability for any financial losses or damages that may result, directly or indirectly, from the reliance on or application of these tools. Market participation carries inherent risk where past performance never guarantees future returns, leaving all investment decisions and due diligence solely at your own discretion. Wskaźnik

TRADLEWARE-Gaussian Channel + StochRSI BTC
TRADLEWARE - Gaussian Channel + Stochastic RSI
This strategy combines a Gaussian Channel with a Stochastic RSI filter to capture momentum continuation in trending markets on the daily timeframe.
How it works
The Gaussian Channel is a smoothed price envelope built with an IIR (infinite impulse response) filter — a mathematically elegant alternative to a simple moving average. Instead of weighting recent bars linearly, the Gaussian filter applies a bell-curve weighting that produces very smooth, low-lag output. The channel is formed by adding and subtracting a filtered measure of true range (volatility) around the central filter line.
The channel turns green when the filter is rising (uptrend) and red when it is falling (downtrend).
Entry
A long position is opened when all three conditions are true simultaneously:
The channel is green (filter rising — uptrend confirmed)
Price closes above the upper band (breakout above the channel)
Stochastic RSI %K is either above 80 (strong momentum confirming the breakout) or below 15 (oversold dip within the uptrend)
The dual Stochastic RSI threshold captures two different entry scenarios: a momentum breakout and a pullback-and-recover within an ongoing trend.
Exit
The position is closed when either:
Price closes back below the upper band (breakout has failed or the trend is cooling), or
The channel reverses from green to red (trend direction has flipped)
An optional stop-loss (on by default) is placed at the lower band and trails as the channel moves, providing a floor on losses if price drops sharply through both the upper and lower bands in the same move.
Parameters
Poles: 4 (filter smoothness — higher = smoother but more lag)
Sampling Period: 144 (slow channel, suited to daily trends)
True Range Multiplier: 1.414 (controls channel width)
Stochastic RSI overbought threshold: 80
Stochastic RSI oversold threshold: 15
Stop-loss at lower band: on by default, can be disabled
Start/End date range inputs let you restrict the backtest window without editing code
Costs modelled
0.1% commission per side, 3 ticks slippage, fills at next bar's open.
Intended assets and timeframe
Daily bars. Designed and validated on BTC/USDT. Likely applicable to other trending crypto assets; not validated on equities .
Known limitations
Underperforms in choppy or ranging markets — the upper band breakout condition generates whipsaws when price oscillates without directional conviction. The filter requires several hundred bars of history to fully converge; results on very short histories may differ from the validated backtest. The strategy trades infrequently (around 30 trades from 2018 to present on BTC/USDT), so treat any single backtest run as a small sample rather than a statistically strong result.
Credit
The Gaussian Channel filter is from the open-source "Gaussian Channel (DW)" indicator by DonovanWall. This script reuses that filter and adds the Stochastic RSI entry filter, exit rules, stop-loss, and full strategy order management on top of it.
Strategia

Global Sessions IST - High/Low & Range DashboardOverview
Global Sessions IST is a lightweight, clean, and highly customizable session tracking tool designed specifically for traders operating in Indian Standard Time (IST). It dynamically highlights the active market hours for Asia (Tokyo/Hong Kong), London, and New York, helping you identify liquidity sweeps, session ranges, and key intraday turning points without cluttering your price action.
Key Features
IST Native Alignment: Built from the ground up for Indian Standard Time (UTC+5:30), mapping out global session open and close times accurately.
Minimalist Session Boxes: Visualizes session High, Low, and price movement using soft, customizable box fills and subtle border styles.
On-Chart Mini Dashboard: A real-time summary table positioned in the top-right corner that updates each session's:
Session High
Session Low
Total Point Range
DST (Daylight Saving Time) Toggle: Easily adjust London and New York session times by +1 hour with a single setting toggle during summer/winter shifts.
Fully Customizable Visuals: Toggle session boxes, adjust fill opacity, change session colors, or hide the dashboard entirely for a pure price-action view.
How to Use
Identify Session Ranges: Observe how price builds high and low points during the Asian consolidation phase.
Monitor Session Overlaps: Keep an eye on the high-liquidity London–New York overlap (6:30 PM – 9:00 PM IST) for major breakout or reversal trades.
Analyze Range Expansion: Use the mini dashboard to gauge session volatility in points/pip range before entering trades.
Reflective Thought
"What is night for all beings is the time of awakening for the self-controlled."
True market discipline requires awareness when others are asleep. Keep your charts clean, execution sharp, and risk management paramount. Wskaźnik

EZ$ PB Blake v1.0EZ$ PB Blake is a standalone indicator built around PB Blake’s four-step trading model:
HTF Bias + Draw on Liquidity → Valid Key Level → Highest-TF IFVG Confirmation → Entry
It is designed to keep the model clean and structured rather than filling the chart with every possible FVG or ICT concept.
The indicator first determines whether the market is bullish or bearish by looking at how Daily, 4H, 1H and optional 15M FVGs are being respected or disrespected. It then identifies the likely BSL or SSL draw on liquidity.
Next, it looks for valid PB-style key levels from the 3M, 5M, 15M, 30M, 1H and 4H, including FVGs, ITL/ITH levels, CISDs and rejection blocks.
Once price reaches a valid key level, the indicator identifies the manipulation leg and searches the 1M through 5M for the highest-timeframe IFVG inside that leg.
The actual signal only appears after the proper IFVG timeframe gets a confirmed body close through the gap:
PB LONG
or
PB SHORT
Settings Guide
1. HTF Bias + Draw on Liquidity
Bias Mode
Auto FVG Respect — recommended
Manual Bullish
Manual Bearish
Auto mode scores the 1D / 4H / 1H / 15M based on FVG respect/disrespect.
Minimum Absolute Bias Score
Default: 2
Higher number = stricter bias
I would leave this at 2 initially
DOL Swing TF
Default: 1H
Used to locate the swing high/low serving as the likely draw.
You'll see:
BSL • DOL for bullish
SSL • DOL for bearish
2. Valid Key Levels
Default timeframes are all enabled:
3M / 5M / 15M / 30M / 1H / 4H
The script can select:
FVG
ITL / ITH
CISD
RB = Rejection Block
I recommend leaving all of these timeframe toggles ON initially because PB uses different key-level timeframes depending on the setup.
The dashboard might say something like:
KEY: 15M FVG
or
KEY: 1H RB
3. IFVG Confirmation
This is the most important section for the actual entry.
Default:
1M / 2M / 3M / 4M / 5M = ON
The indicator searches those timeframes and selects the highest-timeframe IFVG inside the manipulation leg.
Example:
If the leg contains:
1M IFVG ✅
2M IFVG ✅
3M IFVG ✅
4M IFVG ❌
5M IFVG ❌
then the script waits for the:
3M IFVG
—not the 1M.
The dashboard will show:
WAIT 3M CLOSE
Then a confirmed body close through that IFVG can generate the signal.
I intentionally left the 30-second IFVG out of the default model.
4. Execution / Risk
Golden Hour
Default: 9:30–11:00 AM ET
Recommended: ON
Maximum Signals per Session
Default: 2
That matches the spirit of PB's limited-trade approach.
Show Safest Swing Stop Reference
ON by default
Displays the manipulation swing as a visual stop reference.
This is only a reference, not an automatic order.
Dashboard
The bottom-right dashboard is basically your checklist:
PB BIAS — Bullish / Bearish / Wait
1D / 4H — individual HTF states
1H / 15M — additional bias context
DOL — BSL or SSL
KEY — active PB key level
MODEL — current setup stage
SESSION — Golden Hour or Outside
SIGNALS — how many PB signals have fired
The most useful MODEL states are:
WAIT BIAS
→ WAIT KEY
→ WAIT TOUCH
→ WAIT 1M/2M/3M/4M/5M CLOSE
→ PB LONG / PB SHORT
So the simplest way to use the indicator is:
Let the dashboard walk you through PB Blake's process instead of manually hunting every concept on the chart. Wskaźnik

Pivot Scoreboard [AFD]**How many times has price tested R1 this session — and did it hold or break each time?**
If you trade off pivots, you already know where the levels are. What you don't have is their record. Was this the second test of S1, or the fifth? Has the CPR held the last three times price came back to it, or is it starting to give way? Every pivot tool on the shelf draws the same lines and then goes quiet — so you end up trading levels with no memory, where the first test and the fifth look exactly alike.
**Pivot Scoreboard keeps the record** . For the current period's pivot ladder and Central Pivot Range, it counts **how many times price has tested each level**, and whether each test **held** (price closed back on the side it came from) or **broke** (price closed through). The market draws the lines; this one records what happened at them.
### Why it matters###
A level nobody has tested is just a line on a chart. A level price has tested four times and held four times is one the market is actively defending — and the day it finally breaks, that's a change you had no way to see when every touch looked the same. The count is the context: it tells you whether a level is being respected or worn down, this period, on this symbol. It is a plain description of what has already happened — never a prediction, and never a signal to act.
### At a glance###
###Capability - What you get ###
**Touch scoreboard** A per-level count of tests this period — on the level's label (`R1 ·3`) and in the card
**Held / broke split** For each core level, how many of those tests held versus broke |
**Nine pivot formulas** Switch the whole ladder between nine conventions (table below) |
**Central Pivot Range** The TC/BC balance band, kept on the floor-pivot basis whichever formula you pick
**Five anchors** Daily · Weekly · Monthly · Quarterly · Yearly — or Auto, which picks the shortest sensible one
**Five neutral alerts** CPR entry, CPR exit up, CPR exit down, first R1 test, first S1 test — all on confirmed closes
**Location read** demoted line still names where price sits right now (secondary to the score) |
**Appearance** Ten palettes, per-zone custom colours, an optional active-zone glow, configurable labels and card
### Nine pivot formulas, one ladder###
Trade the convention you already use — the scoreboard counts touches on whichever levels it draws. "Tiers" is how many resistance/support steps each formula defines above and below the pivot.
### Formulas ###
**Floor Pivots** *(default)* // PP = (H + L + C) / 3; R/S from 2·PP
**Fibonacci** // R/S at 0.382 / 0.618 / 1.0 × range, off PP
**Woodie** // Weights the period's open: PP = (H + L + 2·Open) / 4
**Classic** // R/S at PP ± 1 / 2 / 3 × range
**DM** // A conditional sum keyed to prior open vs close
**Camarilla** // Close ± 1.1·range ÷ {12, 6, 4, 2}, plus a wide 5th tier
**Frank Dilernia** // R/S at ½ / 0.618 / 1.0 × range, off PP
**Shadow Trader** // The floor-pivot tiers (its own published basis)
**ACD Method** // PP ± the distance from PP to the H/L midpoint
The **Central Pivot Range** stays on the floor-pivot basis whichever formula you choose, so the balance band is a stable reference and does not shift when you switch lenses.
### How a test is scored###
The ladder is built from the *prior* completed period's high, low and close:
```
PP = (prior high + prior low + prior close) / 3
R1 = 2 × PP − prior low S1 = 2 × PP − prior high
CPR: BC = (prior high + prior low) / 2 ; TC = 2 × PP − BC (sorted)
```
Then, for each drawn level, on every **confirmed** bar:
**Touched** — the bar's range includes the level (low ≤ level ≤ high).
**Test** — counted when a bar touches a level the *previous* confirmed bar did not. This "leading edge" rule means a level price hugs for five bars counts **once**, not five times.
**Held / broke** — *held* when the bar closes back on the side it approached from (a rejection); *broke* when it closes through (an acceptance).
**Reset** — counts return to zero at each new period, because the levels are redrawn from the new prior high/low/close.
These are **descriptions of what the chart has already done** — counts of observed touches — not predictions, signals, or trade instructions. A high test count is a record, not a probability.
### How it differs from Pivot Matrix + Zones ###
The account also publishes `Pivot Matrix + Zones `, a pivot **workbench** — compare formulas across packs side by side, score confluence, read the current location. Pivot Scoreboard is a different job: **one ladder, and a running tally of how price has interacted with it.** They are complements, not versions of each other — run whichever fits the question you're asking.
### The visuals###
- **Levels and CPR band.** PP is the strongest line; the CPR is a neutral balance band; further tiers fade with distance. Each level's label carries its test count.
- **Scoreboard card.** The core levels — R1, PP, S1 and the CPR boundaries — with their tests and held/broke split; hover the header for a note on the `3 (1/2)` format. Below them a demoted **Now** line (the current location, its cell tinted the zone's colour with automatically legible text), the furthest tier reached this period, and the anchor in use.
- **Active-zone glow (optional).** The zone price is currently in can be filled with a soft gradient that follows price. It is secondary — the scoreboard is the point — and can be turned off.
### How to use it###
- Leave **Anchor** on Auto and it picks the shortest sensible higher timeframe, or set it directly. The anchor must be **strictly above** your chart timeframe.
- Use **Map depth** — Core shows R1/S1 and the CPR; Extended adds the outer tiers, each with its own count.
- Everything else (formula, palette, custom colours, labels, the card, the glow) is a setting — configure it once to taste.
### What it deliberately does not do###
It does not compare formulas side by side, score confluence, or rank anything. It draws one ladder and keeps score on it. It makes **no** accuracy, reliability, profitability, probability or future-result claim; a test count describes the past, not the future. Educational chart context, not financial advice.
### Data, timeframes and repainting###
- Prior high/low/close is requested from the symbol's exchange-default feed, offset by one completed period **and** with `lookahead_on` — the standard anti-repaint form — so the current, still-forming period never enters the ladder. Every test and event is evaluated on **confirmed bar closes**; nothing is back-placed.
- The above describes the **mechanism**. Confirm the behaviour with the bar-replay tool on your own chart and timeframe before relying on it.
- **Yearly is the highest anchor**, so a chart at or above 12 months has no valid anchor and the script says so.
- **Standard time-based candles only.** Heikin Ashi, Renko, Range and similar are rejected, because the tests read chart OHLC.
- A running alert keeps the inputs, symbol and timeframe it was created with — recreate an alert after changing any of them.
### Originality and credit###
Other pivot tools plot levels; this one turns a single ladder into a **running record of how price has tested it** — test counts with held/broke per level, reset each period — deliberately restricted to descriptive context. Open source under the **Mozilla Public License 2.0**. © Auction Foundry LLC. Wskaźnik

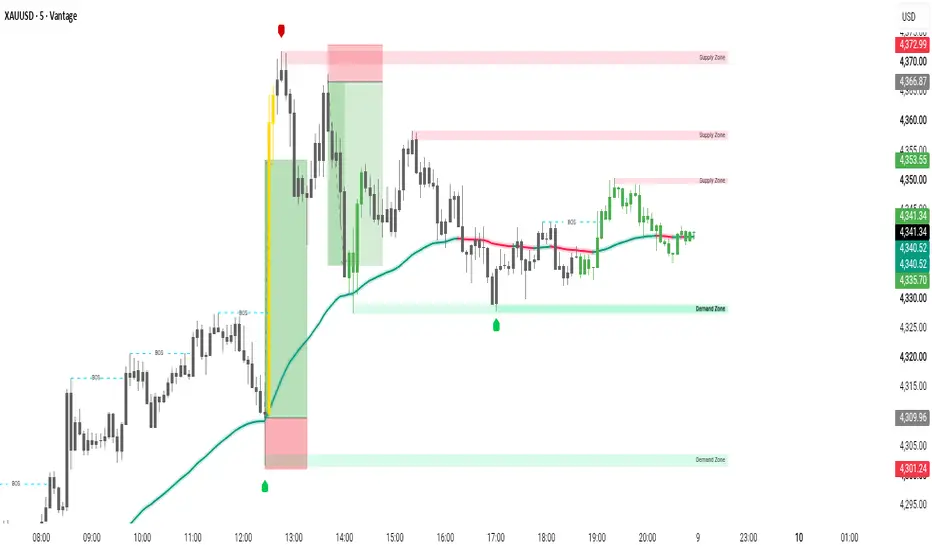
SMC Institutional Execution & Liquidity Matrix PROSMC Institutional Execution & Liquidity Matrix PRO
SMC Institutional Execution & Liquidity Matrix PRO is an advanced, institutional grade technical analysis framework engineered for modern technical traders and quantitative analysts. It provides an intuitive, high definition visual presentation of Smart Money Concepts, dynamic liquidity zones, market structure shifts, and institutional order flow bias without cluttering price action.
Key Features Overview
1. Glowing Trend Wave Engine
Features an ultra smooth dynamic trend wave layer with a soft glow effect. It seamlessly adapts color according to current market momentum, helping traders instantly identify overall dynamic directional bias.
2. Clean Split Line Market Structure
Maps Break of Structure (BOS) and Change of Character (CHoCH) points with extreme precision. The structure line splits neatly in the center with a dedicated gap around the text label, keeping price action clear and uncluttered.
3. Auto Cleaning Institutional Liquidity Zones
Automatically detects Supply and Demand imbalances and key liquidity pools. To maintain visual clarity, mitigated zones automatically adjust and delete themselves as soon as price fills the imbalance.
4. Text Free Major High and Low Badges
Isolates major macro swing high and low extremes using solid colored badges without text clutter. Highlights Intermediate Term High and Low alternatives for instant turning point identification.
5. Smart Candle Heatmap & Displacement Highlights
Dynamically colors price candlesticks based on overall macro trend state, while highlighting high momentum volume displacement expansion candles in a distinct gold color.
How to Use
Step 1: Determine Macro Bias
Observe the Glowing Trend Wave and dynamic candle theme to assess overall institutional trend bias and momentum.
Step 2: Monitor Clean Structure Signals
Look for precise Break of Structure lines and Change of Character signals to identify structural continuity or reversals.
Step 3: Execute in Active Liquidity Zones
Utilize active, unmitigated Supply and Demand boxes for high probability entry and exit locations aligned with order flow.
Settings Overview
Glowing Wave Settings
- Show Glowing Trend Wave: Toggle display of the dynamic trend wave.
- Wave Period & Line Thickness: Adjust wave sensitivity and visual halo glow.
Market Structure Settings
- Show BOS & CHoCH Lines: Toggle market structure signals.
- Customization: Independently adjust line styles, line width, and font size.
Liquidity Zone Settings
- Show Auto Liquidity Zones: Toggle Supply and Demand boxes.
- Zone Fill Transparency: Customize fill opacity from 0 to 100.
Major Swing Settings
- Show Clean Major Swing Badges: Toggle directional pivot badges.
Disclaimer
This script is built strictly for educational, analytical, and charting enhancement purposes. It does not provide financial advice, automated trade signals, or guaranteed results. Always practice strict risk management.
Wskaźnik

One Time FramingOTF Trend
One Time Framing is a simple idea from auction market theory (the AMD / Market Profile world) that gets overcomplicated more often than it needs to be.
A market is one time framing up when each bar makes a higher low than the one before it. That's the whole test — the highs aren't part of it. Sellers might still be winning the fight for the high, but as long as they can't push price below the previous bar's low, they're not getting control of the auction. Buyers are setting the floor, one bar at a time, and one timeframe of participant is running the show. One time framing down is the mirror image: each bar makes a lower high, and buyers can't lift price above the previous high.
What the indicator draws
A green triangle below the bar when a new upward run begins, a red triangle above the bar when a new downward run begins. Faded dots mark each bar the run continues. A small × marks the bar where the run ends.
You choose how many consecutive bars are required before it counts. The default is 2 — one higher low is enough to call it. Push it to 3 or 4 and you'll get far fewer signals, but the ones you get will have more behind them. I'd suggest 3 on daily and weekly charts, 2 on intraday.
Inside bars
An inside bar has a higher low and a lower high. On the letter of the definition, it technically qualifies as one time framing in both directions at once. So this indicator treats inside bars as neutral. They don't extend a run and they don't break one — the count simply pauses. Price is coiling, nobody is in control, and the trend picks up where it left off on the next real bar. Inside bars get their own colour so you can see them at a glance.
There's a second job inside bars do here though. Because they represent a genuine pause, a break of an inside bar's range is often the moment the trend actually turns. So when an inside bar prints, the indicator remembers its high and low. If price then breaks out of that range in the opposite direction to the current trend, that counts as a reversal and flips the trend immediately — you don't have to wait for a fresh run to build up from scratch. This tends to get you in a bar or two earlier at turning points.
That pending setup expires if nothing happens within a set number of bars (default 8), so a stale inside bar from thirty bars back can't fire off a signal that has nothing to do with current price action.
What actually triggers a new trend
In priority order, each bar:
No trend running and a fresh run qualifies → new trend, triangle prints
An inside bar range break against the existing trend → reversal, triangle prints
The current run is broken → trend ends, × prints
A trend ending and a new one starting in the other direction are deliberately kept on separate bars. You could argue for collapsing them into one, but I'd rather see the exit clearly than save a bar on the entry.
Settings
Optional bar colouring for up runs, down runs and inside bars, all colours adjustable
Optional moving average with a choice of types (EMA 21 by default) purely for context — it plays no part in the signal logic
Alerts for new bullish and bearish runs, for inside bar reversals specifically, and for a trend ending
The run depth counters are exposed in the Data Window if you want to see how deep the current run is
Things to consider
Set your alerts to Once Per Bar Close. The state of the current bar can change as its high and low extend, so anything read intrabar isn't final.
Also be aware that a large gap can satisfy "higher low" on its own without any real structure behind it. Worth knowing if you're running this over earnings on equities or any asset that gaps over a weekend or overnight.
This isn't a standalone system. One time framing tells you who's in control right now, not whether you should be in the trade. Use it for confirmation and for timing entries within a bias you've already formed elsewhere.
Wskaźnik

Trender [IQ]IQ Trender - TradingIQ
🔹 OVERVIEW
IQ Trender is a non-repainting trend rail built around one simple visual language:
Flat = range. Ramp = trend. Brightness = conviction.
Most trend tools try to follow every movement in price. In sideways conditions, that can leave you reading a line that bends, twitches, and changes direction inside the same noise you were trying to filter.
IQ Trender is designed to behave differently. While the market remains inside its adaptive hold zone, the rail stays deliberately flat. When the underlying trend evidence becomes strong enough, it commits to a rising or falling leg and moves in one direction until that condition genuinely changes.
The result is a clean distinction between three market states:
Holding - the rail is flat and the market is being treated as a range or consolidation.
Rising - the rail has committed to an upward leg.
Falling - the rail has committed to a downward leg.
Direction is shown by color. Conviction is shown by color intensity and glow. The Trender Radar explains the current state numerically, while the Ghost Forecast extends the rail's present trajectory into a fading uncertainty cone.
This is a trend-reading and visualization tool, not a signal service. It does not issue buy or sell calls, and it makes no claim of profitability or predictive certainty.
🔹 THE ONE-LINE MENTAL MODEL
The fastest way to read IQ Trender is to ignore the mathematics at first and watch the shape of the rail:
A flat rail means the model is holding through noise.
An upward ramp means the model has committed to a rising leg.
A downward ramp means the model has committed to a falling leg.
A stronger glow means the estimated trend is showing greater statistical conviction.
This is the same sequence demonstrated in the walkthrough: a directional leg can flatten during a pause, pullback, or consolidation, then recommit if the broader move resumes. The bearish interpretation is the mirror image - falling leg, flat hold, then a renewed falling leg if downside evidence returns.
The flat section is important. It is not a prediction that a breakout is about to happen. It is the indicator saying that current movement has not earned a directional commitment.
🔸 HOW THE ENGINE WORKS
IQ Trender combines three separate jobs: estimating the trend beneath price, deciding whether that trend is statistically meaningful, and drawing a rail that cannot wiggle backward within a committed leg.
Track the underlying trend
A robust local-linear Kalman filter estimates the level and slope beneath the candles. Unlike a conventional moving average that applies a fixed weighting pattern, this is a state-estimation model: it updates its estimate from the difference between expected and observed price.
Large isolated deviations are reduced with a robust update, so a single wick cannot directly yank the rail to a new location. The model also adapts its measurement-noise estimate as conditions change.
⬞
Measure the uncertainty
The filter calculates an innovation deviation - a live estimate of how much movement is normal relative to its current model. IQ Trender uses that value to size the hold band.
When conditions are noisy, the tolerance can widen. When conditions are calmer, it can tighten. This lets the same mental model adapt across different symbols, price levels, and timeframes without using one fixed distance everywhere.
⬞
Test for commitment and change
The estimated slope is compared with its own uncertainty to produce conviction. Hysteresis uses separate thresholds for entering and leaving a committed trend, helping prevent repeated state changes near one boundary.
A two-sided cumulative change test also monitors standardized price surprises. That evidence helps the rail distinguish a genuine opposing change from ordinary counter-movement when a leg is already active.
⬞
Draw the rail
The visible rail is a separate, slew-limited ratchet guided by the Kalman center. Once an upward leg begins, the rail can only move upward until a valid reversal or hold condition is reached. Once a downward leg begins, it can only move downward.
That monotone-within-leg behavior is what creates IQ Trender's signature geometry: flat holds connected by clean directional ramps instead of a line that bends around every candle.
🔹 THE ADAPTIVE HOLD BAND
The shaded band is the rail's live range corridor.
While the rail is holding, the band opens around it to show the volatility-adjusted area in which price can move without forcing a directional leg. When the rail commits to a trend, the displayed band eases shut onto the rail because the model has left its holding state. When the rail becomes flat again, the band gradually reopens.
The band should be read as a model tolerance, not as conventional support and resistance. Price moving within it means the model can continue to hold. Movement beyond it contributes evidence for a new leg, but it is not, by itself, a guaranteed breakout or trade entry.
🔸 COLOR, GLOW & CONVICTION
IQ Trender communicates direction and commitment through one coordinated visual system:
Rising color - active upward leg.
Falling color - active downward leg.
Holding color - neutral, flat state.
Glow intensity - visual emphasis derived from the current conviction reading.
Conviction measures how strongly the estimated slope differs from zero relative to the model's uncertainty. It is a statistical strength reading, not the probability that a trade will win.
The palette is generated in the Oklab perceptual color space. Hue, lightness, and vibrancy can be adjusted as a coordinated system, while out-of-gamut colors are compressed toward neutral instead of clipping harshly.
Accessibility controls include deuteranopia, protanopia, and tritanopia modes, plus automatic contrast correction against the chart background. A selectable contrast target helps keep the rail and directional Radar accents legible across light and dark themes.
🔹 TRENDER RADAR
The Trender Radar is the live scorecard in the corner of the chart. It reports:
State - HOLDING, RISING, or FALLING.
Conviction - normalized trend commitment from 0-100%.
Slope - the rail's current rate of change per bar.
Hold Band - the current full width of the adaptive range corridor.
Behavior - the active Speed and Pursuit combination.
With Log Geometry enabled, slope is displayed as a percentage per bar and band width is expressed as a percentage of the rail. With linear geometry, both are shown in price units.
The Radar can be moved to any chart corner or disabled entirely.
🔸 GHOST FORECAST
The Ghost Forecast is a translucent forward projection of the rail's current slope.
Its centerline extends the rail's recent trajectory. The surrounding cone widens with distance to communicate increasing uncertainty, then fades away toward the horizon. Two growth modes are available:
√h - tighter near the live bar, then gradually widening like a random-walk spread.
Linear - uncertainty expands at a constant rate.
The forecast is rebuilt only at the live edge and never painted into historical bars. It can also be displayed while the rail is holding, where its centerline remains flat.
This feature is a trajectory read, not a price target. It answers, Where is the rail currently heading if its present slope persists? It does not answer, Where will price trade?
🔹 FLIP MARKERS & ALERTS
Optional markers identify confirmed changes in rail state:
▲ - committed to a rising leg.
▼ - committed to a falling leg.
◇ - flattened back into a hold, when hold markers are enabled.
Markers are created only on confirmed bars. Once printed, they do not move.
Matching alert conditions are included for:
Trender committed to a rising trend.
Trender committed to a falling trend.
Trender flattened into a hold.
These alerts report state changes in the model. They are not automated trade recommendations and should be interpreted in the context of the symbol, timeframe, market structure, and the user's own risk process.
🔸 SPEED - THE OVERALL TEMPO
Speed changes the rail's pursuit rate and the width of its hold zone together:
Glacier - calm, structural behavior for slower or higher-timeframe reading.
Slow - patient swing behavior with a wider hold zone.
Balanced - the recommended reference setting, balancing hold and tracking.
Fast - more reactive behavior for shorter intraday movement.
Scalp - the tightest and quickest micro follower.
Slower settings generally require more displacement and move the rail more gradually. Faster settings use a tighter band and pursue price more aggressively. A faster preset is not automatically better: responsiveness and noise rejection are opposing trade-offs.
🔸 PURSUIT - HOW A COMMITTED LEG MOVES
Pursuit changes the shape of an active leg without changing the underlying trend evidence:
Steady - a constant-speed ramp established when the leg begins.
Eased - pursuit speed scales with conviction and feathers toward the estimated center.
Snap - the most decisive pursuit, with a higher movement rate and faster conviction scaling.
On slower Speed presets, Snap can appear more step-like. Steady produces the cleanest constant ramps, while Eased creates a softer approach.
🔹 HOW TO READ IQ TRENDER
Start with state
Flat rail means the model is holding. Rising or falling rail means it has committed directionally. This gives the chart an immediate range-versus-trend read before any number is considered.
⬞
Weigh the leg
Use conviction, glow, and slope together. A bright rail with firm slope represents stronger model commitment. Fading conviction says the trend estimate is becoming less distinct from noise; it does not guarantee an immediate reversal.
⬞
Watch the sequence
One useful continuation framework is:
Rising rail.
Flat hold during consolidation or pullback.
New rising marker and renewed upward rail.
The bearish sequence is the inverse. This is a way to organize market context, not a complete entry system.
⬞
Keep the forecast in its proper role
Use the Ghost Forecast to visualize current trajectory and uncertainty. Do not treat the cone edge or centerline as a promised future level.
⬞
Confirm with your own process
IQ Trender can be combined with price structure, volume, liquidity, momentum, or a trader's existing risk framework. No single state, marker, or Radar value should replace position sizing and independent confirmation.
🔸 INPUTS
Behavior
Speed
Pursuit
Source & Geometry
Price Source
Use Log Geometry
Close with Log Geometry enabled is the recommended general-purpose setup for ordinary positive price series. Log mode keeps slope and band behavior proportional across different price levels.
Rail, Band & Glow
Hold Band on/off
Band transparency
Rail Glow on/off
Glow intensity
Glow spread
Rail line width
Colors
Rising, Falling, and Holding anchors
Global hue rotation
Lightness adjustment
Vibrancy adjustment
Conviction Color response
Accessibility
Color-Blind Mode
Auto Contrast
Contrast Ratio
State Readout
Show Trender Radar
Radar location
Forecast
Ghost Forecast on/off
Horizon in bars
√h or Linear cone growth
Show While Holding
Markers
Flip Markers on/off
Optional hold markers
Marker size
🔹 NON-REPAINTING BEHAVIOR
IQ Trender is calculated causally with no future-bar lookahead.
Confirmed historical rail values and confirmed flip markers remain where they were calculated. The current, still-open bar can update as new price arrives, as any live indicator can. The Ghost Forecast is intentionally rebuilt at the live edge because it represents the rail's current slope and uncertainty; it does not rewrite historical bars.
What was confirmed in history stays confirmed. What is still live remains live.
🔸 LIMITATIONS & HONEST NOTES
IQ Trender is an indicator, not a validated trading strategy. It makes no performance, win-rate, profit, or edge claim.
Kalman filtering is still a causal estimation process. It reduces noise but cannot remove lag, uncertainty, or false transitions.
Faster settings react sooner but can respond to more noise. Slower settings filter more movement but can confirm later.
A Holding state identifies insufficient directional commitment in this model; it does not guarantee that price will remain inside a range or that a breakout is imminent.
Conviction measures the strength of the estimated slope relative to uncertainty. It is not a probability of future direction or trade success.
The Ghost Forecast extrapolates the rail, not price. It is a visual scenario if the current trajectory persists, not a target or prediction.
Alerts and markers identify model state transitions only. They should not be treated as standalone entries or exits.
Results depend on symbol behavior, timeframe, data quality, and the selected Speed/Pursuit combination.
IQ Trender is built to make one difficult market question easier to see:
Is the market still ranging, or has a trend actually committed?
One rail. Three states. No hindsight redraws.
Wskaźnik

Volume Exhaustion Trend LineVolume Exhaustion Trend Line
OVERVIEW
This indicator plots a trend line that switches position relative to price based on a specific shift in volume behavior at swing highs and swing lows: when a series of pivots that were previously confirmed by volume above its moving average suddenly gets followed by one or more pivots with volume below its moving average, in the direction of the prevailing trend. This break in the volume pattern is treated as an early warning that the current trend may be losing the participation that was driving it.
HOW IT WORKS
1. Swing highs and swing lows are detected using a fractal pivot: a configurable number of bars on the left validates the structural significance of the pivot, and a configurable number of bars on the right confirms it. Fewer right-side bars means faster (but slightly less certain) confirmation.
2. Trend direction is determined purely from price structure, not from a moving average: the trend is bullish when both the most recent swing high and swing low are higher than the previous ones (higher highs / higher lows), and bearish when both are lower (lower highs / lower lows).
3. Each confirmed pivot is classified as "strong" or "weak" by comparing the volume on that exact pivot bar against a simple moving average of volume.
4. The indicator watches for the transition point: while the trend is bullish, if a swing high forms with weak volume right after a swing high that had strong volume, an exhaustion warning state is triggered. It stays active for as long as new swing highs keep forming with weak volume. If a strong-volume high reappears, or the trend structure changes, the warning resets. The same logic applies in mirror for swing lows inside a bearish trend.
5. A line is plotted around price using a moving average offset by a multiple of ATR. In a bullish trend with no active warning, the line sits below price (green). As soon as the warning triggers, the line jumps above price (red) for as long as the warning stays active. The mirror applies in a bearish trend: line above price (red) normally, dropping below price (green) when a weak-volume low breaks a prior strong-volume pattern. The area between the line and price is filled with the corresponding color for visual clarity.
INPUTS
- Left Bars (structural strength): bars to the left required to validate the pivot's significance.
- Right Bars (confirmation delay): bars to the right required to confirm the pivot. Lower values react faster; higher values produce more reliable pivots.
- Volume MA Length: moving average length used as the volume reference for classifying a pivot as strong or weak.
- Line MA Length: moving average length used as the basis for the plotted line.
- ATR Length / ATR Multiplier: control how far the line sits from the moving average basis, in both its normal and warning position.
- Bullish / Bearish Colors: colors for the line and fill in each state.
HOW TO USE IT
Line below price, green: the market is in a structurally confirmed uptrend and recent highs are still backed by above-average volume.
Line jumps above price, red, while price is still trending up: recent high(s) were not backed by above-average volume after previously being backed by it. Treat this as a signal to pay closer attention to that area for a possible loss of upside momentum, not as an automatic sell trigger.
Mirror logic applies in a downtrend: line above price (red) normally, dropping below price (green) when recent lows stop being confirmed by above-average volume after previously being confirmed by it, suggesting selling pressure may be fading.
This indicator identifies a condition, it does not generate entries or exits on its own. It is meant to be combined with your own structure, level, and risk analysis.
LIMITATIONS
- Pivots require Right Bars to pass before they can be confirmed, so every line change is applied with a delay equal to that setting relative to when the actual high/low occurred. Once plotted, it does not repaint or move retroactively.
- Volume shown on non-centralized markets (forex, CFDs, spot metals) is broker/feed-reported tick volume, not centralized traded volume. Interpret weak/strong volume readings on these instruments with that in mind.
- Like any structure-based tool, results vary by instrument, timeframe, and the settings used. Wskaźnik

HTF Swing Highs & LowsAn open-source multi-timeframe market structure indicator that automatically identifies and projects confirmed swing highs and swing lows from the Weekly, Daily, and 4-Hour timeframes onto any lower timeframe chart.
The indicator is designed to provide clean, non-repainting support and resistance levels based on confirmed market structure rather than developing pivots.
Features
- Weekly, Daily and 4H swing highs and lows
- Non-repainting confirmed pivots
- Automatic higher timeframe detection using request.security()
- Horizontal levels extended until invalidated
- Independent visibility controls for each timeframe
- Hierarchical timeframe filtering
- Custom colours and line widths for every timeframe
- Adjustable pivot strength
- Wick, Close or Never invalidation options
- Stop or Delete broken levels
- Automatic level management to prevent exceeding TradingView object limits
How it works
The script uses confirmed pivot highs and lows from higher timeframes.
Unlike developing pivots, a swing is only confirmed after the selected number of candles has formed on both sides of the pivot. Once confirmed, a horizontal level is created at the swing price and extended to the right.
Because only confirmed pivots are used, historical levels do not repaint.
Pivot Strength
Pivot Strength controls how significant a swing must be before it becomes a level.
A strength of 3 means the pivot candle must have:
- three lower highs (or higher lows) before it
- three lower highs (or higher lows) after it
Higher values filter market noise and identify more significant market structure.
They also produce fewer levels and require longer confirmation.
Lower values detect smaller swings, produce more levels, react faster.
Level Invalidation
Choose how a level is treated once price trades through it.
Wick - Invalidates when price wicks beyond the level.
Close - Invalidates only after a candle closes beyond the level.
Never - Levels remain permanently.
Broken levels can either:
- Stop extending while remaining visible
- Be deleted completely
Hierarchical Visibility
The indicator can automatically display only relevant higher timeframe levels.
For example:
- Weekly levels appear on Weekly and all lower timeframes.
- Daily levels appear on Daily and all lower timeframes.
- 4H levels appear on 4H and lower charts.
This helps reduce clutter when analysing higher timeframe charts.
Notes
- Uses confirmed higher timeframe pivots only.
- Levels are anchored to the original swing candle.
- Designed for support and resistance, market structure, liquidity analysis, and confluence with other tools.
- Works on all symbols and asset classes supported by TradingView. Wskaźnik

Machine Learning Trend Channels [FEELS]Trend channels placed by a machine learning model (change-point detection) instead of a length you have to guess. The model decides where one period of price behaviour ends and the next begins, how many periods the chart has, and how wide each channel should be. There is no length input anywhere in this script — the whole history comes out as a chain of channels handing over to one another, with no gaps and no overlaps.
FEATURES
- Periods found by an online change-point search, one channel per period, covering the history continuously
- No length setting to guess — the model chooses every boundary and how many periods there are
- The cut score carries no units, so the same setting behaves the same way on a quiet index and on a coin in free fall
- Fitted in log price, so one long trend is not split apart by its own curvature
- Channel width learned from the spread of that period's own bars, not an ATR multiple and not a fixed number of deviations
- Colour from slope measured against the period's own width: up, down, or sideways
- Panel comparing the period now forming with the median of this symbol's own past periods of the same kind
- A closed period is frozen at the moment it closes and is never recalculated
- Alert when a period closes and a new one opens
- Every model parameter, colour and size adjustable, every input has a tooltip
HOW IT WORKS
For the stretch of price it is currently holding, the model asks one question on every closed bar: is this better described by one straight line, or by two?
It scores every possible place to cut that stretch and takes the best one. The score is how much the cut improves the fit, divided by how badly the two resulting lines still fit. That second half is the important part. Dividing by the stretch's own leftover spread is what strips the units out of the number, so a violent market does not get chopped more finely than a calm one merely for being violent. When the score clears the Detail threshold, the left piece is closed permanently and the right piece becomes the new forming period.
Everything is fitted on the logarithm of price. In plain price, one long exponential trend gets broken into a dozen channels purely by its own curvature, which is a measurement artefact rather than market structure.
The width is measured, not assumed. Each channel takes its width from how far its own bars actually strayed from its own line, drawn just wide enough to hold the share you set under "Channel covers". A period whose bars hugged the line is thin; a period that swung around it is wide.
HOW TO READ IT
1. A solid channel is a closed period. Its slope, width and endpoints were fixed the moment it closed. An outlined channel is the period still forming, shown together with the cut the model is currently leaning towards.
2. Colour is slope. A period is called sideways when its whole rise or fall is smaller than its own width, that is, when the drift is smaller than the noise around it.
3. Width is dispersion, not a boundary. A wide channel says that period was noisy. It does not say price will turn there.
4. The panel puts the forming period next to what this symbol's own periods of the same kind have typically looked like. "down, 21 bars, usually 31, moved -14.7%, usually 50.6%" reads as: shorter and far smaller than this symbol's usual decline, so far. The sample count is shown next to it, because five periods is a hint and sixty is a distribution.
ORIGINALITY
Every channel tool on this platform asks you for a length. Fifty bars, two hundred, and the entire picture changes with that one number. The better ones automate it by scanning lengths and keeping the best-fitting window, which still produces a single channel measured backwards from today.
This one treats the chart as a segmentation problem instead. The whole history is a chain of periods that hand over to one another, the boundaries are found rather than set, and the number of periods is an output rather than an input. The scale-free cut criterion, the log-space fitting, the learned width and the comparison of the live period against this symbol's own past periods are written from scratch for this script.
HONESTY
- Closed periods never change. Once a cut is confirmed, that channel's numbers are frozen and the drawing is rebuilt from those frozen numbers, so stepping through bar replay will not move a solid channel.
- The forming period does change, and it is the whole forming period, not only its last few bars. Its cut stays provisional until confirmed, which typically takes twenty to thirty bars after the fact. That is why it is drawn as an outline. Any tool that finds structure behaves this way.
- The channel edges are not support and resistance, and I checked rather than assumed. Asking only about the very next bar, price leaves a band built to hold ninety per cent of its own bars far more often than that width suggests, and the bars that escape go out of the top and the bottom in roughly equal numbers. There is no bounce hiding in the edges.
- Nothing here predicts anything. A closed period is a statement about bars that have already closed.
- The panel medians describe past periods on the current symbol and timeframe. They are not performance figures and small samples move them a great deal, which is why the count is on screen.
- TradingView allows a script five hundred drawing objects and drops the oldest past that, so only the most recent periods are drawn. Raise "Periods kept on screen" if you want more history covered.
ALERTS
A period closed and a new one opened.
SETTINGS
Every input has a tooltip. The main ones: "Detail" sets how much better two lines must fit than one before a period is closed, and because it carries no units the same value transfers across symbols and timeframes. "Shortest period" and "Longest period" are hard bounds in bars. "Channel covers" is the share of a period's own bars the channel is drawn wide enough to hold. "Call it sideways below" controls how small a move must be, relative to its own width, to be coloured sideways. "Periods kept on screen" trades history for drawing budget.
This is a descriptive tool for reading price structure. It is not financial advice and does not predict price.
Wskaźnik

Wskaźnik

Adaptive Trend Pulse Pro [JPT]🔷 OVERVIEW
Adaptive Trend Pulse Pro is a professional trend-following and trade-management indicator designed to help traders identify confirmed market direction, filter weaker setups, and structure potential trades with predefined Entry, Stop Loss, and Take Profit levels.
The system combines an adaptive trend engine, EMA confirmation, RSI momentum, volume analysis, candle momentum, signal scoring, ATR-based risk management, and multi-market monitoring into one streamlined TradingView indicator.
It is designed for traders who want a cleaner way to evaluate trend transitions without relying on a single indicator or isolated signal.
🔷 CORE CONCEPT
The indicator follows a simple principle:
Detect the trend → Confirm the setup → Score the signal → Define risk → Manage the trade.
Instead of treating every trend change as an immediate trading opportunity, the system applies additional confirmation filters before displaying a potential LONG or SHORT setup.
This helps make the signals more selective and provides a structured framework for discretionary trading.
🔷 SIGNAL ENGINE
The Adaptive Trend Engine continuously evaluates price movement and volatility to determine the current market direction.
🟢 LONG Environment
A bullish environment is identified when the adaptive trend structure shifts upward.
Additional confirmation can come from:
Price above the EMA
RSI bullish momentum
Above-average volume
Bullish candle momentum
Confirmed candle close
🔴 SHORT Environment
A bearish environment is identified when the adaptive trend structure shifts downward.
Additional confirmation can come from:
Price below the EMA
RSI bearish momentum
Above-average volume
Bearish candle momentum
Confirmed candle close
🔷 SIGNAL SCORE
The indicator includes a Signal Score designed to help distinguish stronger setups from weaker ones.
The score evaluates multiple conditions rather than relying on trend direction alone.
Higher score = stronger confirmation.
Users can adjust the Minimum Signal Score depending on their preferred trading style.
Suggested approach
3/4 — Balanced
More opportunities while still requiring confirmation.
4/4 — Strict
Fewer signals with stronger confirmation requirements.
🔷 ENTRY SYSTEM
When a confirmed LONG or SHORT setup appears, the indicator automatically establishes an approximate trading entry based on the confirmed signal candle.
LONG
LONG → Entry → Stop Loss → TP1 → TP2 → TP3
SHORT
SHORT → Entry → Stop Loss → TP1 → TP2 → TP3
The levels are dynamically calculated from current market volatility.
🔷 STOP LOSS
The Stop Loss is calculated using ATR-based volatility.
This allows the distance to adapt to the market rather than using one fixed number of points.
The Stop ATR Multiplier can be adjusted according to the market and timeframe.
A higher multiplier provides a wider volatility allowance.
A lower multiplier creates a tighter risk level.
🔷 TAKE PROFIT SYSTEM
The indicator provides three structured targets:
🎯 TP1 — 1R
First objective.
🎯 TP2 — 2R
Second objective.
🎯 TP3 — 3R
Extended objective.
The R-multiple is based on the distance between Entry and the initial Stop Loss.
Example:
Entry = 100
Stop = 98
Risk = 2 points.
Therefore:
TP1 = 102
TP2 = 104
TP3 = 106
🔷 BREAK-EVEN MANAGEMENT
After TP1 is reached, the indicator can move the active Stop Loss toward the original Entry level.
This allows traders to protect the position after the first objective has been reached.
TP1 → Break-Even → TP2 → TP3
This feature can be enabled or disabled from the settings.
🔷 ATR TRAILING STOP
After TP2, an optional ATR trailing mechanism can be activated.
The trailing stop dynamically follows price based on current volatility.
This is intended to help protect open profit while allowing the trend enough room to continue.
🔷 RISK / REWARD ZONES
The chart can display visual risk/reward areas around an active setup.
The zones help traders immediately see:
🟢 Potential reward area
🔴 Risk area
⚪ Entry level
This makes it easier to visually evaluate the trade structure before taking action.
🔷 MULTI-ASSET SCANNER
The dashboard can monitor multiple markets simultaneously.
Example:
BTCUSDT — LONG
ETHUSDT — LONG
SOLUSDT — NEUTRAL
EURUSD — SHORT
XAUUSD — LONG
This allows traders to quickly compare market conditions without opening multiple charts.
🔷 PERFORMANCE DASHBOARD
The indicator includes a compact dashboard showing information such as:
Signal Score
Win Rate
Wins
Losses
Break-Even trades
Closed Trades
Current Trade Status
The dashboard is intended as a reference tool rather than a guarantee of future performance.
🔷 ALERT SYSTEM
Alerts are available for important events including:
🔔 LONG confirmation
🔔 SHORT confirmation
🔔 TP1 reached
🔔 TP2 reached
🔔 TP3 reached
🔔 Stop level reached
This allows traders to monitor setups without constantly watching the chart.
🔷 CONFIRMED SIGNAL LOGIC
The indicator uses confirmed-bar logic for its primary LONG and SHORT signals.
Signals are therefore intended to be confirmed at candle close rather than triggering from an unfinished candle.
However, this does not eliminate normal market risk or guarantee that every historical signal will behave the same way in live trading.
🔷 RECOMMENDED MARKETS
The system can be tested on a variety of liquid markets, including:
🥇 XAUUSD / Gold
₿ BTCUSDT
♦️ ETHUSDT
🟣 SOLUSDT
💵 EURUSD
📈 Major indices
The optimal settings can vary significantly between instruments and timeframes.
🔷 RECOMMENDED SETUP
Balanced Configuration
Amplitude: 12
ATR Length: 100
Channel Multiplier: 2.0
EMA: 200
RSI: 14
Minimum Score: 3/4
Cooldown: 5 bars
Stop ATR: 1.5
TP1: 1R
TP2: 2R
TP3: 3R
Break-Even: ON
ATR Trailing: ON
These are starting settings, not guaranteed optimal settings. Backtesting and forward testing should be performed for each market/timeframe.
🔷 HOW TO USE
🟢 LONG
Wait for the adaptive trend to turn bullish.
Wait for the confirmation score to meet your minimum requirement.
Wait for the confirmed LONG signal.
Review Entry and Stop Loss.
Evaluate the risk/reward structure.
Monitor TP1, TP2 and TP3.
Use Break-Even and trailing management if desired.
🔴 SHORT
Wait for the adaptive trend to turn bearish.
Wait for the confirmation score.
Wait for the confirmed SHORT signal.
Review Entry and Stop Loss.
Evaluate risk/reward.
Monitor TP1, TP2 and TP3.
Manage the position according to your risk plan.
🔷 IMPORTANT
Adaptive Trend Pulse Pro is a technical analysis tool, not a guaranteed-profit system.
No indicator can guarantee a specific win rate or eliminate losing trades. Market conditions, volatility, spreads, liquidity and timeframe can all affect results.
Always test the indicator on your preferred market and timeframe and use appropriate risk management.
Adaptive Trend Pulse Pro
Detect the trend • Confirm the setup • Define the risk • Manage the move Wskaźnik

COT Commercial Hedger ExtremeIn commodities, the crowd and the smart money sit on opposite sides of the same report every week. The Commitment of Traders breaks open interest into commercials -- the producers, merchants and processors who hedge physical -- and large speculators, who are mostly trend-following money. The commercials are the ones who actually touch the barrel, the bushel, the bar. When they move to an extreme, it pays to listen.
The pattern that marks real commodity bottoms is simple to say and hard to wait for: commercial hedgers covering shorts en masse, from a multi-year net-short extreme, and curling back toward flat or net long. That is the producers deciding price has fallen far enough that they no longer need to hedge aggressively. It happened at the 2008 low, it happened into the 2018-19 lows, and I used this exact tell to call the September 2022 gold bottom near $1,640 in real time on TradingView. Gold peaked above $5,500 in January 2026, a move of more than 200% from that low.
This indicator puts that read on your chart.
The colored net line is the commercial position: red when they're at an extreme and still pressing shorts (no bottom), yellow when they start covering up off that extreme, green when they curl to flat or net long (the bottom tell). A triangle marks the first week they begin covering, a diamond marks the cross to net long. The blue line is large speculators for context -- they are usually heaviest long right as commercials are heaviest short, which is the whole point. Optional small-trader line too.
The dashboard shows commercial net, where it sits in its multi-year percentile, the spec and small-trader nets, and whether covering is underway. Alerts fire when hedgers start covering and when they flip toward net long.
Works on any futures with a CFTC code -- gold, silver, copper, oil, grains, even the index futures. Set the code in the settings to match the contract you're charting. Default is gold.
One read in isolation is a tell, not a trigger. I pair it with trend and price structure -- it tells you the tank is full of fuel, not that the match is lit. But when commercials cover their shorts, I want to know. Wskaźnik

Butterworth Spectral Trend [QuantAlgo]🟢 Overview
The Butterworth Spectral Trend is a trend-following indicator built on a 2-pole Butterworth SuperSmoother rather than fixed moving averages or crossover logic. It extracts a low-noise spectral trend path from price, optionally stretches or compresses that path’s cutoff from residual signal-to-noise conditions, then converts filter slope into direction with hysteresis and hold controls so traders can separate genuine trend turns from short-lived noise across every timeframe and market.
🟢 How It Works
The foundation of the indicator is a classic 2-pole Butterworth SuperSmoother. Coefficients are derived from the live cutoff period and a damping factor (√2 by default for the maximally flat Butterworth response), then applied recursively to the selected price source, with an optional Nyquist average of the current and prior sample to suppress 2-bar oscillation:
butterworth_coefficients(float period, float damping) =>
float safe_period = math.max(period, 2.0)
float argument = damping * math.pi / safe_period
float alpha = math.exp(-argument)
float c2 = 2.0 * alpha * math.cos(argument)
float c3 = -alpha * alpha
float c1 = 1.0 - c2 - c3
A provisional filter always runs at the base cutoff. Residual energy (price minus provisional filter) and provisional slope energy are tracked with EMA-style RMS estimates. Their ratio maps market conditions into a noise weight that lengthens the cutoff when residuals dominate and shortens it when directional slope energy is cleaner:
float residual = price_source - provisional_filter
float signal_to_noise = residual_rms > 0 ? slope_rms / residual_rms : 10.0
float noise_weight = 1.0 / (1.0 + math.min(math.max(signal_to_noise, 0.05), 10.0))
float target_cutoff = min_cutoff + (max_cutoff - min_cutoff) * noise_weight
float desired_cutoff = adaptive_cutoff ? base_cutoff * (1.0 - adapt_strength) + target_cutoff * adapt_strength : float(base_cutoff)
The live cutoff is blended toward that target with a smoothing factor so period changes do not jump bar to bar. The final spectral filter is then computed from those adaptive coefficients. When adaptivity is disabled, the filter always uses the fixed base cutoff period.
Direction is read from the spectral filter’s slope, not from price-versus-line crossovers. Optional hysteresis requires opposite slope to exceed a multiple of its typical recent magnitude before a flip is allowed, and a minimum hold bar count enforces a cooldown after each flip:
float filter_slope = spectral_filter - nz(spectral_filter , spectral_filter)
float deadband = hysteresis * typical_slope
bool opposite_move = slope_direction != 0 and slope_direction != trend_direction
bool clears_deadband = abs_filter_slope > deadband or hysteresis == 0.0
bool hold_complete = bars_since_flip >= min_hold_bars
if opposite_move and clears_deadband and hold_complete
trend_direction := slope_direction
bars_since_flip := 0
This design means the trend path is spectral (period-based smoothing), while state flips are slope-gated. Clean directional conditions can tighten the cutoff for faster response; noisy conditions can lengthen it for more stability. Hysteresis and hold bars further reduce clustered flips without changing the underlying filter math.
Direction state is tracked through an integer trend direction, with signal conditions derived from comparing the current and prior bar states:
turned_bullish = trend_direction == 1 and trend_direction != 1
turned_bearish = trend_direction == -1 and trend_direction != -1
trend_changed = turned_bullish or turned_bearish
🟢 Signal Interpretation
▶ Bullish Trend (Green/Bullish palette): When spectral filter slope turns positive and clears any active hysteresis and hold constraints, the indicator enters bullish mode with bullish colouring applied across the SuperSmoother line, optional spectral bodies, gradient fill, and BUY label. This state persists until slope reverses with enough strength (and after enough bars) to satisfy the signal filters, allowing shallow noise wiggles in the filter to occur without flipping direction.
▶ Bearish Trend (Red/Bearish palette): When spectral filter slope turns negative under the same constraints, the indicator enters bearish mode with bearish colouring across all visual elements. A confirmed opposite slope move is required to exit this state and print a SELL signal.
🟢 Features
▶ Preconfigured Presets: Three parameter sets cover different trading approaches. "Default" targets swing trading on 1-hour to daily charts with a balanced base cutoff, moderate residual adaptivity, and lookback. "Fast Response" shortens the cutoff and strengthens adaptivity for intraday charts from 5-minute to 1-hour, where earlier turns matter more than flip sparsity. "Smooth Trend" lengthens the cutoff, softens adaptivity, and adds light hysteresis plus a short hold for position trading on daily and weekly timeframes, where false flips are more costly than delayed ones. Selecting a preset overrides the corresponding core, adaptivity, and signal inputs.
▶ Built-in Alerts: Three alert conditions cover all directional states. "Bullish Trend Signal" fires on the bar where trend direction confirms bullish. "Bearish Trend Signal" fires on the bar where it confirms bearish. "Any Trend Change" combines both into a single condition for traders who want a unified notification regardless of direction. Alerts continue to work even when signal labels are hidden.
▶ Visual Customisation: Six colour presets (Classic, Aqua, Cosmic, Cyber, Neon, and Custom) apply coordinated bullish and bearish colour schemes across the SuperSmoother line, spectral bodies, gradient fill, signal labels, and optional bar and background colouring. Bar colouring tints price candles with the active trend colour at a configurable transparency level, and background colouring extends the directional tint across the full chart pane.
Wskaźnik

Alpha Trend Hunter | PropTraderzOverview
Alpha Trend Hunter is an overlay trend-analysis indicator designed to identify directional transitions by requiring agreement between two independent components:
a custom smoothed synthetic price structure derived from OHLC data;
an ATR-based SuperTrend filter.
The indicator does not generate a Buy or Sell label from either component independently.
A signal is created only when both modules agree on direction and the combined directional state changes.
The intended workflow is therefore:
Price Smoothing → Synthetic Trend Direction → Volatility Trend Confirmation → Directional Signal
The underlying concepts of exponential moving averages, synthetic Heikin-Ashi-style calculations, ATR and SuperTrend are established technical-analysis concepts. The implementation focuses on combining them into a two-stage confirmation framework intended to reduce isolated directional transitions that are not supported by both price structure and volatility-adjusted trend.
1. Smoothed OHLC Foundation
The first stage of the indicator applies an exponential moving average independently to:
Open
High
Low
Close
The default smoothing period is:
14 bars
This creates four smoothed OHLC series:
smoothed open;
smoothed high;
smoothed low;
smoothed close.
The purpose of this initial stage is to reduce some of the short-term noise present in raw candles before the synthetic trend structure is calculated.
A larger HA Period produces more smoothing and slower reactions.
A smaller HA Period keeps the synthetic structure closer to raw price and therefore makes it more responsive.
2. Custom Synthetic Heikin-Ashi-Style Structure
After the OHLC series are smoothed, the script calculates a synthetic typical value:
Synthetic Typical =
(Smoothed Open + Smoothed High + Smoothed Low + Smoothed Close) / 4
A recursive synthetic open is then calculated.
On initialization:
Synthetic Open =
(Smoothed Open + Smoothed Close) / 2
After initialization:
Synthetic Open =
(Previous Synthetic Open + Previous Synthetic Typical) / 2
This recursive calculation creates a smoother directional structure that carries information forward from previous bars.
It should be understood as a custom Heikin-Ashi-style synthetic calculation, rather than the standard Heikin Ashi candle series supplied directly by TradingView.
3. Synthetic High and Low
The script constructs synthetic upper and lower values using the smoothed high/low together with the synthetic open and synthetic typical value.
Synthetic High
The maximum of:
smoothed high;
synthetic open;
synthetic typical.
Synthetic Low
The minimum of:
smoothed low;
synthetic open;
synthetic typical.
These values define the working synthetic price range used by the trend-line calculation.
4. Synthetic Mid-Line
The midpoint of the synthetic range is calculated as:
Mid-Line = Synthetic Low +
(Synthetic High − Synthetic Low) / 2
This is equivalent to the midpoint between the custom synthetic high and low.
The mid-line is then smoothed again using an EMA.
The default secondary smoothing length is:
2 bars
The result is plotted as the primary visible trend line.
5. Trend-Line Direction
The color of the main trend line is determined by the relationship between:
synthetic open;
synthetic typical price.
Bullish synthetic structure
When:
Synthetic Open < Synthetic Typical
the structure is interpreted as bullish.
Bearish synthetic structure
When:
Synthetic Open > Synthetic Typical
the structure is interpreted as bearish.
The trend line therefore provides a continuous visual representation of the direction calculated from the custom synthetic price series.
6. Secondary Smoothing
The Smooth parameter controls the final EMA applied to the synthetic midpoint.
Default:
2
Lower value
Produces:
faster trend-line response;
closer tracking of short-term movement;
potentially more directional changes.
Higher value
Produces:
smoother trend line;
slower reaction;
stronger filtering of small changes.
This parameter affects the displayed synthetic trend line.
It is separate from the HA Period used to smooth the original OHLC values.
7. SuperTrend Confirmation Filter
The second major component is TradingView's ATR-based SuperTrend calculation.
The SuperTrend uses two user-configurable parameters:
ATR Period
Factor
Default values:
ATR Period = 2
Factor = 2.0
SuperTrend constructs volatility-adjusted trailing boundaries around price.
The active trend direction changes when price moves sufficiently through the corresponding volatility boundary.
8. SuperTrend Direction
The script interprets the SuperTrend direction as:
Bullish
stDir < 0
Bearish
stDir > 0
The active bullish or bearish SuperTrend line is plotted independently.
A lightly shaded area between candle midpoint and the active SuperTrend boundary provides additional visual context.
9. ATR Period
The ATR Period controls how quickly the volatility measurement reacts to changing market conditions.
The default value is relatively short:
2 periods
Smaller ATR Period
Generally creates:
faster volatility adaptation;
more responsiveness to recent price movement.
Larger ATR Period
Generally creates:
smoother ATR values;
slower adaptation;
less sensitivity to individual short-term volatility changes.
Because the default setting is intentionally responsive, users should test longer ATR periods when applying the indicator to noisier instruments or lower timeframes.
10. SuperTrend Factor
The Factor controls the distance of the SuperTrend boundary from price.
Conceptually:
SuperTrend distance ∝ ATR × Factor
Therefore:
Lower Factor
Generally produces:
tighter SuperTrend boundaries;
faster trend changes;
more frequent directional transitions;
increased sensitivity to noise.
Higher Factor
Generally produces:
wider boundaries;
slower trend changes;
fewer transitions;
stronger filtering of smaller price movements.
So, similar to the Sensitivity concept in the previous indicators:
Higher Factor = generally fewer/slower SuperTrend transitions.
Lower Factor = generally more/faster transitions.
11. Dual-Confirmation Signal Logic
Signals require directional agreement between the synthetic price structure and SuperTrend.
Bullish agreement
A bullish state exists when:
synthetic open is below synthetic typical;
AND SuperTrend is bullish.
In simplified form:
Synthetic Bullish + SuperTrend Bullish = Long State
Bearish agreement
A bearish state exists when:
synthetic open is above synthetic typical;
AND SuperTrend is bearish.
In simplified form:
Synthetic Bearish + SuperTrend Bearish = Short State
Neither condition alone produces a signal.
12. Buy Signals
A Buy label appears when the indicator transitions into a new bullish agreement state.
This requires:
bullish synthetic trend;
bullish SuperTrend;
the combined bullish condition was not active on the previous bar;
the previous stored signal state was not already bullish.
Once the bullish state is recorded, repeated Buy labels are suppressed until the indicator first transitions into the opposite directional state.
This prevents the indicator from printing a Buy label on every bullish candle.
13. Sell Signals
A Sell label follows the inverse logic.
It requires:
bearish synthetic trend;
bearish SuperTrend;
a new bearish agreement state;
the previous stored state not already being bearish.
The persistent signal-state variable therefore allows the indicator to mark directional transitions rather than continuous conditions.
14. Why Two Trend Components Are Used
The two components measure trend differently.
Component Main role
Smoothed OHLC Reduces raw candle noise
Synthetic structure Measures directional price relationship
Synthetic trend line Visualizes smoothed structural direction
ATR/SuperTrend Volatility-adjusted trend confirmation
State engine Prevents duplicate signals
Buy/Sell labels Marks changes in confirmed direction
The synthetic component is derived primarily from smoothed price structure.
SuperTrend is driven by price plus volatility.
Requiring agreement therefore attempts to avoid treating a change in either calculation alone as sufficient confirmation.
15. Example Bullish Interpretation
Suppose the synthetic trend changes bullish.
That condition alone does not immediately require a Buy label.
The indicator also evaluates SuperTrend.
If SuperTrend remains bearish, the two systems disagree and no bullish signal is generated.
When both eventually satisfy:
Synthetic Trend = Bullish
and
SuperTrend = Bullish
a new bullish combined state can generate a Buy signal.
This structure is intended to filter some early synthetic transitions that occur before volatility-adjusted trend confirmation.
16. Example Bearish Interpretation
The same process applies inversely.
A bearish synthetic trend is insufficient by itself.
The SuperTrend direction must also be bearish.
Once both components agree and the indicator transitions from its previous state, a Sell signal can be displayed.
17. Signal Frequency
Signal frequency depends primarily on three parameters.
HA Period
Controls initial OHLC smoothing.
Higher values generally produce slower synthetic directional changes.
Smooth
Controls final smoothing of the synthetic midpoint trend line.
Higher values produce a smoother displayed trend line.
SuperTrend Factor
Controls volatility-boundary distance.
Higher values generally require a larger price movement before SuperTrend changes direction.
Because these parameters affect different parts of the framework, they should not be interpreted as interchangeable sensitivity controls.
18. Suggested Starting Parameters
The default configuration is:
HA Period: 14
Smooth: 2
ATR Period: 2
Factor: 2.0
These values provide a relatively responsive configuration.
Users working with particularly noisy instruments or very short timeframes may wish to test:
longer HA Periods;
longer ATR Periods;
larger SuperTrend Factors.
Users wanting faster response can experiment with smaller values.
No parameter combination is universally optimal.
19. Trend Line vs Signal
The main synthetic trend line and the Buy/Sell signals should not be interpreted as the same feature.
The trend line continuously reflects the synthetic structure.
Signals require additional SuperTrend agreement.
Therefore, the trend line can change directional state before a Buy or Sell label appears.
This difference is intentional.
20. Alerts
The indicator provides two alert conditions:
Buy Signal
Sell Signal
The Buy alert corresponds to a new bullish combined state.
The Sell alert corresponds to a new bearish combined state.
Alerts indicate only that the programmed conditions have been met.
They do not constitute independent trade recommendations.
21. Real-Time Behavior
The indicator evaluates information from the currently developing candle.
Consequently, conditions can evolve while a live candle is still open.
For traders who require confirmed signals, the safest interpretation is to evaluate the signal after the corresponding chart candle has closed.
The indicator should therefore not be marketed as universally non-repainting without additional restrictions or testing.
Historical conditions are naturally evaluated using completed bars, while a live candle can still change before closure.
22. No Higher-Timeframe Data Dependency
The current version does not request external symbols or higher-timeframe series.
Its calculations are based on the OHLC and volatility information of the chart on which it is applied.
This makes the indicator simpler than a multi-timeframe framework, but its behavior will still differ substantially according to the selected chart timeframe.
23. Timeframe Considerations
On lower timeframes:
market noise is greater;
synthetic trend changes may occur more frequently;
short ATR periods are more reactive;
SuperTrend reversals can occur more often.
On higher timeframes:
signals generally develop more slowly;
each transition represents a larger amount of underlying price movement.
Parameter values should therefore be evaluated independently for each timeframe and market.
24. Limitations
Alpha Trend Hunter is a reactive trend indicator.
It does not predict future price.
The underlying calculations use:
historical price;
current price;
moving averages;
ATR;
recursive synthetic values.
These calculations inherently react after price information becomes available.
A stronger degree of smoothing generally decreases noise but also increases lag.
25. Sideways-Market Limitation
The indicator is fundamentally trend-oriented.
During sideways or rapidly alternating conditions, both synthetic trend calculations and SuperTrend can produce repeated directional transitions.
The dual-confirmation requirement can reduce some isolated changes, but it cannot eliminate whipsaw risk.
The indicator does not contain a dedicated ADX or market-regime filter in its current version.
26. Risk Management
The indicator does not calculate:
position size;
account risk;
stop-loss placement;
reward/risk targets;
portfolio exposure.
Users must determine risk independently.
A Buy or Sell label indicates only a transition in the indicator's defined directional state.
27. What Alpha Trend Hunter Does Not Do
Alpha Trend Hunter does not:
execute orders;
connect to a brokerage account;
manage positions;
guarantee profitable signals;
predict exact tops or bottoms;
guarantee trend continuation;
identify institutional activity;
determine appropriate leverage;
determine individualized risk.
It is a technical-analysis and trend-visualization tool.
28. Intended Use
A practical workflow is:
use the synthetic trend line to observe the underlying smoothed direction;
observe the SuperTrend volatility regime;
wait for agreement between both components;
use the Buy/Sell transition as confirmation that a new combined state has formed;
evaluate market structure and personal risk independently before making any trading decision.
The indicator is designed to answer:
“Are smoothed price structure and volatility-adjusted trend currently pointing in the same direction?”
rather than:
“Will the next trade be profitable?”
Educational Purpose
Alpha Trend Hunter is intended for technical analysis, research and educational use.
Users should independently consider:
price structure;
volatility;
liquidity;
economic events;
timeframe;
execution conditions;
risk management.
Historical signals do not guarantee future results. Wskaźnik

MHIDa Volume-Dry PullbackMHIDa Volume-Dry Pullback is a context tool for reading pullbacks (dips) inside an uptrend where volume has dried up.
WHAT IT DOES
It flags bars where three conditions line up: (1) price is above a longer EMA (the uptrend gate), (2) price has pulled back below a shorter EMA mean while RSI is below a configurable "dip" threshold, and (3) current volume is below a fraction of its own moving average (volume has "dried up"). Optionally it also requires the current close to be higher than the previous close (a turn-up confirmation).
WHY VOLUME AND PRICE ARE READ TOGETHER
A pullback that happens on light volume usually carries less selling conviction than a pullback on heavy volume. Reading the two together (price structure + volume) gives more context than price alone. The indicator combines a trend/mean-reversion read (EMA gate, EMA mean, RSI) with a volume-average read in one tool because they qualify the same event from two different angles: one measures distance/momentum, the other measures how much the crowd participated in the move.
HOW IT IS CALCULATED
- EMA-gate: an exponential moving average (default length 50) used only to define the uptrend (close above it).
- EMA mean: a shorter exponential moving average (default length 20) used as the pullback reference (close below it = a dip).
- RSI (default length 14): the dip counts as "stretched" when RSI is below a configurable threshold (default 45).
- Volume average: a simple moving average of volume (default length 20). Volume is "dried up" when it drops below a configurable fraction of that average (default 0.7).
- Everything is read on closed bars only, no lookahead.
HOW TO USE IT
A lime triangle below the bar marks a bar where all conditions line up (uptrend + dip + dry volume, optionally + turn-up). Bars that are just "dip + dry volume" (without the full condition set) are also lightly shaded in gray as a softer visual cue. Use the highlighted areas as context to support your own reading of the chart, not as a buy signal. All inputs are adjustable in the settings, and the defaults are a starting point, not an optimized setup: tune them to the symbol and timeframe you are watching.
This is a context and educational tool. It is not a signal, not financial advice, and not a standalone trading system. Always do your own analysis and make your own decisions. Wskaźnik

Wskaźnik

ICT FVG + VI + SBThis indicator maps four related price inefficiencies from ICT (Inner Circle Trader) methodology on one chart, across as many timeframes as you like at once: Fair Value Gaps, Volume Imbalances, Full Gaps, and Suspension Blocks. Each is drawn as a time-anchored zone, colour-coded by type and shaded by timeframe, and each is tracked through its whole life — open, partially consumed, and fully filled.
The Four Inefficiencies (how each is defined)
Fair Value Gap (FVG) — a three-candle, wick-based gap: the third candle's low is above the first candle's high (bullish), or its high is below the first candle's low (bearish). The gap is the untraded space between those wicks. Drawn in orange.
Volume Imbalance (VI) — a two-candle gap between the candle bodies (measured body-edge to body-edge) where the wicks still overlap, so it is not a full gap. Drawn in blue. Measuring body-to-body keeps the zone correct regardless of each candle's colour.
Full Gap — a two-candle gap with no overlap at all, not even the wicks. Drawn in red.
Suspension Block (SB) — a Fair Value Gap that has a Volume Imbalance on BOTH of its junctions. This "block" of stacked inefficiency is optionally separated out and highlighted in purple, and labelled SB.
Why these belong together
FVGs, Volume Imbalances and Full Gaps are the same idea at different degrees — untraded/inefficient price left behind by a move — and in practice they overlap and stack at the exact same swings. Showing them in one tool, sharing one detection pass and one fill model, lets you see how an FVG's edges are (or are not) reinforced by imbalances (the Suspension Block case), and lets you judge which zones are "clean" versus already partly consumed. Splitting them across three separate scripts would hide those relationships and triple the drawing overhead.
Multi-timeframe
Turn on any combination of Monthly, Weekly, Daily, 4h, 2h, 1h, 90m, 30m, 15m, 5m, 3m, 2m and 1m. All enabled timeframes are detected and plotted together, and the shorter the timeframe the darker its shade, so you can tell at a glance whether a zone is a higher- or lower-timeframe inefficiency. "Always show current timeframe" keeps the chart's own timeframe on even if its box is unchecked. Timeframes below the chart's resolution can't be computed and are skipped.
The lifecycle of a zone
Open — an unfilled zone is shown in its element colour and extended to the right.
Partially filled — as price trades into a zone, the consumed part is shaded grey while the untouched part keeps its colour (a bullish zone is eaten from its top down to the lowest low reached; a bearish zone from its bottom up to the highest high). Optional.
Filled (mitigated) — once price fully trades back through a zone it is treated as mitigated: it is either removed, or kept in light grey (right edge frozen at the fill) as a record. Grey therefore always means "filled".
Levels
An optional midline (50%, consequent encroachment) can be drawn inside every zone, plus 25/75% quarter lines and 12.5/37.5/62.5/87.5% eighth lines inside the Daily/Weekly/Monthly zones.
How To Use It
Add it to any chart. By default it shows only the current timeframe's inefficiencies; enable higher timeframes to build a top-down map.
Treat unfilled zones as reference areas where price may react. The 50% midline and the quarter/eighth levels give internal reference points.
Use the partial-fill shading to see how far a zone has already been consumed, and the grey "filled" zones as a history of where inefficiencies were rebalanced.
Watch for Suspension Blocks (purple/SB) — an FVG braced by volume imbalances on both sides — as higher-interest zones.
"Min Size — All Gaps" filters out tiny noise; raise it on fast, low-timeframe charts.
Settings Overview
Elements: Fair Value Gaps (with "Include related Volume Imbalances" to merge edge VIs into the FVG box, and "Highlight Suspension Blocks"), Pure Volume Imbalances, Full Gaps.
Timeframes: individual toggles grouped into HTF / Hours / Minutes, plus "Always show current timeframe".
Colors: one base colour per element (FVG, Suspension Block, VI, Full Gap), a per-timeframe darkening step, and optional borders.
Display: extend distance, gap labels and their side, max open gaps per timeframe, remove-on-fill, show/partially-fill filled gaps in grey, max filled gaps, and per-element minimum sizes.
Level Lines: midline, quarters and eighths (the latter on Daily/Weekly/Monthly zones).
Technical Notes / Repainting
Higher-timeframe zones are detected with request.security on CONFIRMED, already-closed candles, so plotted zones do not repaint historically. The current, still-forming bar updates live: a zone can fill (turn grey or be removed), the partial-fill shading grows, and the newest zone on a timeframe only appears once its forming candle has closed. To stay within TradingView's drawing-object limits the tool keeps a rolling window — the most recent open zones, and the most recent filled (grey) zones, per element and per timeframe — so the oldest zones are dropped as new ones form rather than every zone in history being retained. This is an original implementation; it does not reuse external open-source code. After a code update, remove and re-add the indicator so it re-binds to the price scale. Wskaźnik

Premium and Discount Pivot Matrix [BigBeluga]Premium and Discount Pivot Matrix is an advanced market-structure terminal engineered for TradingView. It maps macroeconomic structural equilibrium by tracking historical price extremes and calculating accurate institutional auction zones.
Instead of printing static linear channels, this framework uses an active multi-pivot state matrix to calculate premium ceiling and discount floor boundaries. It pairs these levels with a real-time 100-Bin Volume Profile Matrix plotted directly at the leading edge of the chart, providing immediate clarity on volume distribution relative to the market's fair-value equilibrium.
NSE:NIFTY
BINANCE:BTCUSDT
🔵 CHANNEL CALCULATION METHODOLOGY
The central core of the indicator relies on a multi-layered geometric calculation engine to establish its tracking bands. The engine follows a distinct three-step sequence to construct the structural matrix:
1. Multi-Pivot Array Extraction Engine
Asymmetric Window Scanning Nodes: The engine scans the chart for structural price peaks and troughs using an adjustable lookback window ( Pivot Left/Right Bars ). For a pivot to be verified, it must be the absolute highest or lowest value within that specified bar radius.
FIFO Array Storage Matrix: When a high pivot is logged, it is pushed into the highPivots array; low pivots are funneled into the lowPivots array. The script features memory guardrails ( Max Pivots to Track ) that automatically shift old elements out of memory, limiting array depth to prevent memory allocation drag.
// Manage Arrays via FIFO (First-In, First-Out) Storage Architecture
if not na(pHi)
array.push(highPivots, pHi)
if array.size(highPivots) > arraySize
array.shift(highPivots)
if not na(pLo)
array.push(lowPivots, pLo)
if array.size(lowPivots) > arraySize
array.shift(lowPivots)
2. Mathematical Boundary Selection
Premium Ceiling Isolation Grid: The terminal continuously runs an evaluation sweep across the active high memory array and extracts the absolute highest peak value using an optimized maximum tracking filter node. This serves as the outer resistance band.
Discount Floor Isolation Grid: Concurrently, the engine sweeps the active low memory array to extract the absolute lowest trough value, setting the hard outer support band floor.
Step-Line Price Plotting Framework: Because it selects the maximum high and minimum low of a rolling historical lookback set, the boundaries plot on your canvas as clean, structural step-lines. These lines only shift when a new macro extreme is logged or when an older extreme drops out of the tracking array.
3. Dynamic Equilibrium Tracking State Machine
Fair Value Midline Matrix: The Equilibrium Midline represents the exact mathematical center of the active trading channel. It calculates the mid-point price by taking the average of the resistance ceiling and support floor arrays.
Structural Shifting Trend Cloud Filters: This midline acts as a real-time tracker for the value center of the asset. The internal state machine monitors this line on every tick and applies dynamic visual treatments: it flashes the Midline Rising Color when the value structure is shifting upward, and instantly mutates to the Midline Falling Color when structural value drops downward.
// Extract Channel Levels
float resistance = na
float support = na
if array.size(highPivots) > 0
resistance := array.max(highPivots)
if array.size(lowPivots) > 0
support := array.min(lowPivots)
// Calculate Midline
float midline = not na(resistance) and not na(support) ? (resistance + support) / 2 : na
🔵 CORE STRUCTURAL LAYOUT FEATURES
1. 100-Bin Volume Profile Distribution Matrix
Intra-Channel Grid Binning Engine: When enabled ( Show Volume Profile at Channel End? ), the indicator runs a localized calculation over a specified historical range ( Volume Profile Lookback ). It divides the vertical space between the resistance ceiling and support floor into 100 equal vertical bins .
Adaptive Transparency Histogram Blocks: It calculates the exact volume distribution for each candle across these bins, scaling the horizontal width of the resulting histogram bars ( Volume Profile Max Width ). Premium distribution bars (above the midline) use an automatic gradient that gets brighter near the resistance ceiling to flag overextended premium supply. Discount distribution bars (below the midline) flash brighter near the support floor to highlight historical institutional accumulation blocks.
2. Volumetric Breakdown & Reversal Markers
Boundary Breach Telemetry Glyphs: The terminal closely monitors interactions with the channel boundaries. If a candle breaks completely out of the rolling step-line range, it triggers high-visibility telemetry circle shapes directly on the chart canvas (Bullish Reversal on downward breaks, Bearish Reversal on upward crosses).
Time-Index Signal Buffer Guards: To prevent messy clutter, the script suppresses repetitive signals using a strict index tracking buffer rule. When a valid breach is confirmed, it stamps the signal with clean text labels tracking the exact transaction volume traded during the breakout bar.
// 100 Bin Volume Profile Matrix Execution snippet
int binsCount = 100
float channelRange = resistance - support
float binStep = channelRange / binsCount
array binVolumes = array.new_float(binsCount, 0.0)
array binHighs = array.new_float(binsCount, 0.0)
array binLows = array.new_float(binsCount, 0.0)
for i = 0 to binsCount - 1 by 1
array.set(binLows, i, support + i * binStep)
array.set(binHighs, i, support + (i + 1) * binStep)
🔵 SYSTEMATIC EXECUTION STRATEGIES & RISK INTERPRETATION
Premium Zone Reversals: When an asset rallies into the upper channel gradient, enters the PREMIUM zone, and tests the resistance ceiling, monitor the 100-Bin Volume Profile. If the profile shows fading volume bars at the highs, look for short setups targeting a mean-reversion move back down to the Equilibrium Midline.
Discount Value Accumulation Trim: When price action drops into the DISCOUNT zone and approaches the channel floor, check the volume profile. Heavy volume concentration at these lows confirms strong institutional interest. Look for long positions here, using the step-line support floor as a strict trade invalidation level.
Equilibrium Breakout Continuations: Watch the behavior of the asset when the Equilibrium Midline shifts color. A sharp upward shift in the midline accompanied by a validated volume expansion signature suggests a structural trend shift, opening up long continuation options up to the premium line.
🔵 INTERFACE CONFIGURATION AND PARAMETERS
Pivot Structure Configuration Blocks: Adjust left/right bar strengths and internal array memory slots to optimize the indicator for short-term swing scalping or long-term macro trend tracking.
Volume Profile Matrix Settings: Fine-tune lookback depths and maximum bar widths to scale the volume profile layout for any financial asset class or chart timeframe.
Styling & Visual Aesthetics Overrides: Fully customize colors for rising structures, falling boundaries, interior gradient fills, and background profiles to integrate seamlessly with your preferred light or dark charting interface.
Transform your charting layout from traditional linear indicators into a highly automated, volume-anchored volatility tracking network with the Premium and Discount Pivot Matrix terminal. Wskaźnik

CPR, Floor and Camarilla Pivots🍀Overview
CPR, Floor and Camarilla Pivots combines 3 popular pivot-point systems in one TradingView indicator. It calculates levels from the previous completed higher-timeframe candle and displays them directly on the price chart.
The indicator includes Central Pivot Range levels, traditional Floor Pivot support and resistance levels, and Camarilla levels. Each pivot group can be enabled, customized, extended, and labeled independently.
🍀Features
Displays CPR levels: Pivot, Top Central (TC), and Bottom Central (BC).
Displays Floor Pivot resistance levels R1–R4 and support levels S1–S4.
Displays Camarilla levels H1–H5 and L1–L5.
Uses the previous completed higher-timeframe candle to calculate pivot levels.
Includes an automatic higher-timeframe selection mode:
Charts below 1D use daily pivots.
Charts below 1M use monthly pivots.
Charts below 12M use yearly pivots.
Charts at or above 12M use 12-month pivots.
Allows a user-defined higher timeframe when more control is required.
Optionally shows only the current higher-timeframe period or preserves previous pivot periods on the chart.
Provides independent visibility controls for each pivot group and individual level.
Allows custom colors, line styles, and thickness for each level.
Supports line extensions to the left, right, both directions, or no extension.
Displays labels for active levels with optional price values.
🍀Inputs
General
HTF Method: Select Auto or User Defined for the pivot calculation timeframe.
Time Frame: Higher timeframe used when User Defined is selected. Default: D.
Show Only Current HTF Period: When enabled, removes previous pivot lines when a new higher-timeframe period begins.
CPR Pivots
Show CPR Group: Displays or hides the entire CPR group.
Label Offset: Controls the horizontal distance between CPR labels and the current bar.
Show Prices on Labels: Displays the calculated price beside each CPR label.
Pivot, TC, and BC: Enable or disable each CPR level and customize its color, line style, and thickness.
Floor Pivots
Show Floor Group: Displays or hides the entire Floor Pivot group.
Label Offset: Controls the horizontal distance between Floor Pivot labels and the current bar.
Show Prices on Labels: Displays the calculated price beside each Floor Pivot label.
R1–R4 and S1–S4: Enable or disable individual resistance and support levels and customize their colors, line styles, and thicknesses.
Camarilla Pivots
Show Camarilla Group: Displays or hides the entire Camarilla group.
Label Offset: Controls the horizontal distance between Camarilla labels and the current bar.
Show Prices on Labels: Displays the calculated price beside each Camarilla label.
H1–H5 and L1–L5: Enable or disable individual Camarilla levels and customize their colors, line styles, and thicknesses.
🍀Usage
Use the CPR Pivot as a central reference level for assessing price location and potential intraday bias. The TC and BC levels define the Central Pivot Range and can help identify the area around which price may consolidate or react.
Floor Pivot resistance levels R1–R4 and support levels S1–S4 can be used as potential reaction, target, breakout, or risk-management reference levels.
Camarilla levels can provide additional intraday reference points. The H3 and L3 levels are commonly monitored for potential directional reactions, while H4/H5 and L4/L5 may help identify stronger expansion or extended-price areas.
The indicator uses the previous completed higher-timeframe candle, so the plotted levels remain stable throughout the current higher-timeframe period. For example, daily pivot levels are calculated from the previous completed day when the daily timeframe is selected.
When multiple pivot systems overlap or cluster near the same price, that area may be useful as a stronger reference zone. Pivot levels are not guaranteed support or resistance and should be interpreted alongside price action, trend, volume, volatility, and broader market conditions.
🍀Disclaimer
This indicator is provided for informational and educational purposes only. It is not financial advice, investment advice, or a recommendation to buy or sell any asset.
Pivot levels are calculated reference points and do not guarantee that price will reverse, continue, or reach a particular level. Trading involves substantial risk, and past market behavior does not guarantee future results. Always conduct your own analysis and use appropriate risk management before making trading decisions.
Wskaźnik