Wedge Polaris [JOAT]Wedge Polaris
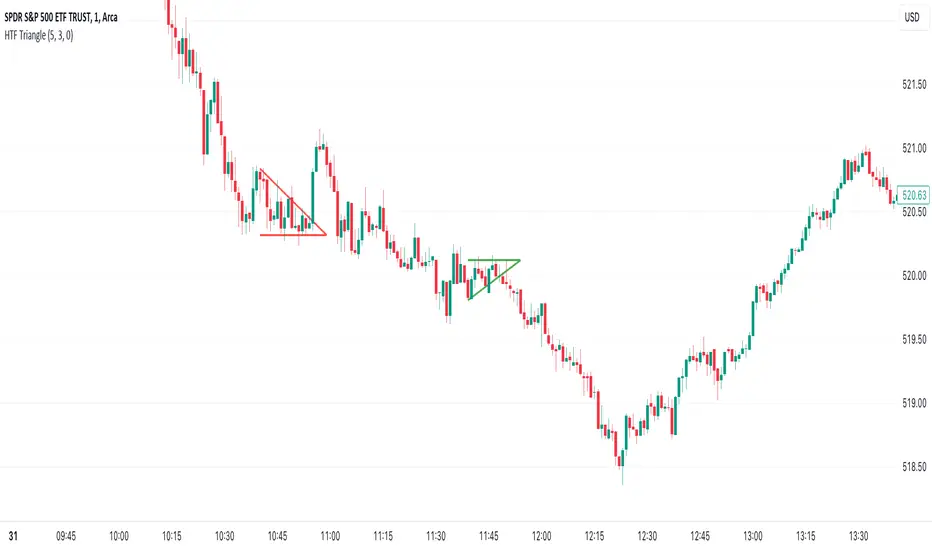
Wedge Polaris is a multi-pattern auto-detector. It identifies five distinct converging-channel pattern families from zigzag pivots — Ascending Triangle, Descending Triangle, Symmetric Wedge, Rising Wedge, Falling Wedge — and on confirmed breakout projects a three-target ladder (Fibonacci times ATR times historical-duration blend). Pattern statistics, breakout probabilities, target hit / miss tracking, completed-pattern history, and a right-side bias gauge are all surfaced on the chart.
What makes it different
Most wedge / triangle indicators detect a single pattern type. This script classifies five families using slope analysis of the top and bottom channels.
Collinearity tolerance is adaptive. It scales with ATR percentile so the script is strict in low-volatility regimes (clean pivots) and forgiving in high-volatility regimes (noisier pivots) without being retuned.
Breakout probability is computed from the standard-normal CDF on the z-scored duration of the current pattern against a rolling history of completed patterns. Class-conditional bull / bear probabilities are blended with net-volume polarity inside the pattern.
A strong-break filter requires the breakout candle's body Z-score to exceed three AND its 25th or 75th body percentile to be on the correct side of the boundary. This distinguishes decisive expansion from noise probes.
A completed-pattern history strip tracks the last ten patterns with their outcomes (Target 1 hit, Stop hit, expired) so you can see the recent quality of the detector on the current instrument.
How it works
Zigzag pivots are tracked via standard ta.pivothigh and ta.pivotlow with parallel arrays.
Collinearity is tested between the two outer pivots and a middle pivot. Tolerance widens in high-volatility environments.
Two collinear lines (one for highs, one for lows) form a channel. Convergence, alignment, and inside-the-channel tests confirm a valid pattern.
Slope analysis classifies the pattern family.
On breakout confirmation, target lines are projected. T1 equals entry plus or minus 0.5 times width. T2 equals entry plus or minus 1.0 times width. T3 equals entry plus or minus (1.618 times width plus atr-z times ATR). SL is symmetric at width times the user SL multiplier.
Each completed pattern's duration and direction is appended to a 200-entry history buffer, which feeds the probability statistics.
Reading the chart
Pattern channels: two lines plus a linefill between them. Line style differentiates pattern type (solid for triangles, dashed for wedges, dotted for channels).
Completed-pattern ghost outlines fade for a user-configurable number of bars after the pattern ends.
A pattern stats label at the channel midpoint reads, for example: WEDGE 23 bars P(bull) 64% P(break) 78% ATR x.xx.
A three-target ladder on confirmed breakout: entry / SL / T1 / T2 / T3 horizontal lines plus price-only right-edge labels (no arrows, no shout text). Linefills shade the risk and reward zones.
Volume confluence: if breakout-bar volume exceeds 1.5 times the 20-bar SMA, target labels append VOL+.
A right-side bias gauge: 21-segment vertical band with a pointer.
Optional right-side breakout-probability gauge (separate from bias gauge).
A completed-pattern history strip above past pattern midpoints.
A strong-break flash: bgcolor pulse on the strong-break bar.
Signals
Pattern formed
Bullish / bearish breakout
Strong bullish / strong bearish breakout
Target 1 / Target 2 / Target 3 hit
Stop loss hit
All gated on barstate.isconfirmed or barstate.ishistory. No future references.
Inputs
Zigzag : zigzag length.
Collinearity : base tolerance (as a fraction of price).
Breakout : SL width multiplier, target line extension bars.
Visual : bullish / bearish colors, bias gauge, breakout probability gauge, pattern stats label, target ladder.
On-chart : completed-pattern history, ghost outlines extension bars, line-style differentiation.
Dashboard : position, size.
How traders use this
Pattern plus volume : a confirmed breakout with the VOL+ tag and a high P(bull) reading is a higher-probability continuation entry.
Mean-reversion fades : when a wedge's third or later touch happens at the convergence apex with low P(break), the pattern often fails to break. Fade trades inside the channel are possible.
R-multiple management : once target 1 prints, common practice is to move stops to breakeven and let the remainder run for T2 / T3. The target ladder makes this straightforward.
Pattern history : the strip lets you assess whether the detector is performing well on the current instrument and timeframe before sizing up new signals.
Limitations
Pivot detection inherits the right-bar delay of ta.pivothigh and ta.pivotlow. Patterns are confirmed only after the pivot-right-window passes.
Collinearity tolerance is a heuristic. Extremely volatile or extremely clean charts may need tuning of the base tolerance.
The class-conditional probability statistics need a minimum sample (five completed patterns) before they are meaningful.
Pattern recognition is fundamentally interpretive. Even confirmed patterns fail.
Compatibility
Pine Script v6 open-source indicator. Imports TradingView/ta/12 for ta.atr2 (series-period ATR used in duration-adaptive target projection). Any symbol, any timeframe. No request.security calls.
Defaults
7-bar zigzag, 0.5 percent base collinearity tolerance, mint / red colors, top-right medium dashboard. For very fast charts shorten the zigzag length. For slow charts lengthen it and tighten the collinearity tolerance.
Wskaźnik