Wskaźnik

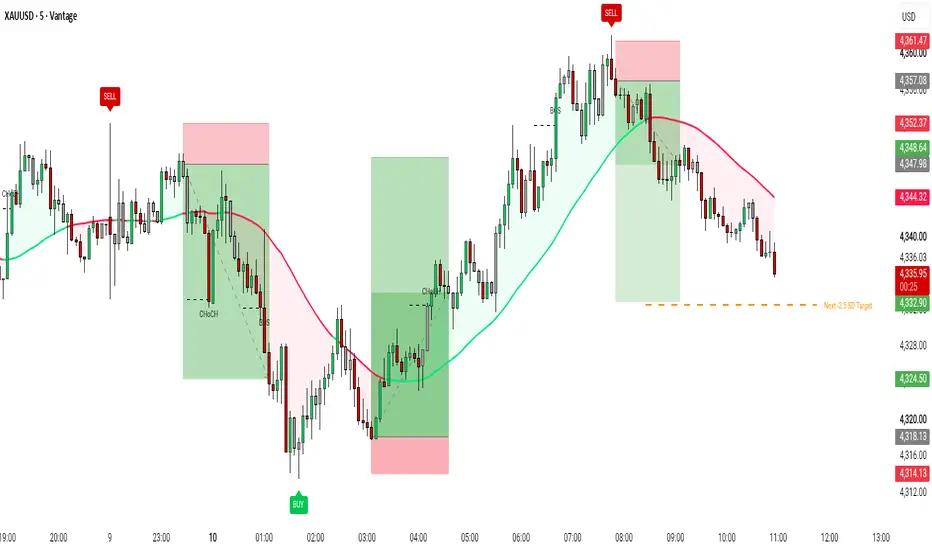
SMC Institutional Clean Wave & Structure PROSMC Institutional Clean Wave & Structure PRO
SMC Institutional Clean Wave & Structure PRO is a refined technical analysis indicator engineered to provide institutional order flow insights, precise market structure tracking, and uncluttered visual clarity on both light and dark trading themes. It replaces unnecessary chart noise with clean dynamic trend wave fills, smart consolidation candle color detection, and confirmed structure shifts.
Key Features Overview
1. Dynamic Single Trend Wave & Background Fill
Provides a smooth continuous structural trend wave. Renders vibrant green during bullish expansion phases and solid red during bearish contraction phases with a soft, unobtrusive background fill.
2. Smart Consolidation Candle Engine
Automatically highlights price action state. Bullish candles render in bright green, bearish candles in red, while tight consolidation or inside bar candles dynamically shift to a distinct grayish-white color to quickly highlight market compression.
3. Clean Market Structure Shifts (BOS & CHoCH)
Tracks key market structure breakouts. Identifies initial trend reversals as Change of Character (CHoCH) and structural extensions as Break of Structure (BOS), rendered with centered non-overlapping labels.
4. Confirmed Major Swing BUY & SELL Badges
Highlights major institutional high and low pivots with confirmed BUY and SELL badges. Pivot sensitivity and badge styling can be customized independently.
5. Target Standard Deviation Level (-2.5 SD)
Calculates real-time structural volatility and projects a dynamic -2.5 Standard Deviation Target line to help anticipate key potential market reaction levels.
Settings Overview
Trend Wave Settings
- Show Trend Wave Line: Toggle wave line and fill display.
- Colors & Opacity: Adjust trend line colors and background opacity.
Candle Engine Settings
- Enable Smart Candle Color Engine: Toggle adaptive candle colors.
- Custom Colors: Define unique colors for bullish, bearish, and inside bars.
Structure Settings
- Show BOS & CHoCH Shifts: Toggle structure labels.
- Structure Sensitivity: Fine-tune pivot detection rules for cleaner charts.
Signal Badges
- Show Confirmed BUY / SELL Badges: Toggle buy and sell markers.
- Signal Swing Sensitivity: Adjust lookback periods for pivot signals.
Standard Deviation Settings
- Show -2.5 SD Target Line: Toggle volatility target line.
- Custom Style: Adjust line thickness, color, and line style options.
Disclaimer
This script is built strictly for educational, analytical, and charting enhancement purposes. It does not offer financial advice or guaranteed trading results. Practice strict risk management.
Wskaźnik

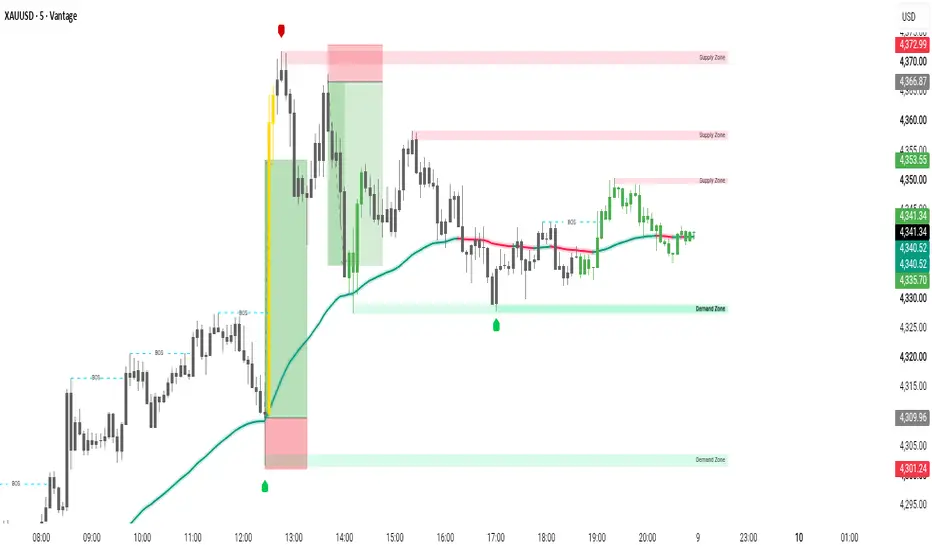
SMC Institutional Execution & Liquidity Matrix PROSMC Institutional Execution & Liquidity Matrix PRO
SMC Institutional Execution & Liquidity Matrix PRO is an advanced, institutional grade technical analysis framework engineered for modern technical traders and quantitative analysts. It provides an intuitive, high definition visual presentation of Smart Money Concepts, dynamic liquidity zones, market structure shifts, and institutional order flow bias without cluttering price action.
Key Features Overview
1. Glowing Trend Wave Engine
Features an ultra smooth dynamic trend wave layer with a soft glow effect. It seamlessly adapts color according to current market momentum, helping traders instantly identify overall dynamic directional bias.
2. Clean Split Line Market Structure
Maps Break of Structure (BOS) and Change of Character (CHoCH) points with extreme precision. The structure line splits neatly in the center with a dedicated gap around the text label, keeping price action clear and uncluttered.
3. Auto Cleaning Institutional Liquidity Zones
Automatically detects Supply and Demand imbalances and key liquidity pools. To maintain visual clarity, mitigated zones automatically adjust and delete themselves as soon as price fills the imbalance.
4. Text Free Major High and Low Badges
Isolates major macro swing high and low extremes using solid colored badges without text clutter. Highlights Intermediate Term High and Low alternatives for instant turning point identification.
5. Smart Candle Heatmap & Displacement Highlights
Dynamically colors price candlesticks based on overall macro trend state, while highlighting high momentum volume displacement expansion candles in a distinct gold color.
How to Use
Step 1: Determine Macro Bias
Observe the Glowing Trend Wave and dynamic candle theme to assess overall institutional trend bias and momentum.
Step 2: Monitor Clean Structure Signals
Look for precise Break of Structure lines and Change of Character signals to identify structural continuity or reversals.
Step 3: Execute in Active Liquidity Zones
Utilize active, unmitigated Supply and Demand boxes for high probability entry and exit locations aligned with order flow.
Settings Overview
Glowing Wave Settings
- Show Glowing Trend Wave: Toggle display of the dynamic trend wave.
- Wave Period & Line Thickness: Adjust wave sensitivity and visual halo glow.
Market Structure Settings
- Show BOS & CHoCH Lines: Toggle market structure signals.
- Customization: Independently adjust line styles, line width, and font size.
Liquidity Zone Settings
- Show Auto Liquidity Zones: Toggle Supply and Demand boxes.
- Zone Fill Transparency: Customize fill opacity from 0 to 100.
Major Swing Settings
- Show Clean Major Swing Badges: Toggle directional pivot badges.
Disclaimer
This script is built strictly for educational, analytical, and charting enhancement purposes. It does not provide financial advice, automated trade signals, or guaranteed results. Always practice strict risk management.
Wskaźnik

Market Correlation Visualizer (Z-Score)Market Correlation Visualizer (Z-Score & % Var)
OVERVIEW
The Market Correlation Visualizer is a multi-asset analysis tool designed for intraday traders and quant analysts. Instead of relying on static correlation tables, this script plots real-time relative performance across up to 8 benchmark assets (Indices, Volatility, Commodities, Bonds, and Crypto) directly on your chart panel.
By standardizing assets through either Z-Score (Standard Deviations) or Percentage Change, you can instantly spot institutional imbalances, intermarket divergences, and statistical overextensions before they manifest on price action alone.
KEY FEATURES
Dual Engine Calculation:
Z-Score Normalization scales price movements based on rolling standard deviation. It identifies when an asset is statistically overbought/oversold relative to its peers.
Daily % Change Anchor normalizes performance from a customizable anchor time (e.g. Daily Open) to track pure percentage strength or weakness throughout the session.
Smart Right-Hand Labels:
Clean, dynamic labels automatically lock onto the right boundary of the indicator panel, displaying the ticker name and exact current reading. No need to memorize line colors.
Statistical Excess Zones (+/- 2.0 SD):
Visual upper and lower threshold bands immediately highlight extreme mean-reversion zones when using Z-Score mode.
Selective Visibility Filters:
Toggle up to 8 custom symbols on or off directly from the settings menu to keep your workspace uncluttered.
Error-Handled Security Fetching:
Built with robust fallback logic to ensure smooth performance across various brokers without breaking the chart panel if a specific ticker fails to load.
HOW TO USE FOR INTRADAY TRADING
Spotting SMT / Intermarket Divergences:
Watch key correlated pairs (e.g. ES vs NQ). If one index makes a new high while the visualizer line on the other fails to confirm, a liquidity sweep or SMT divergence is in play.
Mean-Reversion & Arbitrage:
When an asset crosses outside the +/- 2.0 Standard Deviation band while others remain neutral, it indicates an overextended asset prone to snapping back toward the zero-line.
Volatility Confirmation:
Track VIX against equity futures (ES, NQ). If ES hits a new low but the VIX line fails to push upward, the selling momentum lacks institutional backing.
DEFAULT TICKERS INCLUDED
Asset 1: TVC:VIX (Volatility)
Asset 2: CME_MINI:ES1! (S&P 500)
Asset 3: CME_MINI:NQ1! (Nasdaq 100)
Asset 4: COMEX:GC1! (Gold)
Assets 5 to 8 (Optional): NYMEX:CL1! (Crude Oil), CBOT:ZB1! (30Y Bonds), CME_MINI:RTY1! (Russell 2000), BINANCE:BTCUSDT (Bitcoin).
All inputs can be fully customized in the script settings. Wskaźnik

Khabib Takedown Fractal Nest Breakdown ViprasolKhabib Takedown — Fractal Nest Breakdown 🤼
CONCEPT
This tool looks for SELF-SIMILARITY in a decline: a big bearish leg (lower high -> lower low)
with a smaller bearish leg nested inside it that is a scaled copy — same shape, a fraction of
the size. When the small "fractal" completes in the direction of the big one (a break of the
last low), the structure grounds price -> SHORT. It is a fractal-echo measurement, not a plain
lower-low. The nesting ratio between the small leg and the big leg is the core filter.
HOW IT DETECTS
- Swings are found with confirmed pivot highs/lows (left/right bar lookback) and chained into a
lightweight zigzag.
- The tool reads the last four alternating swings (high, low, high, low).
- Big leg = first high minus first low; small leg = second high minus second low.
- A valid nest requires: lower high and lower low (bearish structure); big leg >= (Min big x ATR);
small leg positive; and the nesting ratio (small/big) inside the band .
- The signal fires when price closes below the most recent swing low and the bar closes red.
- ATR (Wilder) scales the minimum big-leg size across instruments and timeframes.
ENTRY / STOP / TARGET
- Entry: SHORT on the close of the confirming (red) bar that breaks the last low.
- Stop: above the second (inner) swing high plus an ATR buffer (default 0.3 x ATR).
- Target: entry minus R multiple x risk (default 2R, where risk = stop distance).
- The script draws the big leg and the nested small leg, plus filled TP and SL zones that extend
to the right until price touches one of them.
NON-REPAINTING
Pivots are only used once fully confirmed (they require the right-side bars), and the signal is
evaluated on bar close (barstate.isconfirmed). Drawings are created on the confirmed bar. The tool
does not repaint completed signals. Live, the forming bar can still change until it closes, as with
any bar-close tool.
FEATURES
- Fractal nesting (scaled self-similar legs), not a plain lower-low break.
- ATR-scaled minimum big-leg requirement and adjustable nesting-ratio band.
- Automatic R-multiple TP and ATR-buffered SL, drawn as zones that extend until hit.
- One-trade-at-a-time option and a minimum-bars-between-signals gap to reduce clustering.
- On-chart status table (open trades) and an alertcondition for automation.
INPUTS OVERVIEW
- Swing pivot left/right bars: swing sensitivity.
- Nesting ratio band (ratLo/ratHi): how close in scale the small leg must be to the big leg.
- Min big leg (x ATR) and ATR length: minimum move and volatility scaling.
- TP R multiple, SL buffer (x ATR), min bars between signals, one-trade-at-a-time.
- Visual colors, label offset, and zone transparency.
HOW TO USE
1. Add to any liquid symbol and timeframe; start with defaults.
2. Tighten the nesting-ratio band for stricter self-similarity, or widen it for more signals.
3. Raise Min big leg (x ATR) to demand larger, cleaner declines before a nest counts.
4. Use the drawn TP/SL zones for context; set an alert on the signal for hands-off monitoring.
5. Combine with your own trend/context read before acting.
LIMITATIONS
- This is a pattern/education tool, not a signal service, and not financial advice.
- Breakdown patterns fail; nesting geometry is a filter, not a guarantee. Losing signals will occur.
- Pivot confirmation adds inherent lag (it needs bars to the right of a swing to confirm).
- Very choppy or illiquid markets can produce misshapen legs and weak signals.
- Requires user discretion, risk management, and position sizing. No performance is implied.
CREDITS
The name is an inspirational sports homage only; it does not imply any endorsement or affiliation.
ATR uses Wilder's average true range. Pivot/zigzag swing detection uses standard public techniques.
The fractal-nest (scaled self-similar leg) geometry, the detection assembly, and the trade/zone
visualization are original Viprasol work.
Original Viprasol work; no third-party Pine code reused.
Wskaźnik

Ronaldo Bicycle Kick Orbit Break Reversal [ Viprasol ]Ronaldo Bicycle Kick — Orbit Break Reversal (Viprasol)
WHAT IT DOES (the idea)
Most reversal tools watch a single line. This one watches a region. It treats recent price structure as a set of confirmed swing points that "orbit" a structural centre of mass, and it trades the moment price escapes that orbit to the upside. Like a ball coiling around a centre and then leaving orbit — that break is the signal. The name is a sporting homage to a spectacular finish; the tool itself is pure geometry.
HOW IT DETECTS
1. Swings: a lightweight zigzag keeps the last several confirmed pivots. A pivot is only accepted after the required number of bars close to its right, so swings do not move once printed.
2. Orbit geometry: from the last K swings (default 6) it computes the geometric centroid — the mean bar position and mean price. It then measures the average (root-mean-square) distance those swings sit from the centroid price. That distance, scaled by "Orbit radius," becomes the orbit ring. A minimum radius floor (in ATR) filters out flat, meaningless rings.
3. Escape: the setup arms only when the orbit is valid. The signal fires on the first bar that CLOSES above the top of the orbit ring (centroid price + radius) having closed at or below it on the prior bar.
ENTRY / STOP / TARGET
- Entry: the close of the escape bar (long only).
- Stop: the lowest swing price inside the orbit, minus an ATR buffer.
- Target: Entry + R multiple x risk (default 2R), where risk = Entry - Stop.
Each trade draws an entry line plus filled TP and SL zones that extend forward bar by bar until price touches one of them, then freeze.
NON-REPAINTING
Signals are built from confirmed pivots and only evaluated on a confirmed (closed) bar. Nothing is placed on the developing bar, so a printed signal does not disappear or shift on later ticks. The dotted "live orbit" preview is a forward-looking sketch of the current geometry and is not a signal.
KEY FEATURES
- A real orbit ellipse is drawn around the centroid so you can see the ring being broken.
- Extend-until-hit TP/SL zones with a one-trade-at-a-time option.
- Optional hide-new-setup-while-in-trade to reduce clutter.
- Adjustable pivot width, swing count, orbit radius, ATR floor, R multiple, stop buffer, and a minimum-bars-between-signals gap.
INPUTS OVERVIEW
Swing pivot left/right bars; swings used for the orbit; minimum swings for validity; orbit radius multiplier; minimum orbit radius in ATR; ATR length; TP R multiple; SL ATR buffer; signal gap; one-trade toggle; visual colours and label offset.
HOW TO USE
1. Add to any liquid symbol and timeframe; it works on all.
2. Watch for the dotted orbit ring to form around recent structure.
3. Take note when a bar closes above the ring and the GOAL label prints.
4. Use the drawn entry, TP, and SL zones as a visual trade map; adjust the R multiple and stop buffer to your own plan.
5. Raise the pivot width or ATR floor on noisy, low-timeframe charts to demand cleaner structure.
LIMITATIONS (honest)
- This is a pattern and education tool, not a signal service or an autotrading system. It highlights a geometric condition; it does not predict outcomes.
- Long-only by design. It will not flag downside setups.
- In strong one-way trends the orbit ring can be escaped repeatedly; in choppy ranges valid orbits may be sparse. Context and discretion still matter.
- Requiring confirmed pivots means the orbit is defined slightly after a swing forms, which is the cost of non-repainting behaviour.
- Past behaviour of any pattern does not guarantee future results.
CREDITS
Built on public, well-known concepts: Average True Range (J. Welles Wilder) for volatility scaling, and standard pivot/zigzag swing detection. The orbit-centroid geometry and the escape logic are original Viprasol work. The "Bicycle Kick" name is an affectionate sporting homage and does not imply any endorsement or affiliation.
This script is an educational tool and is not financial advice. Trade your own plan and manage risk.
Original Viprasol work; no third-party Pine code reused.
Wskaźnik

Ichimoku Status Panel - Projection and Price TargetsIchimoku Status Panel - Projection and Price Targets
WHAT THIS IS
A read-only status panel for Ichimoku Kinko Hyo. It produces no buy or sell
signals and takes no view on direction. It reports what the chart currently
shows, in a form that is quicker to read than the lines themselves, and leaves
the judgement to the reader.
The panel is aimed at people who already trade with Ichimoku and want the
bookkeeping done for them: which conditions hold, for how long, and what is
already determined about the next few bars.
WHAT IT ADDS OVER A PLAIN ICHIMOKU
1. Projection of the Tenkan-sen and Kijun-sen.
The Tenkan-sen and Kijun-sen are midpoints of rolling high/low windows. That
means the bar on which the current extreme leaves the window is already known,
and so is the value the line will take once it does. The panel reports this as
"in N bars, up/down to X". Unless a new extreme is made in the meantime, that
move is settled in advance. A moving average cannot be read this way, and this
property is generally not surfaced by Ichimoku tools.
2. Chikou Span measured against the cloud, not only against price.
Most implementations compare the Chikou Span with the price 26 periods back
and stop there. Classical treatments also compare it with the cloud that sits
at that same location. A break of the cloud by price that is not confirmed by
the Chikou Span clearing the cloud behind it is a well documented failure
pattern. The panel shows this as a separate row, and calls out when the Chikou
Span is inside the cloud.
3. Counting that matches the original construction.
The original definition displaces by "26 periods including the current one",
which is a 25-bar shift. The script uses this by default and exposes a toggle
for anyone who prefers a plain 26-bar shift, so the reading can be matched to
whichever convention the rest of a workflow uses.
4. Construction from closes only, for indices.
Classical practice takes the intraday high and low, with the note that stock
indices remain valid when built from closes alone. Both are available.
5. Wave price targets, with a validity rule.
V, N, E and NT calculations from the last three alternating swing points, with
the percentage of the move already completed, and an option to hide targets
that price has passed. Consecutive swing points of the same kind are merged
into the more extreme one, so a usable wave is always available rather than
the display stalling whenever two highs or two lows confirm in a row.
More importantly, a wave whose starting point A has been taken out by price is
no longer a valid premise for a target. Pivots confirm several bars late, so
after a breakout the most recent completed wave often still runs against the
market, and every target it produces sits on the wrong side. When this happens
the script falls back to the preceding wave, which by construction runs the
other way, and the panel marks the condition. This keeps the levels on the
side the market is actually working toward.
PANEL ROWS
Bullish count how many of the six conditions currently hold
Price - Tenkan side, plus distance from the Tenkan-sen in percent
Tenkan - Kijun bullish or bearish, and how many bars it has held
Chikou - Price bullish or bearish, and how many bars it has held
Chikou - Kumo above, below, or inside the cloud behind price
Price - Kumo above, below, or inside the current cloud
Kijun slope rising, falling, or flat with a count of flat bars
Proj Tenkan bars until the Tenkan-sen moves, and to what value
Proj Kijun bars until the Kijun-sen moves, and to what value
Kumo twist bars until the next crossing of the leading spans
Bars since bars since the recent high and low, flagged when close to
the classical time numbers 9, 17, 26, 33, 42, 65 and 76
Wave the A, B and C points currently used for the targets,
marked when the preceding wave is in use or when the
starting point has been broken
All panel values are also written to the data window, so past bars can be
inspected by moving the cursor across the chart.
PRICE TARGET FORMULAS
With A as the start of the wave, B as the first objective and C as the
pullback or rally against it:
V = B + (B - C)
N = C + (B - A)
E = B + (B - A)
NT = C + (C - A)
The same four formulas serve both directions. In a down wave A is the starting
high, B the low and C the rally high, which makes the bracketed terms negative
and places the targets below B.
NT is off by default. Classical texts describe it as the rarest of the four,
and leaving all four on tends to produce a level near any price.
ON LAG AND REVISION
Swing points are found with a pivot lookback, so they confirm a number of bars
after the fact, set by "Swing sensitivity". Until a pivot confirms, the most
recent leg is not part of the wave, and the wave used for the targets can
change as new pivots arrive. The target lines move when it does. This is
inherent to identifying waves mechanically and is not hidden: the A, B and C
values in use are always shown in the panel so the reading can be checked.
The six conditions, the projections and the Kumo twist count are all evaluated
on confirmed values and do not revise.
Choosing the wave is a judgement in classical practice, not a calculation. The
automatic detection here is a convenience. Where it disagrees with the wave you
would have drawn, trust your own.
SETTINGS WORTH KNOWING
Wave selection "Latest valid" falls back to the preceding wave when
price takes out the starting point of the latest one.
"Latest only" always uses the most recent wave.
Swing sensitivity larger picks up larger waves, and confirms later
Target line length how far left the target lines are drawn
Panel theme the panel is opaque, so it stays readable on any
chart background; the theme is a preference
Draw the Ichimoku lines
turn this off if you already have the built-in
Ichimoku Cloud on the chart
The time-number flags on the "Bars since" row derive from calendar-based
reasoning in the original theory. They are meaningful on daily charts. On
intraday charts the rest of the panel still applies, but those flags are best
ignored.
CREDIT
Ichimoku Kinko Hyo was developed by Goichi Hosoda. The projection property,
the Chikou Span versus cloud relationship, the inclusive counting convention
and the four price target formulas are all part of the classical body of
theory. The code and the panel design are my own. Wskaźnik

Chronological Elliott Wave Tracker With ProjectionsTired of automated Elliott Wave scripts that plot Wave 5 on a dip or scramble the sequence during consolidation?
Standard zigzag indicators often fail in complex market environments because they hunt for price extremes in a vacuum. They ignore the strict chronological timeline required by Elliott Wave Theory, leading to broken counts and overlapping labels.
This indicator solves that problem by utilizing a Strict Alternating ZigZag Engine. It tracks the actual chronological path of the market (High ➔ Low ➔ High ➔ Low) and anchors the motive (1-5) and corrective (A-B-C) labels exactly where they belong, ensuring a structurally accurate map of the price action.
Key Features
True Chronological Wave Mapping: Forces impulse waves (1, 3, 5) strictly to peaks and corrective waves (2, 4) strictly to dips (in a bullish setup). The internal logic respects the timeline of the chart.
Dynamic Wedge Detection: Automatically scans a macro lookback window to find the absolute structural extremes, drawing a clean, converging wedge pattern based on historical anchors.
Actionable Zones: Automatically generates a shaded Buy Zone (accumulation area based on recent corrective dips) and a Bull Case breakout line for quick invalidation/validation reference.
Adaptive Fibonacci Targets: Projects Wave III (1.618 extension) and Wave IV (0.382 retracement) targets based on the actual detected sub-wave structure, rather than random wicks.
Tick-Safe Memory Management: Built with advanced array cleanup to completely bypass the notorious TradingView "label limit" bug. Your counts will never flicker or disappear on the live tick.
How to Use & Customize
Pivot Sensitivity: The core of the indicator. Lower this number (e.g., 3 to 5) to catch tighter, more frequent waves on higher timeframes (like the Daily chart). Raise it (e.g., 10 to 15) to ignore noise and only map major macro swings.
Bullish vs. Bearish Toggle: By default, the script assumes you are mapping a bullish motive phase (where 1, 3, and 5 are peaks). If you are mapping a downward impulse, simply uncheck the "Bullish Impulse" box in the settings to perfectly invert the structure.
Label Distance (ATR): If the counts are clashing with long candle wicks, adjust the ATR multiplier in the settings to push the labels further away from the price action.
Disclaimer: This script is designed for structural analysis and educational purposes. Automated Elliott Wave counting is highly complex, and this tool is best used as a structural baseline to assist your own manual charting, not as a standalone financial signal. Wskaźnik

Elliott Impulse Engine [WillyAlgoTrader]📊 Elliott Impulse Engine (EIE) is an overlay indicator that counts a full Elliott cycle — impulse 0-1-2-3-4-5 plus correction A-B-C — completely automatically, using a Change-of-Character (CHoCH) trigger to start each count, a strict state machine to accept every wave point, Fibonacci target boxes to show where the next point is expected, a dashed "ghost" projection of the entire remaining path, and a trailing red invalidation line that tells you the exact price where the current count dies.
The core insight: most Elliott Wave tools either repaint their labels endlessly or force you to draw everything by hand. EIE does neither. It treats every count as a hypothesis : a CHoCH break seeds it, each confirmed pivot advances it one wave at a time, and a single hard price level can kill it. When the hypothesis dies, the chart is wiped clean and the engine waits for the next CHoCH — no stale labels, no silent redrawing of history. You always know three things at a glance: what wave the market is in, where price should go next, and where the idea is wrong.
Works on any symbol and any timeframe. Free and open for everyone.
🧩 WHY THESE COMPONENTS WORK TOGETHER
A ZigZag alone gives you swings but no wave logic. A Fibonacci tool alone gives you levels but no structure. A CHoCH detector alone tells you the trend flipped but not what comes next. And a manual Elliott count gives you structure but demands hours of drawing and constant re-labeling.
EIE chains all of these into one pipeline:
Swing structure engine → CHoCH detection → count seeding (point 0 + point 1) → fib grid on leg 0-1 → target boxes for points 2/3/4 → pivot-based point acceptance with soft-marking → ghost projection of the remaining path → trailing invalidation level → reset with a stated reason
The swing engine finds structural highs and lows. A confirmed close through a swing level against the previous trend is a CHoCH — the only event allowed to start a new count, so counts always begin at genuine structure shifts, not random noise. The moment leg 0-1 is confirmed, the engine builds a Fibonacci grid on that leg and projects the whole expected structure forward as a dashed ghost path. Each subsequent wave point is accepted from a separate, faster pivot stream, checked against its expected fib range, and either labeled clean ("2") or soft-marked ("2~") if it landed outside the range. At every state the engine maintains exactly one critical price — the trailing invalidation level — and if price breaks it, the count is declared dead with an explicit reason (BELOW_0, BELOW_W2, W3_SHORTEST, and so on), the markup is wiped, and the engine returns to scanning.
No single public tool does this loop. The combination turns Elliott counting from a subjective drawing exercise into a rule-driven process you can watch unfold bar by bar.
🔍 WHAT MAKES IT ORIGINAL
1️⃣ CHoCH-seeded counting — every count starts at a real structure break.
The engine tracks swing highs and lows using symmetric pivots (default 10 bars left / 10 bars right). A break is registered only on a confirmed bar close through the swing level. If that break goes against the current internal trend, it is a CHoCH — and only then does the engine arm a new count: point 0 is set to the extreme of the run that preceded the break, and the engine waits for a with-trend pivot beyond the CHoCH level to lock point 1.
Anti-noise guards built into the seeding:
— a warm-up gate (no CHoCH before max(3 × swing length, 50) bars of history),
— an optional cooldown (N bars after any count ends before a new CHoCH may seed),
— a level lock: after an invalidation, the same CHoCH level cannot immediately re-seed a new count (compared with half-a-tick tolerance, so floating-point equality can never leak a duplicate seed).
Why this matters: counts started from random pivots produce random labels. Counts started from structure breaks start where trend logic actually changed.
2️⃣ Non-blocking Fibonacci ranges with soft-marking — geometry informs, price decides.
Each wave point has an expected fib range measured on the 0→1 grid (retracement for 2, negative extension beyond point 1 for 3, 5 and B; point 4 uses its own 2→3 grid; C uses 0→1 again):
— Point 2: 0.5 – 0.705 (retracement of 0→1)
— Point 3: −0.5 – −0.618 (extension beyond point 1)
— Point 4: 0.5 – 0.705 (retracement of leg 2→3)
— Point 5: −0.618 – −1.0
— Point B: −0.5 – −0.618
— Point C: 0.0 – 0.236
The fib level of any price p on the 0→1 grid is computed as L = (p1 − p) / (p1 − p0); on the 2→3 grid as F = (p3 − p) / (p3 − p2). A pivot inside its range is labeled clean ("3"); a pivot outside it is still accepted but soft-marked ("3~") — because in real markets a valid wave frequently overshoots textbook levels. Only the hard invalidation rules can reject a point. Every range is a user input (min/max per point), so you can tighten or widen the geometry to your market.
Why this matters: strict-range engines discard perfectly good structure; free-form engines accept garbage. Soft-marking keeps the count honest while telling you visually which points are textbook and which are stretched.
3️⃣ Ghost projection — the whole remaining path drawn before it happens.
As soon as leg 0-1 is confirmed, EIE draws a dashed projection of every remaining point: 2? 3? 4? 5? A? B? C?. Each ghost point is placed inside its fib range at a position you choose (Middle of the range, Near edge, or Far edge), and spaced horizontally at step = round((b1 − b0) × coefficient) bars — i.e., the time geometry of the projection scales with the actual duration of leg 0-1. Ghost point 5? sits at extension −1.0 plus a configurable offset.
The projection is re-anchored from every newly accepted real point : once point 2 locks, the ghost path redraws starting from the real 2; once point 3 locks, from the real 3, and so on. Point 4's ghost is computed on the 2→3 grid using the best available references (real points when confirmed, ghost estimates before that).
Why this matters: you see the expected shape of the entire move — including the A-B-C correction after the impulse — while the impulse is still in wave 2.
4️⃣ Trailing invalidation level — one red line that answers "where am I wrong?".
At every state the engine maintains exactly one critical level, drawn as a dashed red line with an "INVALID + price" label:
— waiting for 1 / wave 2 in progress: point 0
— wave 3 before point 1 is broken: point 0; after the break: point 2
— wave 4: point 2
— wave 5 before point 3 is broken: point 2; after the break: point 4
— correction A/B/C: point 2
A break of this level resets the hypothesis with a named reason. The check runs every bar, before pivot processing , so a violent bar cannot both break the invalidation level and sneak a new wave point into the count on the same bar. Wick-driven pivots that slip past a close-based check are caught by a second, pivot-level guard (a pivot beyond point 2 / point 4 in the protected phases also triggers the reset). Classic Elliott rules are enforced on top: wave 2 may never retrace below point 0, wave 4 may never enter below point 2, and if wave 3 turns out shortest among 1, 3 and 5 at the moment point 5 is proposed, the count is rejected with reason W3_SHORTEST.
Why this matters: an Elliott count without a falsification level is a story, not a hypothesis. EIE makes the falsification price explicit on every bar.
5️⃣ Two-speed pivot system — stable structure, fast confirmation.
Structure and CHoCH run on the main swing length (default 10/10). Wave points 1-5 and A-C are accepted from a separate, shorter pivot stream (default 5/5, always ≤ swing length — validated at load). This decouples two jobs that a single pivot length cannot do well simultaneously: the long pivots keep the structural skeleton stable, the short pivots confirm wave points with roughly half the lag.
A dedicated backfill scan (up to ~480 bars) closes the pivot-lag gap for point 2: when point 1 locks or repositions, the engine re-scans all bars since point 1 for the true retracement extreme, so the best low/high inside the confirmation window is never missed. If price breaks point 1 before any counter-trend pivot confirmed point 2, the tracked extreme itself is accepted as point 2 and wave 3 is activated immediately.
Why this matters: one pivot length forces a trade-off between stability and speed. Two lengths plus a backfill scan give you both.
6️⃣ Repositioning logic — labels refine forward, never silently rewrite history.
Until the next wave locks, the engine allows controlled repositioning: a higher high repositions point 1 (rebuilding the grid and the point-2 box on the new geometry), a deeper pullback repositions point 2 (only until point 1 is broken — after the break, a deeper pivot is an invalidation, not a reposition), point 3 extends while wave 4 forms, point 4 deepens until point 3 is broken, point 5 extends during the correction, A deepens until B appears, B rises until C appears. Every reposition deletes and redraws only the affected segment and label, and the associated target box and its center line are rebuilt on the fresh grid — no stale geometry is left behind.
Why this matters: this is the honest middle ground between "repaints everything" and "freezes wrong labels forever". The rules for what may move, and until when, are fixed and stated.
7️⃣ OTE target boxes for points 2, 3 and 4 — the next objective is always a zone, not a guess.
When point 1 locks, a yellow box covering the point-2 fib range appears with a dashed center line at the range midpoint. When point 2 locks, the point-3 target box (on the extension side) appears. When point 3 locks, the point-4 box appears on the 2→3 grid. Each box extends forward a configurable number of bars (default 20) and its right edge snaps to the bar where the point actually forms. Box fill transparency adapts to the theme (65 dark / 55 light); the border and center line stay fully opaque.
Why this matters: "wave 4 should come" is vague. "Wave 4 is expected inside this drawn box, centered here" is actionable.
8️⃣ Explicit reset reasons + persistent CHoCH history — the chart tells you why.
Every count ends with a machine reason: FALSE_CHOCH (price broke back through point 0 before point 1 formed), BELOW_0, BELOW_W2, BELOW_W4, W3_SHORTEST, DEEP_C (correction retraced beyond point 2), TIMEOUT (optional: state lasted longer than k × leg 0-1 duration), B_ABOVE_5 (the "correction" broke above point 5 — the impulse is closed as done), or DONE (point C accepted, full cycle complete). On invalidation a ✖ marker with the reason in its tooltip is placed on the bar, and the dashboard keeps showing the last reason.
The active markup is wiped on reset — but CHoCH lines and labels live on a separate persistent layer (FIFO history, up to 100, default 50). When price later closes back through a CHoCH level, that line is clipped to the mitigation bar and turns dotted. So your chart accumulates a clean structural map of every trend change while dead counts disappear.
A special same-bar case is handled explicitly: if a reset and a fresh opposite CHoCH land on the same bar (with cooldown off), the engine wipes first, then seeds the new count on that same bar — the new hypothesis is never lost to ordering.
Why this matters: most auto-counters just vanish or redraw without explanation. EIE always states its reason, and the CHoCH map survives as context.
9️⃣ Anti-repaint discipline — confirmed pivots, close-confirmed breaks, honest Wick mode.
Three independent mechanisms:
— All pivot values are consumed only on confirmed bars: a forming real-time bar can make a pivot flicker, so transient pivot values are masked out and can never trigger an irreversible state transition. Historical bars are unaffected (they are all confirmed).
— In the default Close confirmation mode, invalidation breaks and wave-top breaks are evaluated only on the confirmed bar close — an intrabar excursion of the close cannot fire a reset that "un-happens" seconds later.
— The optional Wick mode reacts to any intrabar touch — faster, and by design irreversible within the bar. This is stated openly so you can choose speed vs. strictness.
Zone-entry events (price entering the point-2 OTE zone, the point-4 box, or tagging the −1.0 target) intentionally use wick extremes — a touch is a touch — and are one-way flags.
🔟 Theme-adaptive visual system with auto-contrast labels.
Theme is Auto-detected from the chart background (or forced Dark/Light). By default, long counts use a theme-adaptive green (dark green on light charts, bright green on dark charts) and short counts use red. If you enable custom colors, label text color is derived from the luminance of your chosen background — luma = 0.299R + 0.587G + 0.114B, threshold 140 — so digits stay readable on any shade you pick. The fib grid uses role-based color inputs (red 0.236, teal 0.705 OTE, blue retracement levels, gray round levels), all editable. Label font size is selectable from Tiny to Huge.
⚡ HOW IT WORKS — CALCULATION FLOW
Step 1 — Structure scan: Symmetric pivots (default 10/10) maintain the latest swing high and swing low; the engine also tracks the running extreme since the last swing (the future point 0).
Step 2 — CHoCH: A confirmed close through a swing level against the internal trend flips the trend and — if the engine is idle, cooled down, and the level is not locked — seeds a count: direction, CHoCH level, point 0.
Step 3 — Point 1: The first fast pivot beyond the CHoCH level becomes point 1. The 0→1 fib grid, the point-2 target box, and the full ghost projection are drawn.
Step 4 — Impulse counting: Fast counter-trend pivots propose points 2 and 4; fast with-trend pivots propose 3 and 5. Each is checked against its fib range (clean or "~"), each unlocks the next state, target boxes appear for the next objective, and the ghost path re-anchors from every real point.
Step 5 — Hard rules per bar: Before any pivot is processed, the trailing invalidation level is checked (Close or Wick mode). Wave 2 below point 0, wave 4 below point 2, a broken point 4 in late wave 5, or a shortest wave 3 all kill the count with a named reason.
Step 6 — Impulse complete: Point 5 accepted → the impulse counter increments and the engine rolls into correction tracking.
Step 7 — Correction A-B-C: A forms on a counter-trend pivot, B on a with-trend pivot (a B at or beyond point 5 closes the whole structure as B_ABOVE_5 instead), C completes the cycle → DONE.
Step 8 — Reset: On any ending — invalidation or completion — the active markup is wiped, the cooldown starts, and the engine returns to scanning. CHoCH history stays.
📖 HOW TO USE
🎯 Quick start (works even if you have never counted a wave):
1. Add the indicator to a clean chart. Nothing to configure — defaults are ready to use.
2. Wait for a CHoCH label. That is the engine saying: "the trend character just changed, I am watching for a new impulse here."
3. When labels 0 and 1 appear, the count is live. The dashed gray path with 2? 3? 4? 5? A? B? C? is the expected roadmap of the entire move.
4. Watch the yellow box — that is where the next wave point is expected. The dashed line inside it is the center of the zone.
5. Keep one eye on the red dashed INVALID line at all times. If price breaks it, the count is over — a ✖ appears, the markup clears, and the engine starts hunting for the next CHoCH. Hover the ✖ to read the exact reason.
👁️ Reading the chart:
— 🟢 Green numbered labels (0, 1, 2, 3, 4, 5) = accepted impulse points of a long count; red labels = a short count. Letters A, B, C = the correction.
— A label with ~ (like "2~") = the point is accepted, but it landed outside its textbook fib range — the count continues, treat it with slightly more caution.
— Solid colored path = confirmed structure. Dashed gray path with "?" labels = the ghost projection of what is still expected.
— 🟡 Yellow boxes = target zones for points 2, 3 and 4, each with a dashed center line.
— Dotted horizontal grid = the Fibonacci grid of leg 0-1 (retracements 0.236…1.0 above, extensions −0.5 / −0.618 / −1.0 below), each level labeled with its ratio and price.
— 🔴 Red dashed line + "INVALID price" = the trailing invalidation level of the current count.
— Dashed horizontal CHoCH lines = historical structure breaks; a line that turns dotted has been mitigated (price closed back through it).
— ✖ = the count was invalidated on this bar (reason in the tooltip).
📊 Dashboard fields:
— State: current phase (Scanning / CHoCH · wait 1 / Wave 2…5 / Corr · A-B-C).
— Direction: Long, Short, or — when idle.
— Invalidation: the current critical price.
— Last Reset: why the previous count ended (reason, DONE, or B_ABOVE_5). Resets on chart reload.
— Impulses: completed 5-wave impulses on the loaded history. Resets on chart reload.
— TF: chart timeframe. Version: engine version.
🔧 Tuning guide:
— Counts appear too rarely: lower Swing Detection Length (structure forms faster, more CHoCH seeds) — or the market is simply ranging without character changes.
— Too many counts die instantly (FALSE_CHOCH / BELOW_0): raise Swing Detection Length, or add a Cooldown of 5-20 bars so the engine skips the chop right after a failed count.
— Points confirm too slowly: lower Point Confirmation (min 1); remember it must stay ≤ Swing Detection Length.
— Too many "~" soft marks: widen the fib ranges for those points — your market may simply run hotter than the defaults.
— Old counts hang around in dead phases: set Timeout k > 0 (e.g. 3.0) — any state lasting longer than k × the duration of leg 0-1 resets automatically.
— Chart feels crowded: toggle off the Fib Grid, OTE Boxes, or the Projection independently; reduce Historical CHoCH; shrink label font size.
⚙️ KEY SETTINGS
⚙️ Main Settings:
— Swing Detection Length (default 10): pivot length for structure and CHoCH. Higher = larger structure, fewer seeds.
— Point Confirmation, bars (default 5): the separate short pivot used to accept wave points. Must be ≤ swing length (validated).
— Breaks: Invalidation Mode (default Close): Close = confirmed bar close beyond the level (non-repainting); Wick = any intrabar touch (instant, irreversible within the bar).
📐 Point Ranges (fib): min/max expectation range per point — Point 2 (0.5–0.705), Point 3 (−0.5…−0.618), Point 4 (0.5–0.705 on the 2→3 grid), Point 5 (−0.618…−1.0), Point B (−0.5…−0.618), Point C (0–0.236). All validated at load (2 and 4 must be inside (0,1); 3, 5, B must be negative; C inside [0,1); no zero-width ranges).
👻 Ghost Projection:
— Show Projection (on), Point Inside Range (Middle / Near / Far), Time Step Coef (default 1.0 × leg 0-1 duration), 5?: Offset From −1.0 (default 0.05).
♻️ Reset:
— Cooldown After Reset, bars (default 0 = off) and Timeout, k × leg 0-1 (default 0 = off; in the wait-for-1 phase the timeout scales on swing length instead, since no leg exists yet).
🎨 Visual Settings: Theme (Auto / Dark / Light), Fib Grid toggle, OTE Boxes toggle, CHoCH layer toggle, Path Width (2), Box Length Forward (20), Historical CHoCH max (50), Label Font Size (Tiny…Huge), Watermark toggle.
📏 Grid Levels: individual on/off for 0.236, 0.382, 0.5, 0.618, 0.705, 0.786, 0.886, 1.0, −0.5, −0.618, −1.0.
🎨 Colors: Use Custom Colors switch (off = theme-adaptive defaults), long/short point label backgrounds (text auto-contrasts), target box color, path and ghost colors, bull/bear CHoCH colors, and role-based fib grid colors.
📊 Dashboard: on/off, position (5 anchors), font size (the version row renders one step smaller).
🔔 ALERTS
Ten alert conditions covering the full lifecycle:
— 🟢 1. CHoCH + projection — CHoCH confirmed, movement projection built
— 🟡 2. Price in W2 OTE — price entered the point-2 zone
— 🟢 3. Point 2 accepted
— 🟢 4. Break of point 1 — wave 3 active
— 🟡 5. Price in W4 box
— 🟢 6. Break of point 3 — wave 5 active
— 🎯 7. Target −1.0 reached
— 🟢 8. Impulse complete — point 5 locked
— 🎯 9. Target C — correction complete, full cycle done
— 🔴 10. Invalidation — hypothesis reset
In addition, the engine fires dynamic alert() messages on every reset and on B_ABOVE_5 completion, including the reason text. In Close mode these announce on confirmed bar close; in Wick mode once per bar.
⚠️ IMPORTANT NOTES
— 🚫 No repainting of confirmed structure. Pivots use equal left/right lookback and their values are consumed only on confirmed bars; CHoCH breaks require a confirmed close; in the default Close mode, invalidation and wave-top breaks are evaluated on confirmed closes only. A pivot is, by nature, confirmed N bars after the actual extreme — the indicator draws from the confirmed bar backward to the true swing point. This is delayed confirmation, not repainting of settled values.
— 📐 Controlled repositioning is part of the design. Until the next wave locks, the latest point may legitimately move to a more extreme pivot (e.g., point 1 to a higher high). The rules for what may move, and until when, are fixed and described above. Wick mode reacts intrabar by design and is irreversible within the bar.
— 📊 The Impulses counter and Last Reset field are computed on loaded chart history and reset when the chart reloads.
— ⚖️ EIE counts one impulse degree at a time from the latest CHoCH. It does not label nested sub-waves, diagonals, or complex W-X-Y corrections — it is a focused impulse + zigzag engine, and the fib ranges reflect one practical interpretation of Elliott guidelines, which you can re-tune.
— 🛠️ This is a wave-counting and projection tool, not an automated trading system. It identifies structure, projects expected zones, and shows the invalidation price — trade decisions remain yours.
— 🌐 Works on all markets (crypto, forex, stocks, indices, commodities) and all timeframes. Wskaźnik

Leg Anatomy - Measured Retracement and ExtensionEvery trader draws the same three numbers on every chart: 38.2, 50 and 61.8. Those numbers were not derived from this market, this timeframe, or this instrument. They were not derived from any market. They are a convention that spread because it spread.
This script measures the real thing instead.
WHAT IT MEASURES
Price is broken into confirmed swing legs. A running extreme is tracked, and when price closes back from that extreme by more than a configurable multiple of ATR, the extreme is confirmed as a swing and a new leg begins.
Every completed leg is measured as a ratio of the leg immediately before it. A leg that travelled 60 percent of the previous leg records 0.60. A leg that went 140 percent past it records 1.40. That single number, the leg-to-leg ratio, is the entire dataset.
From the last N legs on the chart you have open, the panel reports:
The median leg, expressed as a multiple of the one before it.
The interquartile range, the middle half of the distribution.
The share of legs that were shallow, under 0.62.
The share that were deep, between 0.62 and 1.00.
The share that were extensions, past 1.00.
On some symbols and timeframes the conventional levels sit close to the measured centre. On many they do not, and the gap between what a chart actually does and what the convention assumes is visible in one row of the panel.
THE PROJECTION
The distribution is not left as a table. It is applied forward.
The leg currently forming starts from the last confirmed swing, and the leg before it has a known size. Multiplying that size by the measured median, upper quartile and ninetieth percentile gives three projected endpoints, drawn as a shaded zone in front of price with a dashed median line and a price label.
The panel shows how far the forming leg has travelled as a percentage of its median expectation. Below 100 percent the leg is still inside its normal range. Above it, the leg has already outrun the typical case for this chart, which is information whether you are holding it or fading it.
The zone is not a forecast. It is where the middle of the distribution sits, and roughly half of past legs fell short of it.
THE SKELETON
Confirmed legs are drawn as a thick zigzag across the chart, each one labelled with its own ratio, so the distribution in the panel can be read directly off the price action that produced it. Candles are tinted by the direction of the leg currently forming.
Because swings only confirm on closed bars and a confirmed swing is never revisited, the skeleton behind price is final. Only the leg at the right edge is still forming, and the projection zone updates only when a new leg is confirmed.
SETUPS
When a swing confirms, a new leg begins, and the script produces a complete setup at that close.
The stop sits just beyond the swing that was just confirmed, plus an ATR buffer. That swing is the level the leg depends on. If it goes, the leg reading was wrong.
The three targets are the lower quartile, the median and the upper quartile of the measured distribution, projected from the swing. They are not multiples of risk and they are not conventional ratios. They are the shape of this chart's own legs.
Only one setup is tracked at a time. The panel records whether the first target or the stop was reached first, and prints collecting until the sample is large enough to mean anything. That number measures one mechanical rule and is not a backtest.
SETTINGS
Reversal Threshold is the only structural dial. It decides what counts as a leg. A low value produces many small legs and a distribution dominated by noise. A high value produces few large legs and a distribution with a small sample. The default sits between the two, and changing it changes the entire analysis, which is the point: a leg on a scalping horizon is not a leg on a swing horizon, and the measured distribution should differ between them.
Volatility Length sets the ATR lookback used for the reversal threshold and the stop buffer.
Legs Kept In Sample bounds the history, so the distribution tracks the current regime instead of averaging in a market from years ago.
REPAINTING
Swing confirmation, leg measurement, the distribution, setups and alerts all evaluate on confirmed bars. A confirmed swing is never moved and a drawn leg is never redrawn. The projection zone in front of price is recomputed only when a new leg begins. The script requests no higher timeframe data.
HOW TO READ IT
Start with the three share rows. If a chart shows most of its legs under 0.62, it is a market that retraces shallowly and continuation is the base case. If most legs sit between 0.62 and 1.00, it is a market that gives deep pullbacks and entering early is expensive. A high share above 1.00 is a trending regime where each leg outruns the last.
Then look at the forming leg's progress. A leg at 40 percent of median with a distribution that favours extension is a different situation from a leg at 130 percent in a market that rarely extends.
The ratios printed on the skeleton let you check the panel against your own eyes rather than trusting it.
This is an analysis tool, not financial advice, and not a trading system. A measured distribution describes what happened, not what will. Sample sizes are small by the standards of statistics and regimes change. Use it with your own risk management and position sizing. Wskaźnik

Fractal ZigZag with Retest & Filters By WiselyWealthIndicator ; Fractal ZigZag with Retest & Filters
Introduction
Welcome to the comprehensive guide for the 'Fractal ZigZag with Retest & Filters' indicator. This custom-built Pine Script indicator is an advanced technical analysis tool designed explicitly for the TradingView platform. At its core, the primary objective of this script is to provide traders with high-probability entry signals by systematically filtering out market noise, avoiding false breakouts, and ensuring alignment with the overarching macroeconomic trend.
Many retail traders fall into the trap of entering positions during sudden, volatile price spikes, only to suffer heavy drawdowns when the market naturally pulls back. This script mitigates that risk by enforcing a strict, rules-based approach: identifying structural shifts, confirming the initial breakout, and mathematically demanding a pullback (or "retest") before issuing a final trading signal. Additionally, it features built-in alert conditions, making it perfectly suited for algorithmic traders who wish to automate their strategies via Webhooks, Telegram bots, or MT5 API integrations.
Technical Mechanism
The mechanical operation of this script is multi-layered, relying on a confluence of structural mapping, trend filtering, and volatility-based retest calculations. Here is a detailed, step-by-step technical breakdown of how the script detects and generates its buy and sell signals:
Mapping Market Structure with Williams Fractals:The foundation of the script relies on identifying key swing highs and swing lows using Williams Fractals. By default, the indicator evaluates a 5-bar lookback and look-forward period to pinpoint these structural pivots. Once a valid upward or downward fractal is identified, the script connects them using a dynamic ZigZag line. This creates an unambiguous visual map of the market's underlying structure, cleanly displaying the sequence of higher highs or lower lows.
Initial Breakout Identification: The indicator actively monitors the current closing price in relation to the most recently confirmed fractal levels. A raw bullish breakout is registered the moment a candle closes definitively above the last established fractal high. Conversely, a raw bearish breakout is noted when the closing price drops below the most recent fractal low. To prevent redundant alerts, the script locks the current trend state upon a successful breakout.
The ATR-Based Retest Engine: This is the most sophisticated aspect of the indicator. When "Enable Retest Mode" is activated, the script refuses to issue an immediate entry signal at the exact moment of the breakout. Instead, it uses the Average True Range (ATR) over a 14-period lookback to measure current market volatility. For a bullish setup, it calculates a "Retest Target" by subtracting a user-defined ATR multiplier (default 1.0) from the breakout close price. It then starts a countdown timer, allowing a maximum number of candles (default 3) for the price to drop back down and touch this target. If the pullback is successful within the time limit, the raw buy signal is triggered. If the time expires without a retest, the setup is safely invalidated.
Macro Trend Filtering: Before finalizing any signal, the script consults a 200-period Exponential Moving Average (EMA). If the trend filter is enabled, a buy signal is entirely suppressed unless the closing price is strictly above the EMA200. Sell signals similarly require the price to remain below the EMA200. Users can also force the script into a "Buy Only" or "Sell Only" mode to align with their long-term directional bias.
How to Use and Best Practices
To extract maximum profitability and accuracy from this script, traders must apply the correct settings and deploy it in appropriate market environments.
Recommended Settings and Configuration:
Conservative Swing Trading: Ensure the EMA200 Trend Filter remains enabled to keep you on the side of institutional momentum. You may also want to increase the Fractal Periods from 5 to 7 or 9. This filters out minor price fluctuations and forces the script to base its breakouts on major structural swing points.
Retest Calibration for Volatility:** The default ATR multiplier is 1.0, and the wait limit is 3 candles. If you are trading on lower timeframes (e.g., 5-minute or 15-minute charts), breakouts can take slightly longer to retest. Consider increasing the "Max Candles to wait" to 5 or 6. For highly volatile assets, increasing the ATR Multiplier to 1.5 can help you secure a deeper, more favorable pullback entry.
Directional Lock: If higher timeframe analysis dictates a strong bull market, use the "Trade Direction" setting to restrict signals to "Buy Only," eliminating counter-trend noise during minor market corrections.
Suitable Markets and Timeframes:
Forex and Indices: This indicator performs exceptionally well on major Forex pairs (EUR/USD, GBP/JPY) and Global Indices (US30, NAS100) on the 1-Hour and 4-Hour timeframes. These assets heavily respect market structure, and liquidity grabs (retests) are highly common after structural breakouts.
Cryptocurrency: Bitcoin and Ethereum on the 15-minute to 1-Hour charts are excellent candidates, provided you adjust the ATR multiplier to account for crypto's volatile, whipsaw movements.
Markets to Avoid: Avoid using this script in heavily consolidated, range-bound, or sideways markets. Breakout and trend-continuation logic inherently struggles during prolonged periods of low volatility, where price chops indiscriminately around the 200 EMA without clear directional follow-through. Wskaźnik

TL Elliott Wave Pro - Rule Checked 12345 ABC Count + Fibs + FVGTL ELLIOTT WAVE PRO — the complete Elliott Wave rule set in one indicator: the count, the three golden rules, the three guidelines, all four fibonacci tools and the fair value gap that turns a level into a trade.
Elliott Wave is usually taught as a picture and traded as a feeling. This indicator turns it into something you can actually check: it labels the impulse, it tells you which of the three golden rules currently hold, it measures every wave against the fibonacci relationships the theory is built on, and the moment a rule breaks it says so instead of quietly redrawing the count into something that still looks right.
Everything below comes from the classic rule set. Nothing is invented, nothing is hidden.
━━━ ① THE WAVE COUNT ━━━
A ZigZag builds the alternating pivot sequence, and the engine reads the most recent structure the rules allow:
· ①②③④⑤ — the five wave impulse: three impulses with the trend, two corrections against it
· ⒶⒷⒸ — the correction that follows: an impulse down, a correction up, an impulse down
Impulse legs are drawn SOLID, corrective legs DASHED. That is not decoration — it is the definition the whole model rests on: impulsive waves are larger and move with the trend, corrective waves are smaller and move against it. The wave that has not happened yet is projected as a dotted gold line straight to its first fibonacci target.
Finished counts are frozen in faded gold exactly where they were found, so you can scroll back through the chart and study how the reading developed instead of only seeing today's answer.
━━━ ② THE THREE GOLDEN RULES — a hard validity gate ━━━
❶ Wave 3 must be the longest impulse wave, and it can never be the shortest
❷ Wave 2 must not surpass the start of wave 1
❸ Wave 4 cannot overlap with wave 1's price territory
Each rule gets a live ✓ / ✗ in the panel. If one of them breaks the count is not "weaker" — it is invalid, and the indicator behaves accordingly: the setup is cancelled, a COUNT INVALID tag goes on the chart with the reason, an alert fires, and the next confirmed pivot starts a fresh count. Rule 1 has a strict and a relaxed reading, switchable in the settings.
━━━ ③ THE THREE GUIDELINES — a soft quality score ━━━
❶ When wave 3 extends as the longest impulse wave, wave 5 typically approximates the length of wave 1
❷ Wave 2 and wave 4 alternate between a flat and a sharp correction — the indicator classifies each correction by depth and duration and shows you the pair, e.g. S / F
❸ After a five wave impulse advance, ABC corrections commonly end near the prior extreme of wave 4 — that level is projected as the C target
Guidelines are informational by default, because that is what they are. You can require one, two or all three before a signal is allowed to fire.
━━━ ④ THE FOUR FIBONACCI TOOLS, WITH THEIR CORRECT ANCHORS ━━━
Wave 2 retracement — 0 % at the end of wave 1, 100 % at its start
· typical 50.0 % and 61.8 %, plus the 60 % average line
Wave 3 extension of wave 1 — projected from the wave 2 extreme
· typical 161.8 % and 261.8 %
Wave 4 retracement — 0 % at the end of wave 3, 100 % at its start
· typical 23.6 %, 38.2 % and 50.0 %, plus the 30–40 % average band
Wave 5 — two separate targets
· 100 % of wave 1 projected from the wave 4 extreme
· 161.8 % of wave 4, anchored 0 % at the wave 4 extreme and 100 % at the wave 3 extreme
The level the market actually turned at is highlighted in gold, and the panel prints the measured value next to the expected one, so you can see at a glance whether this count is textbook or stretched.
━━━ ⑤ +FVG — the confluence that makes it a trade ━━━
A fibonacci zone on its own is a level. A fair value gap sitting inside that zone is a reason. The indicator scans for unfilled three-candle gaps inside the wave 2 and the wave 4 retracement zone, draws them as a +FVG box, and marks the signal accordingly. You can leave it as a quality tag or make it mandatory.
━━━ ⑥ THE TRADES — always in the direction of the impulse ━━━
Trading in the direction of the impulse waves is what pays, so that is all this indicator signals:
WAVE 3 ENTRY — buy the wave 2 correction in an uptrend, sell it in a downtrend
· stop behind the wave 2 pivot, or at the rule 2 invalidation
· TP1 161.8 % of wave 1, TP2 261.8 % of wave 1
WAVE 5 ENTRY — buy the wave 4 correction, sell it in a downtrend
· stop behind the wave 4 pivot, or at the rule 3 invalidation
· TP1 wave 5 = wave 1, TP2 161.8 % of wave 4
Three trigger models per trade: momentum close out of the zone, zone tap for limit-style entries, or a break of the last minor swing for the latest and safest fill. Minimum reward/risk filter, ATR stop buffer, break even at a chosen R. The counter-trend ABC entry exists but is OFF by default, on purpose.
━━━ WHY EVERY SIGNAL EXPLAINS ITSELF ━━━
Hover any signal pill and you get the full reasoning: the exact count with its prices, which golden rules hold, how deep the correction actually went against the typical values, which guidelines are satisfied, whether a fair value gap was inside the zone, plus entry, stop, both targets, risk in pips, reward in pips and the R multiple.
Every wave label carries its own tooltip — what that wave is, how far it travelled, which rule it has to respect and whether it does. Every fibonacci line explains its anchoring. Setups that were found and then rejected get a NO TRADE tag with the reason, so you learn the filter instead of wondering why nothing fired. There is a HOW TO READ THIS card and an honest BEFORE YOU TRADE THIS card on the chart.
━━━ COCKPIT PANEL ━━━
Live count stage, symbol, chart timeframe, ZigZag settings and the size of wave 1 · the three golden rules with ✓ / ✗ / pending · the three guidelines with the flat-sharp alternation pair · every wave measured against its expected fibonacci value · a five step setup checklist that fills in as the trade builds · the open position with stop and target · a large status line · a rough win / loss / break-even tracker and the last signal timestamp.
━━━ ALERTS AND AUTOMATION ━━━
Every event fires a clean JSON payload ready for a webhook: entry, stop, both targets, the direction of the count, the measured wave 2 retracement, the wave 3 extension, the wave 4 retracement, which rules held, whether an FVG was present, the R multiple, symbol, exchange, timeframe, volume and an optional account field. Events: ENTRY, TP1, SL, BE, INVALID, IMPULSE_COMPLETE. Six plain-language alertconditions are included as well for anybody who just wants a notification.
━━━ SETTINGS WORTH KNOWING ━━━
· ZigZag pivot strength and a minimum swing size in ATR — this pair decides the degree of the count and therefore everything else
· Every fibonacci percentage is editable
· Rule 1 strict or relaxed, rules 2 and 3 on or off, kill-on-invalidation on or off
· FVG optional or mandatory, minimum gap size in ATR
· Full TL chart theme: navy background, mint / red candles, corrective legs dimmed — or switch it off and keep your own
· Panel, animated 3D logo and the right-hand extension of the lines are all configurable
Tip: if the candles cover the panel, right click the indicator → Visual order → Bring to front. That is a TradingView layer setting, not something Pine can control.
━━━ HONEST NOTES ━━━
Elliott Wave is not a standalone technique, and its subjective nature has put a lot of traders off it. Two competent analysts label the same chart differently. This indicator picks ONE reading — the most recent one the three golden rules allow — and tells you the moment that reading dies. It does not pretend the ambiguity is gone.
The count re-reads itself on every new pivot. A label that moves is not a bug; it is the engine refusing to defend a count the market has stopped supporting.
The ZigZag pivot strength decides everything. Too small and you count noise, too large and you only see the count after the move is over. Change it and watch the whole picture change — that is the honest lesson of Elliott Wave, and no indicator can take it away from you.
The percentages are averages, not laws. Corrections come in slightly smaller and slightly larger than the textbook numbers all the time.
The win / loss counter in the panel is a rough on-chart tracker. It assumes a fill at the marked price and resolves target before stop inside the same bar. It is not a backtest and it is not a performance claim.
This indicator is a study tool. It is not financial advice.
━━━ CREDIT ━━━
The rule set is classic Elliott Wave Theory as it is taught publicly. The wave engine, the rule and guideline checks, the fibonacci anchoring, the FVG confluence, the panel and the design are original work.
Open source — read it, change it, learn from it.
Wskaźnik

WaveScope WaveScope is a market structure indicator designed to identify confirmed swing highs and lows, classify them as Higher High (HH), Higher Low (HL), Lower High (LH), or Lower Low (LL), and automatically detect the structural events Break of Structure (BOS) and Change of Character (CHoCH).
Rather than focusing on individual price swings, the algorithm builds a continuous sequence of confirmed structural points using Pivot High and Pivot Low detection. This sequence serves as the foundation for all structural calculations performed by the indicator.
━━━━━━━━━━━━━━━━━━━━━━━━━━━━━━━━━━━━
📖 Overview
Most market structure indicators simply connect confirmed pivots.
During strong directional moves this often creates either excessive structural noise or delays the representation of the current market movement until the next pivot has been confirmed.
WaveScope was designed around a different idea.
Instead of treating each pivot as an isolated event, the indicator continuously maintains the latest structural swing.
Until an opposite pivot is confirmed, the most recent structural point can be replaced whenever price creates a stronger extreme of the same type.
At the same time, the developing swing is displayed independently from the confirmed structure and is updated in real time.
This allows traders to observe:
• confirmed market structure;
• the current developing swing;
• BOS and CHoCH events;
• the current structural state through the information panel.
━━━━━━━━━━━━━━━━━━━━━━━━━━━━━━━━━━━━
⚙️ How It Works
WaveScope uses symmetrical Pivot High and Pivot Low detection with configurable sensitivity.
Every confirmed pivot is compared with the previous confirmed pivot of the same type.
The result determines whether the new structural point is classified as:
• Higher High (HH)
• Higher Low (HL)
• Lower High (LH)
• Lower Low (LL)
Rather than measuring absolute price movement, the indicator evaluates the relative position of consecutive highs and lows, allowing the market structure to evolve naturally as new pivots are confirmed.
If price forms a stronger extreme before an opposite pivot appears, the existing structural point is updated instead of creating an additional swing.
This approach keeps the structure consistent during fast impulsive movements while reducing unnecessary structural clutter.
WaveScope also includes dedicated Double Pivot Resolution logic to correctly process situations where both Pivot High and Pivot Low are confirmed simultaneously.
━━━━━━━━━━━━━━━━━━━━━━━━━━━━━━━━━━━━
🔄 BOS & CHoCH Detection
Once market structure has been established, the latest confirmed highs and lows become active structural reference levels.
A breakout that occurs in the direction of the existing structure is classified as Break of Structure (BOS).
A breakout against the current structural direction is classified as Change of Character (CHoCH).
Breakouts can be confirmed using either:
• candle close;
• candle wick.
This provides additional flexibility for different analytical approaches and varying market conditions.
━━━━━━━━━━━━━━━━━━━━━━━━━━━━━━━━━━━━
📈 Developing Structure
Alongside confirmed swings, WaveScope visualizes the developing market structure.
A dynamic dashed line extends from the latest confirmed structural point to the current developing high or low.
This line is updated continuously with each new candle and becomes part of the confirmed structure only after the next pivot has been validated.
By separating confirmed and developing structure, the indicator allows traders to monitor ongoing price development without modifying historical structural information.
━━━━━━━━━━━━━━━━━━━━━━━━━━━━━━━━━━━━
🖥️ Information Panel
An optional information panel provides a concise summary of the current structural state, including:
• current market structure direction;
• latest confirmed structural point;
• latest BOS or CHoCH event.
The panel is designed to provide structural context without requiring the entire swing sequence to be reviewed.
━━━━━━━━━━━━━━━━━━━━━━━━━━━━━━━━━━━━
🎛️ Settings
Structure
• Pivot sensitivity
• Maximum displayed swings
• HH / HL / LH / LL labels
• BOS & CHoCH visualization
• Breakout confirmation method
• Maximum displayed structural events
Visuals
• Structure lines
• Glow effect
• Line width
• Label size
• Label offset
• Color customization
Information Panel
• Enable / disable
• Panel position
━━━━━━━━━━━━━━━━━━━━━━━━━━━━━━━━━━━━
✨ Core Features
WaveScope is built around a single market structure engine.
The HH / HL / LH / LL sequence serves as the foundation for all subsequent calculations.
The same structural model is used for BOS detection, CHoCH detection, developing structure visualization, and the information panel.
Key implementation features include:
• automatic replacement of stronger same-type swings;
• Double Pivot Resolution;
• independent visualization of confirmed and developing structure;
• automatic BOS and CHoCH classification;
• controlled chart object management for improved performance.
━━━━━━━━━━━━━━━━━━━━━━━━━━━━━━━━━━━━
📌 Notes
WaveScope relies on confirmed Pivot High and Pivot Low formations.
As a result, new structural points appear only after the corresponding pivot has been confirmed.
The confirmation delay depends on the selected pivot sensitivity and is an inherent characteristic of confirmation-based market structure analysis.
This approach prioritizes structural consistency by relying on confirmed market data instead of preliminary estimates.
The developing structure visualization partially compensates for this characteristic by displaying the ongoing structural progression before confirmation.
━━━━━━━━━━━━━━━━━━━━━━━━━━━━━━━━━━━━
📚 Usage Notes
Lower pivot sensitivity produces a more detailed market structure with a larger number of local swings.
Higher sensitivity filters smaller market fluctuations and emphasizes broader structural trends.
The HH / HL sequence represents bullish market structure, while LH / LL represents bearish market structure.
BOS identifies structural continuation, whereas CHoCH identifies structural transitions against the prevailing market direction.
WaveScope can be applied across different markets and timeframes by adjusting pivot sensitivity to match the desired structural scale. Wskaźnik

EWCore Automated Elliott Wave Counting & LabelingEWCore — Automated Elliott Wave Counting & Labeling
EWCore reads price structure as Elliott Waves and puts a complete, labelled count on the chart: the wave sequence it considers most likely, ranked alternatives, the level at which the count would be void, and where the current leg projects to.
It is one of three scripts published together. EWCoreLib is the library holding the pattern evaluation logic; EWCore pulls it in itself, so there is nothing for you to install. EWCore Docs is an optional on-chart panel with the full feature and settings reference . You only need to add EWCore to your chart.
What makes it different
Most wave tools label a zigzag and stop. The work here went into the parts that usually get skipped:
It abstains. When a leg cannot be resolved with the data available, EWCore marks it as unresolved instead of inventing a subdivision. An honest gap is more useful than a confident guess.
It shows its competition. A count is a hypothesis, and there is rarely only one. The score table lists the alternatives with their scores, and a Why column names the criterion that put each row where it is — including the cases where a lower-scoring count legitimately outranks a higher-scoring one.
It checks structure, not just shape. A leg claiming to be motive is re-examined one degree down to see whether it actually subdivides into five. Amplitude alone cannot tell wave four from noise; only pattern context can.
It covers the whole chart, not just the last swing. A best-path search connects earlier patterns into a continuous chain running into the current count, and projects the continuation after it.
Detection
Swing pivots are found with an ATR-scaled threshold that adapts to the timeframe, so the same sensitivity setting behaves consistently from M15 to monthly. A spike-robust variant of that threshold keeps a single news candle from inflating the yardstick for the bars that follow — and it can calibrate its own scale from the chart's recent history rather than using one fixed number everywhere.
On top of the primary pivots, a compressed ladder is built level by level, letting the script find counts one or more degrees higher, whose legs span many primary pivots.
Detection with 3 compression levels.
detection with 1 compression level.
Pattern evaluation
Every candidate window is tested against the pattern library — impulse, leading and ending diagonal, zigzag, flat, triangle, and the WXY/WXYXZ combinations — each with its own hard-rule set. Wave two may not retrace past the start of wave one, wave three is never the shortest, wave four does not overlap wave one in an impulse, wave C of a zigzag or flat must itself be a five.
Marginal violations are penalised rather than rejected: a candidate that misses a rule by a hair loses score and stays visible for comparison, up to a capped malus.
When impulse, diagonal and triangle all pass on the same window, a discriminator arbitrates by type-separating features, so the loosest-ruled pattern cannot win by default. Counts that begin at a genuine turning point are preferred over ones starting mid-move, and each candidate is weighed against the structure on the timeframe above as a soft context gate.
Surviving candidates are scored on a blend of Fibonacci conformity, alternation, equality, time and momentum, with every weight individually adjustable. Along a chain, proper motive/corrective alternation is rewarded and runs of same-class patterns are penalised, favouring readings that express a stretch of price as impulse-plus- correction rather than a string of disconnected fragments.
Where a motive leg carries the internal sub-pivot count an extension would imply, EWCore verifies the extension structurally instead of assuming it from the count, and requires it to out-score the plain five-wave reading by a configurable margin.
On the chart
Wave labels use degree-correct notation per pivot, with configurable offsets, sizes and colors, and superscript markers where an extension was confirmed.
The score table ranks the alternatives — score, tier, direction, degree, completion time, anchor state, and the deciding criterion — with every column individually toggleable.
The historical chain shows the patterns leading into the current count, and the sequel chain the continuation after it, both at the same degree.
From the currently open leg, EWCore draws measured targets and Fibonacci confluence zones, plus the invalidation level at which the leading count would be void.
A separate Frame Count gives a top-down reading of the displayed timeframe with its own open-leg hypotheses, target and invalidation — deliberately independent of the leading count, so a disagreement between the two is visible rather than hidden.
Hovering a candidate shows the reasoning behind its score, grounded in the measured ratios rather than a generic explanation.
Practical notes
Reliable counting starts at M15. M1 and M5 are not, or only conditionally, meaningful for this method and should be avoided for counting decisions.
Most colors, line styles, widths, text sizes and label distances are independently configurable per element, so the display can be adapted to any chart style — not literally every single element, but the large majority of them.
Alert conditions and JSON webhook payloads are available for automated workflows.
The settings are extensive. EWCore Docs puts the full manual on the chart, so you can look a setting up without leaving TradingView.
What this script does NOT do
It does not predict price with certainty. Every wave count is a probabilistic reading of price structure, not a forecast guarantee — Elliott Wave analysis is inherently open to more than one valid interpretation, and this script shows its confidence via the score table rather than presenting a single count as fact. It is not a buy/sell-signal generator and does not backtest a trading strategy.
This script is a technical analysis tool, not financial advice.
Disclaimer
Elliott Wave analysis is a theory about recurring patterns in market behavior, not a physical law — it describes tendencies markets have often followed, not ones they are bound to follow. This script enforces a specific, documented set of counting rules so that its output is internally consistent and reproducible from one run to the next. "Hard rule" here refers to a rule of the counting method itself — it is not a claim that price is guaranteed to obey it. Even within Elliott Wave theory, deviations and structural exceptions exist (diagonals, for instance, are the one pattern where the usual wave 4 rule is deliberately relaxed), and experienced analysts commonly reach different, equally rule-consistent counts on the same chart. A count that satisfies every rule this script checks is not the same as a correct forecast — it is one internally consistent reading among several that may be possible. No wave count produced by this script, however rule-consistent, is a guarantee of future price behavior. Wskaźnik

Weis Wave Renko - Effort vs ResultABOUT THIS SCRIPT
Weis Wave Renko – Effort vs Result indicator combines Renko price structure with Weis Wave volume analysis to help assess the relationship between market effort and price result.
This script is a fork and substantial extension of the original “Weis Wave Volume” script published by modhelius . Full credit is given to modhelius for the original Weis Wave calculation, Renko assignment methodology and histogram on which this version is based.
PURPOSE
The script was developed to support the following workflow:
Use VSA/Wyckoff analysis to identify the market background and possible exhaustion, absorption or testing activity.
Use Weis Wave volume to compare the effort behind successive buying and selling waves.
Use Renko structure to confirm changes of direction, higher lows, lower highs and sustained reversals.
Use the developing relationship between effort and result to assess whether supply or demand is strengthening, weakening or being absorbed.
Where appropriate, use a confirmed Renko reversal as part of an entry, stop-placement or trade-management process.
The script is intended to support a discretionary Wyckoff/VSA-style analysis of Renko charts.
It does not treat every Renko colour change as a trading signal. Instead, it is designed to help answer questions such as:
Is demand expanding or contracting?
Is supply expanding or contracting?
Is price rising with less apparent selling resistance?
Is price falling because support beneath the market is weak?
Is increased volume producing less price progress?
Does a high-volume wave represent a possible buying or selling climax?
Has a later lower-volume test supported or rejected that interpretation?
The underlying concept is effort versus result:
Effort = cumulative wave volume.
Result = the price movement achieved by the Renko wave.
PIVOT STATISTICS
At each completed Renko peak or trough, the script displays:
Weis Wave volume.
Number of Renko boxes contained in the wave.
The statistics box refers to the completed wave that formed that peak or trough.
The current uncompleted wave can also display a live statistics box. Live statistics remain provisional until the wave is completed by a confirmed change of direction.
WAVE COMMENTS
Each completed wave can receive a separate comment box connected to the centre of the relevant Renko leg.
The comment box may contain three distinct sections:
Structural conclusion.
Primary wave classification from the Scenario Key.
Explanation based on later price and volume behaviour.
For example:
Buying climax confirmed
Demand expanding
Next up-wave retest failed below the climax high on lower volume
The primary wave classification describes the completed wave relative to the previous wave in the same direction.
The structural conclusion may update later as additional waves complete reflecting the dynamic nature of the indicator.
PRIMARY WAVE CLASSIFICATIONS
Up-waves are compared with the preceding completed up-wave:
Demand expanding - More volume accompanied by a longer rise.
Demand contracting - Less volume accompanied by a shorter rise.
Less effort needed to rise - Similar or lower volume produced the same or greater upward progress.
Buying effort absorbed - More volume produced a shorter rise, suggesting that buying effort encountered supply.
Down-waves are compared with the preceding completed down-wave:
Supply expanding - More volume accompanied by a longer decline.
Supply contracting - Less volume accompanied by a shorter decline.
Less support beneath price - Similar or lower volume produced the same or greater downward progress.
Selling effort absorbed - More volume produced a shorter decline, suggesting that selling effort encountered demand.
No material change - Neither volume nor price result changed sufficiently to exceed the selected Material Change Threshold.
CLIMAX ANALYSIS
A large wave is not classified as a confirmed climax merely because it has high volume. The script uses a staged process:
Possible buying climax:
An up-wave becomes a buying-climax candidate.
The next down-wave must produce the selected Renko reversal confirmation, which defaults to three boxes.
The immediately following up-wave is treated as the retest.
The buying climax is confirmed only when that next up-wave: has lower volume than the original climax up-wave; produces a shorter rise; and fails below the climax high. The comment can then state:
Buying climax confirmed -
Next up-wave retest failed below the climax high on lower volume - Possible selling climax
A down-wave becomes a selling-climax candidate. The next up-wave must produce the selected Renko reversal confirmation. The immediately following down-wave is treated as the test. The selling climax is confirmed only when that next down-wave: has lower volume than the original climax down-wave; produces a shorter decline; and holds above the climax low.
The comment can then state:
Selling climax confirmed -
Next down-wave test held above the climax low on lower volume
Only the immediate next corresponding up-wave or down-wave is used for the test. The script does not search through later waves to find a result that retrospectively fits the climax interpretation.
NO SUPPLY AND NO DEMAND
Possible no supply requires a down-wave that:
has lower volume than the previous down-wave;
produces a shorter decline; and
forms a higher low.
The following up-wave must then sustain the selected number of reversal boxes.
Possible no demand requires an up-wave that:
has lower volume than the previous up-wave;
produces a shorter rise; and
forms a lower high.
The following down-wave must then sustain the selected number of reversal boxes.
These are rule-based interpretations of wave behaviour. They are not substitutes for a full Wyckoff or VSA analysis of background, location and market structure.
DEVELOPING WAVES
The current wave comment can update dynamically as volume and Renko-box count accumulate.
Developing comments use provisional wording such as:
Demand currently expanding.
Supply currently contracting.
Buying effort currently absorbed.
Possible no supply.
Possible no demand.
A developing classification can change before the wave completes.
PROJECTION BOXES/BRICKS
TradingView can display projection boxes/bricks while the source-timeframe bar remains open.
Projection does not mean that the script is forecasting future bricks. It means that current price before the time period close has already moved far enough to meet one or more Renko thresholds during the still-open source bar.
For example, on a Daily Renko chart:
intraday price movement can produce provisional Renko bricks;
those bricks can appear before the Daily bar closes;
they can change or disappear before the close;
they become part of the confirmed historical Renko structure only after the source bar is confirmed.
The same principle applies to Weekly and other source intervals.
Live statistics and developing comments should therefore be treated as provisional.
RENKO ASSIGNMENT METHODS
Traditional: Traditional uses a fixed price-unit assignment value.
If the TradingView chart is set to: Traditional box size = 3, the indicator should normally also be set to the same Renko Assignment Method = Traditional Value = 3
The script cannot automatically read the Renko box-size setting from the TradingView chart.
ATR: ATR derives the assignment value from Average True Range. The Value input represents the ATR lookback period rather than a fixed number of price points. ATR adapts to volatility, but changing box/brick size make historical box-count comparisons less directly uniform than Traditional sizing.
Part of Price: The inherited Part of Price method calculates close ÷ Value
For example: Value 20 = approximately 5% of price. This is not identical to TradingView’s Percentage LTP Renko setting.
DISPLAY AND POSITIONING
The script includes adjustable controls for:
up-wave and down-wave histogram colours;
histogram transparency;
pivot statistics placement;
statistics font size;
statistics connector lines;
adjacent statistics-label stacking;
wave-comment font size and line wrapping;
wave-comment vertical and horizontal offsets;
adjacent wave-comment stacking;
comment connector lines;
Permanent Note position and dimensions;
Scenario Key position and dimensions.
Adjacent label and chart leg comment box stacking is optional. Because Pine cannot measure the rendered pixel width or height of labels, collision avoidance is based on bar distance and price-coordinate separation rather than exact screen-pixel boundaries. The user may need to adjust these settings in the user interface panel to avoid overlapping of labels and comment boxes.
SCENARIO KEY
The Scenario Key translates observable effort-and-result combinations into the primary wave comments used by the script.
The table also explains the structural sequences used for:
climax candidates;
confirmed buying and selling climaxes;
possible no supply;
possible no demand;
failed follow-through;
provisional current-wave conclusions.
TIMEFRAME CONSIDERATIONS
Changing the TradingView chart timeframe changes the source data used to construct the Renko chart.
A Daily Renko structure and a Weekly Renko structure are therefore separate reconstructions, not merely different zoom levels of the same sequence.
Weekly charts may be useful for broad structural background.
Daily charts may provide more responsive directional changes.
Lower source intervals generally provide greater granularity but also produce more noise and more frequent projection box/brick changes.
LIMITATIONS
Renko charts use synthetic price construction.
The apparent Renko box/brick price is not always a directly tradable execution price.
Projection boxes/bricks can repaint while the source bar is open.
Historical calculations can change when:
the chart timeframe changes;
Renko settings change;
indicator assignment settings change;
additional lower-timeframe data becomes available;
TradingView reconstructs the Renko history.
This indicator should not be used to assume fills at ideal Renko box/brick prices.
Any strategy testing should use confirmed signals and actual market OHLC prices, with appropriate allowance for spread, slippage and execution delay.
The script provides analytical context. It does not provide financial advice or guarantee that any identified climax, test, no-supply condition, no-demand condition or Renko reversal will lead to a profitable trade.
CREDITS
Original Weis Wave Volume script and core calculation: modhelius
This version is an amended and extended fork incorporating:
Renko peak and trough statistics;
wave box counts;
dynamic wave comments;
effort-versus-result classifications;
climax and test sequencing;
no-supply and no-demand analysis;
projection-brick context;
configurable display, positioning and overlap-management controls.
DEVELOPMENT CONTEXT
The extended analytical concept implemented in this fork was developed following James Knox ’s presentation to the "To The Tick" trading group on 20/7/26 combining:
TradeGuider VSA observations;
Wyckoff concepts of effort versus result, climaxes, tests, springs, no supply and no demand;
Weis Wave volume;
Renko changes of direction and structural pivots.
The script’s classifications and dynamic comments were developed to make those relationships more easily visible directly on the Renko chart.
Wskaźnik

Weis Wave Renko - Effort vs ResultABOUT THIS SCRIPT
Weis Wave Renko – Effort vs Result indicator combines Renko price structure with Weis Wave volume analysis to help assess the relationship between market effort and price result.
This script is a fork and substantial extension of the original “Weis Wave Volume” script published by modhelius . Full credit is given to modhelius for the original Weis Wave calculation, Renko assignment methodology and histogram on which this version is based.
PURPOSE
The script was developed to support the following workflow:
Use VSA/Wyckoff analysis to identify the market background and possible exhaustion, absorption or testing activity.
Use Weis Wave volume to compare the effort behind successive buying and selling waves.
Use Renko structure to confirm changes of direction, higher lows, lower highs and sustained reversals.
Use the developing relationship between effort and result to assess whether supply or demand is strengthening, weakening or being absorbed.
Where appropriate, use a confirmed Renko reversal as part of an entry, stop-placement or trade-management process.
The script is intended to support a discretionary Wyckoff/VSA-style analysis of Renko charts.
It does not treat every Renko colour change as a trading signal. Instead, it is designed to help answer questions such as:
Is demand expanding or contracting?
Is supply expanding or contracting?
Is price rising with less apparent selling resistance?
Is price falling because support beneath the market is weak?
Is increased volume producing less price progress?
Does a high-volume wave represent a possible buying or selling climax?
Has a later lower-volume test supported or rejected that interpretation?
The underlying concept is effort versus result:
Effort = cumulative wave volume.
Result = the price movement achieved by the Renko wave.
PIVOT STATISTICS
At each completed Renko peak or trough, the script displays:
Weis Wave volume.
Number of Renko boxes contained in the wave.
The statistics box refers to the completed wave that formed that peak or trough.
The current uncompleted wave can also display a live statistics box. Live statistics remain provisional until the wave is completed by a confirmed change of direction.
WAVE COMMENTS
Each completed wave can receive a separate comment box connected to the centre of the relevant Renko leg.
The comment box may contain three distinct sections:
Structural conclusion.
Primary wave classification from the Scenario Key.
Explanation based on later price and volume behaviour.
For example:
Buying climax confirmed
Demand expanding
Next up-wave retest failed below the climax high on lower volume
The primary wave classification describes the completed wave relative to the previous wave in the same direction.
The structural conclusion may update later as additional waves complete reflecting the dynamic nature of the indicator.
PRIMARY WAVE CLASSIFICATIONS
Up-waves are compared with the preceding completed up-wave:
Demand expanding - More volume accompanied by a longer rise.
Demand contracting - Less volume accompanied by a shorter rise.
Less effort needed to rise - Similar or lower volume produced the same or greater upward progress.
Buying effort absorbed - More volume produced a shorter rise, suggesting that buying effort encountered supply.
Down-waves are compared with the preceding completed down-wave:
Supply expanding - More volume accompanied by a longer decline.
Supply contracting - Less volume accompanied by a shorter decline.
Less support beneath price - Similar or lower volume produced the same or greater downward progress.
Selling effort absorbed - More volume produced a shorter decline, suggesting that selling effort encountered demand.
No material change - Neither volume nor price result changed sufficiently to exceed the selected Material Change Threshold.
CLIMAX ANALYSIS
A large wave is not classified as a confirmed climax merely because it has high volume. The script uses a staged process:
Possible buying climax:
An up-wave becomes a buying-climax candidate.
The next down-wave must produce the selected Renko reversal confirmation, which defaults to three boxes.
The immediately following up-wave is treated as the retest.
The buying climax is confirmed only when that next up-wave: has lower volume than the original climax up-wave; produces a shorter rise; and fails below the climax high. The comment can then state:
Buying climax confirmed -
Next up-wave retest failed below the climax high on lower volume - Possible selling climax
A down-wave becomes a selling-climax candidate. The next up-wave must produce the selected Renko reversal confirmation. The immediately following down-wave is treated as the test. The selling climax is confirmed only when that next down-wave: has lower volume than the original climax down-wave; produces a shorter decline; and holds above the climax low.
The comment can then state:
Selling climax confirmed -
Next down-wave test held above the climax low on lower volume
Only the immediate next corresponding up-wave or down-wave is used for the test. The script does not search through later waves to find a result that retrospectively fits the climax interpretation.
NO SUPPLY AND NO DEMAND
Possible no supply requires a down-wave that:
has lower volume than the previous down-wave;
produces a shorter decline; and
forms a higher low.
The following up-wave must then sustain the selected number of reversal boxes.
Possible no demand requires an up-wave that:
has lower volume than the previous up-wave;
produces a shorter rise; and
forms a lower high.
The following down-wave must then sustain the selected number of reversal boxes.
These are rule-based interpretations of wave behaviour. They are not substitutes for a full Wyckoff or VSA analysis of background, location and market structure.
DEVELOPING WAVES
The current wave comment can update dynamically as volume and Renko-box count accumulate.
Developing comments use provisional wording such as:
Demand currently expanding.
Supply currently contracting.
Buying effort currently absorbed.
Possible no supply.
Possible no demand.
A developing classification can change before the wave completes.
PROJECTION BOXES/BRICKS
TradingView can display projection boxes/bricks while the source-timeframe bar remains open.
Projection does not mean that the script is forecasting future bricks. It means that current price before the time period close has already moved far enough to meet one or more Renko thresholds during the still-open source bar.
For example, on a Daily Renko chart:
intraday price movement can produce provisional Renko bricks;
those bricks can appear before the Daily bar closes;
they can change or disappear before the close;
they become part of the confirmed historical Renko structure only after the source bar is confirmed.
The same principle applies to Weekly and other source intervals.
Live statistics and developing comments should therefore be treated as provisional.
b]RENKO ASSIGNMENT METHODS
Traditional: Traditional uses a fixed price-unit assignment value.
If the TradingView chart is set to: Traditional box size = 3, the indicator should normally also be set to the same Renko Assignment Method = Traditional Value = 3
The script cannot automatically read the Renko box-size setting from the TradingView chart.
ATR: ATR derives the assignment value from Average True Range. The Value input represents the ATR lookback period rather than a fixed number of price points. ATR adapts to volatility, but changing box/brick size make historical box-count comparisons less directly uniform than Traditional sizing.
Part of Price: The inherited Part of Price method calculates close ÷ Value
For example: Value 20 = approximately 5% of price. This is not identical to TradingView’s Percentage LTP Renko setting.
DISPLAY AND POSITIONING
The script includes adjustable controls for:
up-wave and down-wave histogram colours;
histogram transparency;
pivot statistics placement;
statistics font size;
statistics connector lines;
adjacent statistics-label stacking;
wave-comment font size and line wrapping;
wave-comment vertical and horizontal offsets;
adjacent wave-comment stacking;
comment connector lines;
Permanent Note position and dimensions;
Scenario Key position and dimensions.
Adjacent label and chart leg comment box stacking is optional. Because Pine cannot measure the rendered pixel width or height of labels, collision avoidance is based on bar distance and price-coordinate separation rather than exact screen-pixel boundaries. The user may need to adjust these settings in the user interface panel to avoid overlapping of labels and comment boxes.
SCENARIO KEY
The Scenario Key translates observable effort-and-result combinations into the primary wave comments used by the script.
The table also explains the structural sequences used for:
climax candidates;
confirmed buying and selling climaxes;
possible no supply;
possible no demand;
failed follow-through;
provisional current-wave conclusions.
TIMEFRAME CONSIDERATIONS
Changing the TradingView chart timeframe changes the source data used to construct the Renko chart.
A Daily Renko structure and a Weekly Renko structure are therefore separate reconstructions, not merely different zoom levels of the same sequence.
Weekly charts may be useful for broad structural background.
Daily charts may provide more responsive directional changes.
Lower source intervals generally provide greater granularity but also produce more noise and more frequent projection box/brick changes.
LIMITATIONS
Renko charts use synthetic price construction.
The apparent Renko box/brick price is not always a directly tradable execution price.
Projection boxes/bricks can repaint while the source bar is open.
Historical calculations can change when:
the chart timeframe changes;
Renko settings change;
indicator assignment settings change;
additional lower-timeframe data becomes available;
TradingView reconstructs the Renko history.
This indicator should not be used to assume fills at ideal Renko box/brick prices.
Any strategy testing should use confirmed signals and actual market OHLC prices, with appropriate allowance for spread, slippage and execution delay.
The script provides analytical context. It does not provide financial advice or guarantee that any identified climax, test, no-supply condition, no-demand condition or Renko reversal will lead to a profitable trade.
CREDITS
Original Weis Wave Volume script and core calculation: modhelius
This version is an amended and extended fork incorporating:
Renko peak and trough statistics;
wave box counts;
dynamic wave comments;
effort-versus-result classifications;
climax and test sequencing;
no-supply and no-demand analysis;
projection-brick context;
configurable display, positioning and overlap-management controls.
DEVELOPMENT CONTEXT
The extended analytical concept implemented in this fork was developed following James Knox ’s presentation to the "To The Tick" trading group on 20/7/26 combining:
TradeGuider VSA observations;
Wyckoff concepts of effort versus result, climaxes, tests, springs, no supply and no demand;
Weis Wave volume;
Renko changes of direction and structural pivots.
The script’s classifications and dynamic comments were developed to make those relationships more easily visible directly on the Renko chart. Wskaźnik

QIFM SMC Market Structure QIFM SMC Market Structure — 2CR/2CG, BOS, CHoCH, FVG & OB
OVERVIEW
QIFM SMC Market Structure is a rule-based charting indicator designed to identify and display developing market structure using a custom Two-Candle Retracement framework.
The indicator combines:
• Two-Candle Retracement confirmation: 2CR and 2CG
• Developing and confirmed Break of Structure levels
• Pending and confirmed Change of Character levels
• Dual CHoCH identification
• Structure-based Fibonacci retracement levels
• Structure-leg Fair Value Gaps
• Order Blocks associated with accepted FVG patterns
• Previous Day High and Low
• Previous Week High and Low
• Optional candle classification and live OHLC analysis
This is a market-structure analysis tool. It does not place trades, calculate position size, or provide guaranteed buy and sell signals.
ORIGINALITY AND PURPOSE
The central feature of this indicator is its custom structure-confirmation sequence.
Instead of defining every local high or low as market structure, the script waits for a specific two-candle retracement condition before establishing a pending BOS level. Confirmed BOS and CHoCH events are then used to control where the indicator searches for FVG and Order Block zones.
The main original component is the sequencing of:
Impulse extreme → 2CR/2CG confirmation → pending BOS → confirmed BOS → protected CHoCH point → confirmed CHoCH → structure-leg FVG and OB filtering.
This structure-based filtering is intended to reduce the number of randomly marked gaps and blocks that are not connected to a confirmed market-structure event.
1. TWO-CANDLE RETRACEMENT: 2CR AND 2CG
The indicator uses two types of retracement confirmation.
2CR — Two-Candle Red Retracement
During a developing bullish structure:
• The script records a bearish candle as the first retracement candle.
• The next bearish candle must close below the low of the first bearish candle.
• When this condition is completed, the pattern is marked as 2CR.
• The highest price reached before the confirmed retracement becomes the pending bullish BOS level.
2CG — Two-Candle Green Retracement
During a developing bearish structure:
• The script records a bullish candle as the first retracement candle.
• The next bullish candle must close above the high of the first bullish candle.
• When this condition is completed, the pattern is marked as 2CG.
• The lowest price reached before the confirmed retracement becomes the pending bearish BOS level.
Inside-range behavior is also evaluated while the pattern is developing. A candle contained within the tracked range does not automatically confirm the retracement.
2. PENDING AND CONFIRMED BREAK OF STRUCTURE
After a valid 2CR or 2CG pattern, the script creates a waiting BOS line.
Bullish BOS:
• A 2CR confirms the retracement.
• The preceding bullish extreme becomes the pending BOS level.
• A bullish BOS is confirmed when a candle closes above that level.
Bearish BOS:
• A 2CG confirms the retracement.
• The preceding bearish extreme becomes the pending BOS level.
• A bearish BOS is confirmed when a candle closes below that level.
The waiting BOS line and the confirmed BOS line have separate style, width, and color controls.
A wick through the BOS level is not sufficient. BOS confirmation is based on the candle close.
3. PENDING CHoCH POINT
After a confirmed bullish BOS, the lowest point of the confirmed retracement becomes the bearish protected structure level.
After a confirmed bearish BOS, the highest point of the confirmed retracement becomes the bullish protected structure level.
This protected level is displayed as:
P.CHoCH — Pending Change of Character
The active pending CHoCH line represents the level that must be broken to confirm a potential change in the current market structure.
Users can separately display:
• The current pending CHoCH level
• Previous pending CHoCH levels
4. CONFIRMED CHANGE OF CHARACTER
A CHoCH requires two consecutive candle closes beyond the active protected level.
Bearish CHoCH:
• The current structure is bullish.
• Two consecutive candles close below the active bearish P.CHoCH level.
• The script marks a confirmed bearish CHoCH.
• The internal trend state changes from bullish to bearish.
Bullish CHoCH:
• The current structure is bearish.
• Two consecutive candles close above the active bullish P.CHoCH level.
• The script marks a confirmed bullish CHoCH.
• The internal trend state changes from bearish to bullish.
The candle colors are not used for CHoCH confirmation. Only the two consecutive closing prices relative to the protected level are evaluated.
5. DUAL CHoCH
The Dual CHoCH feature tracks an additional structural reference following a confirmed change in direction.
It is intended to highlight a secondary two-close break beyond the previous structural extreme. This can help users distinguish an initial change of character from a more developed structural transition.
Dual CHoCH lines, labels, colors, widths, and styles can be customized separately.
6. STRUCTURE-BASED FIBONACCI LEVELS
When a valid 2CR or 2CG creates a pending BOS setup, the indicator calculates Fibonacci levels across the relevant structure range.
The visible default levels are:
• 0.50
• 0.618
• 0.70
• 1.00
The script can display:
• The current structure Fibonacci
• A selected number of previous Fibonacci structures
• Individual Fibonacci level labels
• Custom colors, widths, and line styles
The 0.50-to-1.00 portion of the calculated range is also used internally as a location filter for qualifying FVG and Order Block zones.
In bullish structure, this generally represents the deeper or discount side of the measured range.
In bearish structure, this generally represents the deeper or premium side of the measured range.
Fibonacci levels are reference locations only. They are not automatic trade-entry signals.
7. FAIR VALUE GAP LOGIC
The script does not search for FVGs across every candle on the chart.
It searches for FVGs only inside confirmed BOS and CHoCH displacement legs.
Bullish FVG requirements include:
• A three-candle bullish wick imbalance
• The third candle’s low is above the first candle’s high
• The third candle closes above the second candle’s high
• Additional inside-candle checks reject compressed or fully contained formations
• The FVG and its associated Order Block must be positioned within the active Fibonacci filtering band
Bearish FVG requirements include:
• A three-candle bearish wick imbalance
• The third candle’s high is below the first candle’s low
• The third candle closes below the second candle’s low
• Additional inside-candle checks reject compressed or fully contained formations
• The FVG and its associated Order Block must be positioned within the active Fibonacci filtering band
Only qualifying structure-leg FVGs are displayed.
8. ORDER BLOCK LOGIC
For each accepted FVG pattern, the script defines the full high-to-low range of the first candle in the three-candle FVG formation as the associated Order Block.
The OB is therefore directly connected to:
• A confirmed BOS or CHoCH leg
• An accepted three-candle FVG pattern
• The active Fibonacci location filter
Bullish and bearish Order Blocks have separate visibility and color settings.
The OB zones are analytical reference areas. They should not be treated as guaranteed reversal or entry locations.
9. FVG AND OB MITIGATION
Users can choose between two FVG mitigation methods.
First Touch:
The zone is considered mitigated when price first enters the FVG boundary.
Full Fill:
The zone remains active until price reaches the opposite boundary of the FVG.
When mitigation occurs, users can choose to:
• Keep the zone as faded historical information
• Hide the completed zone
The associated OB is updated together with its corresponding FVG.
Historical zones show where a valid structure-leg imbalance previously existed. They do not indicate that the zone remains tradable.
10. PREVIOUS DAY AND PREVIOUS WEEK LEVELS
The indicator can display:
• PDH — Previous Day High
• PDL — Previous Day Low
• PWH — Previous Week High
• PWL — Previous Week Low
These values are taken from completed daily and weekly periods.
PDH and PDL alert conditions are included. An alert can be triggered when price touches the active Previous Day High or Previous Day Low for the first time relative to the preceding chart bar.
The levels are contextual liquidity references and are not independent buy or sell signals.
11. OPTIONAL CANDLE ANALYSIS
The optional live candle-analysis panel displays:
• Candle status: live or closed
• Bullish, bearish, or doji classification
• Open, high, low, and close
• Candle-body percentage
• Upper and lower wick sizes
• Full-range or body-inside classification
• Direct 2CR or 2CG close test
Users can also enable candle coloring based on the same classifications.
The panel is intended for studying the conditions used by the structure engine. It is not an order-execution panel.
HOW TO USE THE INDICATOR
1. Use a standard candlestick chart.
2. Select the symbol and timeframe appropriate for your analysis.
3. Observe whether the script is tracking a bullish or bearish structural sequence.
4. Wait for a confirmed 2CR or 2CG marker.
5. Observe the waiting BOS line created at the preceding impulse extreme.
6. Wait for a candle close beyond the waiting BOS line to confirm BOS.
7. After BOS, monitor the newly created P.CHoCH level.
8. A CHoCH is confirmed only after two consecutive closes beyond the protected level.
9. Use structure-leg FVG, OB, Fibonacci, PDH, PDL, PWH, and PWL zones as additional context.
10. Apply independent risk management and entry confirmation before making any trading decision.
The indicator is best used as a chart-organization and market-structure tool rather than as a standalone trading system.
IMPORTANT SETTINGS
2CR / 2CG Settings:
Control retracement labels, zone visibility, colors, and the maximum number of displayed zones.
BOS Settings:
Control waiting BOS lines, confirmed BOS lines, labels, colors, widths, and styles.
CHoCH Settings:
Control confirmed and pending CHoCH levels, previous protected levels, labels, colors, widths, and styles.
Dual CHoCH Settings:
Control secondary CHoCH lines and labels.
BOS Fib Settings:
Control the current Fibonacci structure, previous structures, visible retracement levels, labels, colors, widths, and styles.
FVG Settings:
Control bullish and bearish FVG visibility, mitigation method, active zones, historical zones, scan distance, colors, and maximum stored zones.
Order Block Settings:
Control bullish and bearish OB visibility, active zones, historical zones, text, borders, and colors.
Previous Day / Week Levels:
Control PDH, PDL, PWH, and PWL visibility and PDH/PDL alerts.
Candle Analysis:
Control the live OHLC panel and optional candle classification colors.
REAL-TIME BEHAVIOR
The current candle’s high, low, close, classification, developing structure, and panel values can change while the candle is still open.
Close-dependent conditions such as:
• 2CR confirmation
• 2CG confirmation
• BOS confirmation
• CHoCH confirmation
• FVG body confirmation
should be evaluated after the relevant candle has closed.
Confirmed historical calculations do not intentionally use future candles. Previous-day and previous-week levels are taken from completed reference periods.
LIMITATIONS
• The script begins with an internal bullish structure state and then adapts as confirmed structure events occur.
• Market structure depends on the selected symbol, timeframe, data feed, and available chart history.
• Lower timeframes may produce more structural changes and visual noise.
• A confirmed BOS or CHoCH does not guarantee continuation or reversal.
• FVG, OB, Fibonacci, PDH, PDL, PWH, and PWL levels can be crossed without producing a reaction.
• The script does not account for spread, commission, slippage, economic news, liquidity conditions, or position sizing.
• The number of displayed historical objects is limited by the selected settings and TradingView’s drawing-object limits.
• Results can differ between brokers or exchanges because their OHLC data may differ.
ALERTS
The current version includes alert conditions for:
• Previous Day High touched
• Previous Day Low touched
Users should create alerts from TradingView’s alert menu after adding the indicator to a chart.
EDUCATIONAL DISCLAIMER
This indicator is provided for technical-analysis, educational, and informational purposes only.
It is not investment advice, financial advice, or a recommendation to buy or sell any financial instrument. No market-structure event, FVG, Order Block, Fibonacci level, or previous-period level can guarantee a profitable outcome.
Trading and investing involve substantial risk. Users are responsible for independently evaluating all information, testing the indicator, managing their risk, and making their own trading decisions. Past market behavior does not guarantee future results.
Wskaźnik

Day Trade Setup - CRT Session Range ModelDay Trade Setup - CRT Session Range Model
Day Trade Setup - CRT Session Range Model is a session-based market framework designed to identify important intraday reference ranges and combine them with liquidity sweeps, M15 imbalance gaps, market structure levels, and supply or demand zones.
The script is designed to help traders organize intraday price action around selected H1 session ranges. Instead of displaying isolated signals, it creates a structured map of the current setup, including the range high, range low, 50% midpoint, nearby liquidity events, and relevant M15 reference areas.
Core Concept
The indicator analyses predefined H1 trading periods and selects the most significant candle within each session window using a weighted candle score.
The score considers:
Candle body size
Upper and lower wick size
User-defined body weighting
User-defined wick weighting
The selected candle becomes the active session range. Its high, low, and 50% midpoint are then projected across the chart as reference levels.
The most recent valid session setup automatically becomes the active model.
Session Range Models
The indicator supports three session groups:
Dawn Range
The Dawn Range evaluates the H1 candles formed between 1:00 AM and 5:00 AM.
The script compares the five candles and selects the candle with the highest weighted body-and-wick score as the active range.
Morning Range
The Morning Range compares the 8:00 AM and 9:00 AM H1 candles.
The candle with the stronger weighted score becomes the active range.
Evening Range
The Evening Range compares the 8:00 PM and 9:00 PM H1 candles.
The stronger candle is selected as the active range.
Users can display one session model individually or enable all available sessions.
Active Range Display
When a new setup is selected, the indicator displays:
Session Range High
Session Range Low
50% midpoint
Session and hour label
Continuously extending reference lines
The 50% level helps divide the selected range into upper and lower halves, providing a visual reference for premium and discount areas within the setup.
The script replaces the previous active range when a newer valid session setup is confirmed.
Liquidity Sweep Detection
The indicator includes an optional liquidity sweep module that monitors price interaction with the active range high and low.
A potential bearish liquidity sweep may be identified when price:
Trades above the active range high
Returns and closes below the range high
Meets the selected volatility, body, and upper-wick requirements
A potential bullish liquidity sweep may be identified when price:
Trades below the active range low
Returns and closes above the range low
Meets the selected volatility, body, and lower-wick requirements
The liquidity sweep filter also includes a cooldown period to reduce repeated labels appearing within a short number of bars.
These markers represent potential liquidity-rejection events and are not automatic entry signals.
M15 Imbalance Gap
The script can locate a recent bullish or bearish M15 imbalance gap that formed before the active session setup.
The imbalance module:
Searches the latest M15 gaps
Considers only gaps formed before the active setup
Supports bullish, bearish, or both gap types
Filters gaps using ATR-based minimum size
Can restrict results to gaps near the session range
Locks the selected gap when a new setup appears
Displays the gap boundaries and midpoint
Only a qualifying gap whose midpoint is outside the active session range is displayed.
This helps traders identify nearby price imbalances that may act as reaction areas or potential liquidity objectives.
M15 Structure Levels
The indicator identifies previously confirmed M15 swing highs and swing lows using pivot-based market structure.
For each new session setup, the script searches for:
A confirmed structure high above the session range
A confirmed structure low below the session range
Only structure points that formed before the active setup are considered.
The selected levels are extended across the chart and labelled as:
STRUCT-HIGH
STRUCT-LOW
These levels may be used as external liquidity references, breakout levels, or potential price objectives.
M15 Supply and Demand Zones
The indicator also includes a simplified M15 supply and demand zone module.
A potential demand zone is identified from a bearish candle followed by a bullish displacement above that candle’s high.
A potential supply zone is identified from a bullish candle followed by a bearish displacement below that candle’s low.
The script applies body-strength and optional ATR range filters before accepting a zone.
For a bullish session setup, the script searches for a qualifying demand zone positioned above the session range.
For a bearish session setup, the script searches for a qualifying supply zone positioned below the session range.
Only zones formed before the active setup are considered.
The selected zone is displayed with:
Zone boundaries
50% midpoint
M15 zone label
Automatic right-side extension
Multi-Timeframe Structure
The model combines information from multiple timeframes:
H1 for session-range selection
M15 for imbalance gaps
M15 for structure highs and lows
M15 for supply and demand zones
Current chart timeframe for liquidity-sweep confirmation and display
The M15 modules are intended for charts between 1 minute and 15 minutes. Their drawings are hidden automatically on timeframes above 15 minutes.
Alerts
The indicator includes alerts for:
A newly selected session setup
A qualifying M15 structure high
A qualifying M15 structure low
A selected demand zone
A selected supply zone
The new setup alert identifies the symbol, selected model, and setup hour.
Suggested Workflow
A possible workflow is:
Identify the active H1 session range.
Observe whether price is trading above or below the 50% midpoint.
Wait for price to interact with the session high or low.
Look for a qualifying liquidity sweep.
Review nearby M15 imbalance gaps.
Check external M15 structure levels.
Use the selected supply or demand zone as additional context.
Apply independent entry confirmation and risk management.
The script is intended to organize market context. It does not automatically calculate an entry price, Stop Loss, Take Profit, position size, or trade outcome.
Customization
Users can adjust:
Light or dark visual theme
Active session model
Candle body and wick weighting
Line width and label size
Range projection length
Liquidity-sweep quality filters
Sweep cooldown period
Gap direction and ATR filter
Gap proximity to the setup
Structure pivot length
Supply and demand zone strength
Zone distance from the setup
These settings allow the model to be adapted to different symbols, volatility conditions, and trading styles.
Limitations
The session model uses fixed H1 time windows based on the symbol’s exchange or chart time context. Users should verify that the displayed hours match their intended trading session.
Pivot-based structure levels require candles on both sides of the pivot before confirmation. As a result, structure levels appear after the turning point has already formed.
Liquidity sweeps, imbalance gaps, and supply or demand zones do not guarantee a price reversal or continuation.
The script displays selected technical reference areas only. It does not account for spread, commission, slippage, economic news, liquidity conditions, or broker execution.
Because the script uses multiple timeframe calculations, some elements may update only after the relevant H1 or M15 candle has completed.
Disclaimer
Day Trade Setup - CRT Session Range Model is provided for technical analysis and educational purposes only.
It does not constitute financial advice, investment advice, trade recommendations, or guaranteed trading results. The displayed ranges, sweeps, gaps, structure levels, and zones are technical reference areas and should not be used as standalone entry signals.
Users are responsible for independently evaluating market conditions and applying appropriate risk management before trading with real funds. Wskaźnik

XAUUSD Scalper Pro by QUANTRADZGold Scalping Direction & Pullback Signals is a trend-following indicator designed to identify potential BUY and SELL opportunities on XAU/USD. It is intended primarily for 1-minute, 3-minute and 5-minute charts.
The indicator combines trend direction, momentum, volatility and candle confirmation into a configurable scoring system. Signals are designed to appear only after a candle has closed, helping traders avoid acting on incomplete candles.
HOW IT WORKS
The indicator analyzes:
• EMA 20 and EMA 50 for short-term trend direction• Optional EMA 200 for the broader market trend• RSI for momentum confirmation• ADX and DMI for trend strength and directional pressure• ATR for volatility filtering and risk-level calculations• Pullbacks toward the moving averages• Candle-body strength for entry confirmation• Optional higher-timeframe trend alignment
BUY SIGNAL
A BUY signal may appear when the short-term trend is bullish, price completes a valid pullback, momentum supports further upside and a strong bullish candle closes.
SELL SIGNAL
A SELL signal may appear when the short-term trend is bearish, price completes a valid pullback, momentum supports further downside and a strong bearish candle closes.
SIGNAL SCORING
Each bullish or bearish condition contributes to a directional score. A signal appears only when the score reaches the selected minimum threshold.
A higher threshold generally produces fewer but more selective signals. A lower threshold produces more signals but may also increase false entries.
CHART FEATURES
• Confirmed BUY and SELL markers• EMA 20, EMA 50 and optional EMA 200• Bullish and bearish condition scores• Trend and momentum dashboard• Optional higher-timeframe confirmation• ATR-based stop-loss and target guides• Configurable signal cooldown• Optional session and volatility filters• Confirmed BUY and SELL alerts
SUGGESTED USE
This indicator is designed for trend-pullback trading. It should not be used to enter every signal automatically.
Before considering an entry:
Confirm that the market is trending.
Avoid flat or frequently crossing moving averages.
Wait for the signal candle to close.
Check nearby support and resistance.
Avoid major economic announcements and abnormal volatility.
Use appropriate risk management.
For normal spot, CFD or futures trading, ATR levels can help estimate possible stop-loss and profit-target locations.
For fixed-payout trades, the ATR stop and target lines do not represent expiry rules. Each expiry duration should be tested separately using historical and demo results.
NON-REPAINTING BEHAVIOR
Signals are designed to use confirmed candle data and appear after the signal candle closes. Higher-timeframe calculations are designed to avoid lookahead.
Users should independently verify this behavior with TradingView’s Bar Replay feature before using the indicator.
IMPORTANT LIMITATIONS
This indicator does not predict the market and does not guarantee profitable trades. Signals can fail during ranging conditions, sudden news events, low liquidity or rapid reversals.
TradingView prices may differ from prices displayed by a broker or fixed-payout platform. Small differences can significantly affect short-duration trades.
Always test the indicator on historical data and a demo account before considering real-money trading. Past performance does not guarantee future results. Never risk money you cannot afford to lose. Wskaźnik

Wskaźnik

Native Volume Footprint, 1H Alignment, Brackets & OBs by GuruJamThe TradingView Pine Script v6 dashboard is built to function as a comprehensive macroeconomic and technical analysis tool, specifically optimized for tracking the Nairobi Securities Exchange.
Here is a breakdown of its core structural and functional components:
Core Functionality
Macro-Economic Integration: The script allows for sector-specific customization, enabling you to align technical movements with broader Kenyan macroeconomic trends and specific market sectors.
Advanced Technical Mapping: It incorporates Smart Money Concepts, specifically utilizing horizontal liquidity boxes. These visually map out critical zones of institutional interest, historical support/resistance, and areas where liquidity is resting.
Automated Signal Filtering: Instead of raw data plotting, the script runs market data through customized filters to generate automated, actionable trade signals based on the confluence of volume, price action, and liquidity sweeps.
Technical Architecture
Language: Written in Pine Script v6, taking advantage of the latest array functionalities, dynamic lines, and box drawing capabilities for real-time order book and liquidity evaluation.
Display: Designed as an overlay or dashboard interface to provide multi-timeframe insights without cluttering the primary price chart. Wskaźnik

Momentum Cascade | Lyro RSOverview:
Momentum Cascade is a rate-of-change momentum tool that passes a single momentum reading through three sequential smoothing stages to filter out early, unconfirmed moves. Rather than reacting to the first sign of a shift, it waits for the momentum signal to "cascade" through instant, reactive, and committed stages before confirming a trend, giving a cleaner read on when a move has genuine follow-through.
Key Features
Three-Stage Cascade Engine: Calculates a rate-of-change momentum value, then passes it through two successive EMA smoothing stages. Stage 1 is the raw instant impulse, Stage 2 is the first reactive smoothing, and Stage 3 is the fully committed signal.
Trend Confirmation Score: Each stage contributes +1 or -1 depending on its direction. A trend only confirms when all three stages agree (score of +3 or -3), filtering out momentum blips that fade before they cascade through.
Gradient Strength Visualization: The committed Stage 3 line and candle coloring use a gradient blend based on how strong the current agreement is across all three stages, giving an at-a-glance read on conviction.
Multi-Layer Plotting: Displays all three cascade stages simultaneously (thin instant line, mid-weight reactive line, and a glow-effect committed line) so you can see momentum building in real time, not just the final confirmation.
Candle Coloring: Optionally recolors chart candles using the same gradient logic as the oscillator, aligning price action visually with the cascade's current trend strength.
Customizable Visuals: Choose from 4 preset palettes — Classic, Mystic, Accented, Royal — or define your own custom bullish/bearish colors.
Built-In Signals: Automatically plots long/short labels on confirmed trend flips (when the score crosses into full +3 or -3 agreement).
How It Works
Momentum Calculation – Computes rate-of-change of price over the chosen length as the raw momentum impulse (Stage 1).
Cascade Smoothing – Passes that momentum through an EMA to produce Stage 2 (reactive), then smooths again to produce Stage 3 (committed).
Scoring – Assigns +1/-1 per stage based on sign, summing to a score between -3 and +3.
Trend Confirmation – A trend state only flips when the score reaches full agreement (+3 or -3), meaning all three stages point the same direction.
Signal Plotting – Trend flips are marked with long/short labels, and candle/line coloring reflects both direction and agreement strength via gradient.
Practical Use
Trend Confirmation – Use full cascade agreement (score of ±3) as confirmation that a momentum shift has enough follow-through to be tradeable, rather than acting on Stage 1 alone.
Early Warning – Watch Stage 1 and Stage 2 for early signs of a potential shift before the full cascade confirms, useful for anticipating entries.
Conviction Reading – Use the gradient strength on Stage 3 and candles to gauge how strongly the current trend is holding versus weakening.
Combine with Structure – Pair cascade confirmations with support/resistance or market structure levels for higher-quality entries.
Customization
Adjust Momentum Length and Stage Smoothing independently to tune responsiveness vs. lag.
Toggle signal labels and candle coloring on/off.
Pick a preset palette or define fully custom bullish/bearish colors.
⚠️Disclaimer
This indicator is a tool for technical analysis and does not provide guaranteed results. It should be used in conjunction with other analysis methods and proper risk management practices. The creators of this indicator are not responsible for any financial decisions made based on its signals. Wskaźnik

Bitcoin Almanac [WillyAlgoTrader]₿ Bitcoin Almanac is an overlay indicator that maps the entire Bitcoin macro landscape on one chart: a fixed-length cycle time model (bull/bear phases projected from a single anchor date), two hyperbolic curves fitted through historical cycle lows and cycle highs in log-price space, Fibonacci grids stretched between every macro pivot, halving markers, accumulation and distribution zones, and a hypothetical price path for the next bull leg — all summarized in a live dashboard with projected turn dates, curve prices, and historical correction depths.
The core insight: Bitcoin's completed cycles show a remarkably stable time rhythm (roughly 1064 days up, 364 days down) and a decelerating growth pattern that a hyperbola in log10(price) captures with surprisingly small error. Neither observation is a law of nature — but when the time model and the price curves are combined on one chart, they produce concrete, falsifiable reference points: a projected top date with a curve price, a projected bottom date with a curve price, and buy/sell zones derived from both. The indicator makes the whole framework explicit, configurable, and honest about its assumptions.
Everything is driven by dates and user-defined pivots — not by real-time price action — so nothing repaints: the lines you see today are the lines you saw yesterday.
🧩 WHY THESE COMPONENTS WORK TOGETHER
A cycle-date model alone answers WHEN but not AT WHAT PRICE. A curve through historical lows answers WHERE support migrates but not WHEN price will meet it. Fibonacci retracements answer WHERE pullbacks tend to end, but only if you know which macro leg to anchor them to. Used separately, each tool leaves you guessing at the missing dimension.
Bitcoin Almanac chains them into one pipeline:
Cycle time model (anchor + phase lengths) → projected turn dates → hyperbolic lows/highs curves → curve price AT each projected date → Fibonacci grids between macro pivots → 0.786–0.836 accumulation zones bounded by cycle end dates → ±% distribution zones around each high → replayed bull-path projection between the two curve endpoints → dashboard synthesis
The time model supplies the X-coordinate of every future event. The two hyperbolas supply the Y-coordinate: the lows curve is evaluated exactly at the projected bottom date, the highs curve exactly at the projected top date — the "◎ cycle × curve" labels mark these intersections with date and price. The Fibonacci grids are then anchored to the same pivots the curves are built from, so the 0.786–0.836 buy zone of the current leg stretches in time precisely to the model's next cycle-bottom date. Finally, the projection module takes the two curve × date intersections as endpoints and fills the path between them by replaying the shape of the previous bull phase in log space.
No single component can do this: the intersection of an independent time model with an independent price model is what turns two vague trajectories into specific, checkable coordinates.
🔍 WHAT MAKES IT ORIGINAL
1️⃣ Fixed-rhythm cycle engine — pure time math, zero price input.
The phase of any bar is computed directly from calendar time:
daysSince = (barTime − anchor) / 86 400 000
phasePos = daysSince mod (bullDays + bearDays)
isBull = phasePos < bullDays
Defaults: anchor = 07 Nov 2022, bullDays = 1064, bearDays = 364 (each ≈ the average of the three completed BTC cycles). A true mathematical modulo (always ≥ 0) phases bars BEFORE the anchor correctly, so past cycles line up too. With defaults this reproduces the well-known projected dates: top ≈ 06 Oct 2025, bottom ≈ 05 Oct 2026. An alternative anchor (21 Nov 2022 — the actual lowest trade of the cycle) is documented right in the input tooltip and shifts the bottom to 19 Oct 2026.
Why this matters: because the phase depends only on time, the bull/bear background, turn lines and flip alerts are deterministic and cannot repaint — the model's claims are fully falsifiable in advance.
2️⃣ Hyperbolic curve through cycle lows — exact geometry or least-squares fit, with the error printed on the chart.
The lows model is log10(price) = a + b / (c − t), where t is days from the first pivot. The hyperbola has a vertical asymptote in the past and a horizontal asymptote in the future — it encodes decelerating growth, which a straight log-regression line cannot.
— With exactly 3 enabled lows (default: Aug 2015 ≈ $169, Dec 2018 ≈ $3 122, Nov 2022 ≈ $15 476) the three parameters are solved exactly — the curve passes through the pivots by construction. This is geometry, not statistics, and the label says so: "exact through 3 lows".
— With 4+ enabled lows (three optional early-history slots: 2011, 2013, 2015 are provided) the indicator switches to a least-squares fit: a coarse log-spaced search over 250 candidate asymptote positions, followed by a 200-step linear refinement around the best candidate. The curve label then reports the number of points and the RMSE in log10 units — the fit quality is never hidden.
A fit is accepted only if b > 0 and the asymptote c lies before the earliest pivot — degenerate solutions are rejected and the curve simply doesn't draw.
3️⃣ Second independent hyperbola through cycle highs.
The same model is fitted to cycle tops (defaults: Nov 2013 ≈ $1 238, Dec 2017 ≈ $19 700, Nov 2021 ≈ $69 000, Oct 2025 ≈ $126 200 — four points, so LS fit with visible RMSE). A fifth, disabled slot exists only if you want to force the fit through your own future target; you never need it for the projection, because the future top is marked automatically at the crossing of the highs curve with the projected top date.
Why two curves: lows and highs decelerate at different rates. Fitting them independently (instead of offsetting one curve) lets the model express a narrowing channel without assuming its shape.
4️⃣ "Cycle × curve" intersection labels — the model's testable predictions.
At the projected bottom date the lows curve is evaluated: ◎ label with date ≈ price. At the projected top date the highs curve is evaluated: ◎ label with date ≈ price. These two points are the indicator's headline output — a date AND a price for each future turn, derived from two independent models. Both curves extend beyond their intersection as dashed lines (lows: default 10 years, highs: 5 years) to show the long-term trajectory.
5️⃣ Macro Fibonacci grids with a time-bounded 0.786–0.836 accumulation zone.
All enabled lows and highs are merged chronologically; every leg between two pivots of opposite type receives a grid (low→high = bull grid, high→low = bear grid; same-type neighbours are skipped). Levels are fully user-defined (default: 0, 0.236, 0.382, 0.5, 0.618, 0.786, 0.836, 0.886, 1; values > 1 add extensions).
Two non-standard options:
— Log-scale interpolation : level price = 10^(log10(pA) + f × (log10(pB) − log10(pA))) — matches a fib tool drawn on a log chart. Off by default (arithmetic levels for a linear chart).
— Reverse mode (default ON): ratio 0 sits at the END of the leg, so on a bull leg 0.618 is the classic retracement below the high.
The 0.786–0.836 zone of each bull leg is highlighted as a "BUY ZONE" box — and here is the original part: the box stretches in time from the leg start to the end date of the cycle the leg belongs to (the next projected cycle bottom). Depth from the fib model, deadline from the time model — the zone is a rectangle in (price × time), not just a price band.
6️⃣ Distribution zones tied to the cycle skeleton.
Every enabled high gets a "SELL ZONE" box spanning high ± sellPct (default 5% → from high × 0.95 to high × 1.05). The time span runs from the LATER of (a) the latest enabled low before that high or (b) the model's cycle bottom immediately preceding it — so a projected 2029 high starts its zone at the projected Oct-2026 bottom, not at a 2022 pivot. If no enabled high exists in the upcoming cycle, a projected sell zone is created automatically at the highs-curve × projected-date crossing (duplicate-guarded within half a cycle).
7️⃣ Bull-path projection — fractal replay of the previous bull, rescaled in log space.
The path for the NEXT bull phase (with defaults: 05 Oct 2026 → 03 Sep 2029) is drawn between two model-derived endpoints: start = lows curve at the projected bottom, end = highs curve at the following projected top. Two shapes:
— Replay last bull (default): the log-price trajectory of the previous bull phase is recorded bar by bar (confirmed bars only, thinned to ≤ 400 samples for memory safety on intraday timeframes), then linearly rescaled: y(progress) = yStart + (ref(progress) − ref(0)) × (yEnd − yStart) / (ref(1) − ref(0)). The result keeps the timing character of the last cycle — early acceleration, mid-cycle chop, late blow-off — mapped onto the new endpoints.
— Log-linear : a straight line on a log chart between the endpoints. The replay mode automatically falls back to log-linear if the reference phase covers less than 90% of the bull duration.
The path is explicitly labeled "◇ PROJECTED PATH (hypothetical)" — it is a scenario generator, not a forecast.
8️⃣ Corrections table — every macro drawdown since 2014, including the unfinished one.
The dashboard lists every completed high → following-low leg between enabled pivots since 2014 as a % drop (e.g. 2017–2018: −84%). If the latest pivot is a high with no low after it, the current correction is projected : measured from that high to the lows-curve price at the next model bottom, and marked "(proj.)" in accent color. You always see how the ongoing decline compares with history.
9️⃣ Full-transparency dashboard with a phase gauge and next-leg scenario PNL.
Four toggleable sections: Cycle (phase, day X / Y, ██████░░░░ progress gauge), Projection (top and bottom dates with days-left counters and curve prices, plus the hypothetical PNL of the next bull leg: (topCurve / bottomCurve − 1) × 100% and the × multiple), Corrections (see 8️⃣), Ranges (nearest upcoming buy range = the 0.786–0.836 zone prices; nearest sell range = the ±% zone around the next projected high). The footer states the calibration chart (INDEX:BTCUSD · W · linear scale, with a live ✓ when you're on it), a timeframe warning, and the sample-size caveat "⚠ Sample size: 3 cycles" — the model's biggest limitation is printed on the chart itself.
🔟 Efficient, tick-stable rendering.
All drawings (500+ polyline points, fib grids, boxes, dashboard) are anchored to bar-open times and first-bar curve fits — nothing changes within a bar. A redraw gate rebuilds them once per new bar instead of on every real-time tick, and both curve fits run exactly once on the first bar. The chart stays responsive even with all modules enabled.
📐 HOW IT WORKS — CALCULATION FLOW
Step 1 — Parse pivots: on the first bar, all enabled lows and highs are converted to (days-from-first-pivot, log10(price)) pairs.
Step 2 — Fit the curves: each set is fitted to log10(price) = a + b/(c − t) — exact solve for 3 points, two-stage least-squares search for 4+. Fit validity is checked (b > 0, asymptote before the data).
Step 3 — Phase every bar: calendar-time modulo against the anchor determines bull/bear phase, day-in-phase, and the timestamps of the current, next bottom and next top.
Step 4 — Evaluate intersections: the lows curve at the projected bottom date and the highs curve at the projected top date become the model's price targets.
Step 5 — Record the reference bull: during the anchor cycle's bull phase, confirmed closes are stored as (progress, log10 price) — the shape later replayed by the projection.
Step 6 — Draw (once per bar): turn lines and labels for N past and M future cycles, both hyperbolas with dashed extensions, fib grids per alternating pivot leg, buy/sell zone boxes, halving lines (2012 / 2016 / 2020 / 2024 solid, Apr 2028 dashed "(est.)"), the projected path, the dashboard and the watermark.
Step 7 — Alert: on confirmed bars, phase flips and the pre-turn countdown fire alert() calls in text or JSON format.
📖 HOW TO USE
🎯 Quick start:
1. Open the INDEX:BTCUSD chart, Weekly timeframe, regular (linear) price scale — the model is calibrated there, and the dashboard shows a ✓ when the symbol and timeframe match (the scale must be checked manually — Pine cannot detect it).
2. Add the indicator. The green/red background immediately shows the model's current phase; the dashboard shows the day count and progress gauge.
3. Find the two ◎ labels — the projected bottom (orange, lows curve) and the projected top (red, highs curve). These are the model's date + price coordinates for the next turns.
4. Check the yellow boxes: BUY ZONE (0.786–0.836 of the current bull leg, extended to the cycle end date) and SELL ZONE (±5% around each high).
5. Create ONE alert with condition "Any alert() function call" to receive flips and the pre-turn countdown.
👁️ Reading the chart:
— 🟢 Green background = model bull phase; 🔴 red = bear phase
— Solid green verticals = cycle bottoms; dashed red verticals = cycle tops; future turns are labeled ★ PROJECTED and drawn brighter
— 🟠 Orange curve = hyperbola through cycle lows (solid to the projected bottom, then dashed extension)
— 🔴 Red curve = hyperbola through cycle highs (solid to the projected top, then dashed extension)
— Small circles = the exact pivots each curve is built from
— ◎ labels = cycle × curve intersections with date, ≈ price, and fit info (point count + RMSE, or "exact through 3")
— Fib grids between macro pivots: solid edges (0 / 1), dashed 0.5, dotted intermediate levels, price + ratio labels on the right
— 🟡 Yellow boxes = BUY ZONE (0.786–0.836, time-bounded by the cycle end) and SELL ZONE (±% around highs; "(proj.)" = auto-generated at the projected top)
— ⛏ Grey verticals = halvings; the 2028 line is dashed and marked "(est.)"
— 🔵 Blue dashed path = hypothetical next-bull trajectory with its ◇ end label
📊 Dashboard fields:
— Phase / Phase day / Progress : current model phase, day within it, and a 10-segment gauge
— Proj. top / Proj. bottom : projected turn dates, days remaining, and the curve price at each date
— Next leg PNL : hypothetical bottom→top move of the next bull leg in % and as a × multiple — a scenario, not a forecast
— Corrections : every completed macro drawdown since 2014 (high → following low, %), plus the unfinished one projected to the curve bottom and marked (proj.)
— Next buy range / Next sell range : the price boundaries of the nearest upcoming accumulation and distribution zones
— Footer: recommended chart check, timeframe warning, sample-size caveat, version
🔧 Tuning guide:
— Curve doesn't draw: fewer than 3 pivots enabled, or the fit was rejected as degenerate — enable at least 3 lows (or highs) with sensible dates/prices.
— You disagree with a pivot price: every pivot is an editable date + price input — correct it and both the curve and the fib grids rebuild instantly.
— Want dates matching the actual price low: switch the anchor to 21 Nov 2022 (documented in the tooltip); the projected bottom moves to 19 Oct 2026.
— Fib levels look wrong on a log chart: enable "Log-scale levels" (keep it OFF on the recommended linear chart).
— Chart feels crowded: disable individual modules (grids, zones, halvings, projection) or dashboard sections — every block has its own switch.
— Curious about 2030+: enable "Show 2nd projected cycle" for one more bottom/top pair (~Sep 2030 / ~Aug 2033) — off by default because those dates carry double model uncertainty.
💡 Trading ideas:
— Accumulation planning : scale into the 0.786–0.836 BUY ZONE while the model is in its bear phase; the zone's right edge tells you the model's deadline.
— Distribution planning : scale out inside the ±5% SELL ZONE as the projected top date approaches; the pre-alert (default 30 days) gives you a heads-up.
— Scenario testing : move pivots, change phase lengths, or force High #5 to your own target and watch how the whole framework (curves, zones, PNL) responds — the model is a sandbox, not an oracle.
⚙️ KEY SETTINGS
⚙️ Cycle Model:
— Anchor — cycle bottom (default 07 Nov 2022): date all phases are projected from; alternative 21 Nov 2022 documented in the tooltip
— Bull phase length (default 1064 days) / Bear phase length (default 364 days): ≈ averages of the 3 completed cycles
— Cycles to draw back (default 3) / forward (default 1): how many turn lines and labels are drawn
— Show 2nd projected cycle (default off): one extra bottom/top pair with doubled uncertainty
🎨 Visual Settings:
— Theme (Auto / Dark / Light): Auto detects from the chart background; all text colors adapt
— Phase background , Cycle turn lines , Turn labels , Watermark : independent toggles with color inputs
📊 Dashboard:
— Position (4 corners), font size (Small–Huge; dividers render one step smaller), and per-section switches: Cycle / Projection / Corrections / Ranges
📈 Hyperbola — Lows:
— 3 main cycle lows (2015 / 2018 / 2022, on by default) + 3 optional early-history lows (2011 / 2013 / 2015) — each is a checkbox + date + price
— Dashed extension (default 10 years), curve color, anchor-point markers
📉 Hyperbola — Highs:
— 4 cycle highs (2013 / 2017 / 2021 / 2025, on by default) + a spare projected slot (off), extension (default 5 years), curve color
🔢 Fibonacci Grids:
— Bull grids (default on) / Bear grids (default off) with separate colors
— Levels (default "0, 0.236, 0.382, 0.5, 0.618, 0.786, 0.836, 0.886, 1"; values > 1 = extensions)
— Highlight 0.786–0.836 zone (default on), Log-scale levels (default off), Reverse (default on), level labels
⛏ Halvings: lines + labels toggles, color
🟡 Sell Zones: toggle, color, Zone size % from high (default 5%)
🔮 Price Projection: toggle, Path shape (Replay last bull / Log-linear), color
🔔 Alerts: master switch, Webhook JSON Format (default off), Pre-alert days (default 30)
🔔 ALERTS
— 🟢 CYCLE FLIP → BULL — model bottom date reached; payload: ticker, timeframe, price, next projected top date
— 🔴 CYCLE FLIP → BEAR — model top date reached; payload: ticker, timeframe, price, next projected bottom date
— ⏳ CYCLE TURN APPROACHING — fires once, N days (default 30) before the next projected turn; payload: turn type (TOP/BOTTOM), days left, date
All alerts fire on confirmed bars only (once per bar close) and support both human-readable text and JSON webhook payloads for bot integration. Create a single alert with condition "Any alert() function call".
⚠️ IMPORTANT NOTES
— 🚫 No repainting. The cycle phase is pure calendar-time math against a fixed anchor; the curves are fitted once from user-defined historical pivots; the reference bull shape is recorded from confirmed bars only; all alerts use bar-close frequency. Nothing in the model reads unconfirmed real-time data, so no line, zone or label moves after the fact.
— 📐 Sample size: 3 completed cycles. Every statistical claim in this model rests on three observations. The hyperbolic fits are geometry/regression over 3–6 points. Treat all projected dates and prices as reference scenarios with wide error bars — the dashboard says "Rhythm ≠ law" for a reason.
— 📏 Calibrated chart: INDEX:BTCUSD, Weekly, regular (linear) price scale. Exchange charts start later and distort early-history fits. Keep the fib "Log-scale levels" input OFF on a linear chart. The dashboard's ✓ confirms symbol and timeframe; the scale must be checked manually.
— ⚖️ Scope: this is a macro-cycle framework for Bitcoin. It produces no intraday entry signals, no stop placement, and no position sizing. The projected path is explicitly hypothetical.
— 🛠️ This is a cycle-analysis and scenario-visualization tool, not an automated trading bot. It provides projected turn dates, curve-based price references, and accumulation/distribution zones — trade decisions remain yours.
— 🌐 The script runs on any symbol and timeframe, but the model is designed for Bitcoin on Daily/Weekly charts — a dashboard warning appears on intraday timeframes.
Bitcoin Almanac · v1.5.2 Wskaźnik