
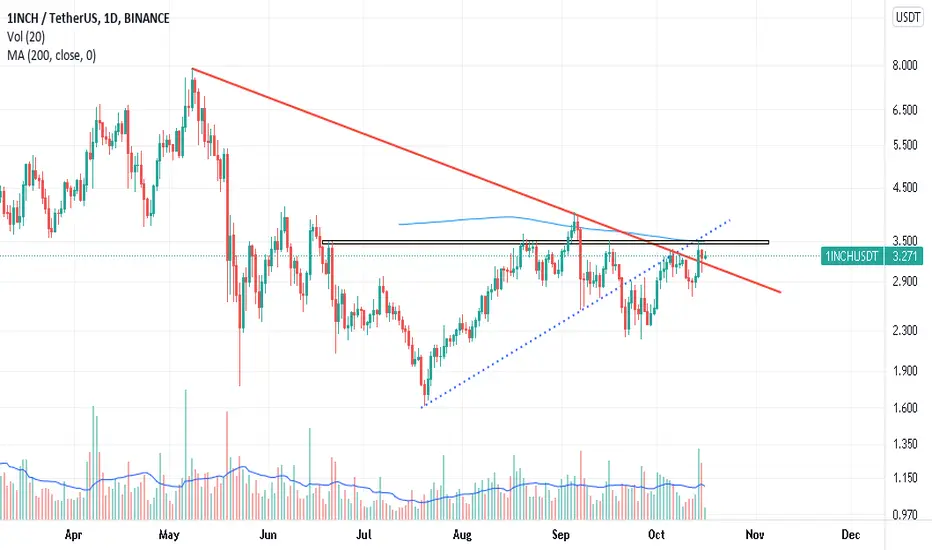
As you can see, according to the chart above, this digital currency after breaking its long-term dynamic resistance (red line), to the intersection of short-term dynamic resistance (blue dashed line that can be seen in the chart) and static resistance (orange area) and It also hit its $ 200 moving average resistance at $ 3.5 and failed to break it.
The recent short-term correction of this currency can be considered as a kind of pullback to the broken resistance and the absorption of momentum necessary to overcome the hard resistance of $ 3.5. A good entry point for the resistance is $ 3.5 and its high stabilization.
The recent short-term correction of this currency can be considered as a kind of pullback to the broken resistance and the absorption of momentum necessary to overcome the hard resistance of $ 3.5. A good entry point for the resistance is $ 3.5 and its high stabilization.

Отказ от ответственности
Информация и публикации не предназначены для предоставления и не являются финансовыми, инвестиционными, торговыми или другими видами советов или рекомендаций, предоставленных или одобренных TradingView. Подробнее читайте в Условиях использования.
Отказ от ответственности
Информация и публикации не предназначены для предоставления и не являются финансовыми, инвестиционными, торговыми или другими видами советов или рекомендаций, предоставленных или одобренных TradingView. Подробнее читайте в Условиях использования.