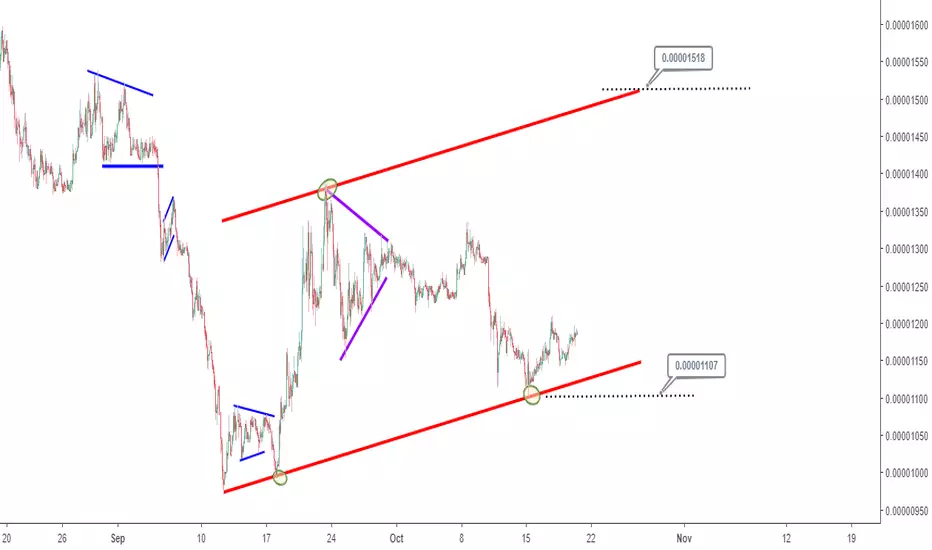
The 2 hour timeframe of Cardano (ADABTC) is shown in this analysis from August 19, 2018 till current date. The most recent chart pattern that captures price action of Cardano from September 12, 2018 onwards is a bullish price channel.
~0.00001518 and 0.00001107 are marked as price levels to pay attention to as a breakout above the former indicates resumption of upside momentum with the channel width serving as a guide to estimate the minimum expectation for a bullish price swing.
A breakout below the latter however implies a continuation of the already established downtrend in Cardano.
~0.00001518 and 0.00001107 are marked as price levels to pay attention to as a breakout above the former indicates resumption of upside momentum with the channel width serving as a guide to estimate the minimum expectation for a bullish price swing.
A breakout below the latter however implies a continuation of the already established downtrend in Cardano.

Похожие публикации
Отказ от ответственности
Информация и публикации не предназначены для предоставления и не являются финансовыми, инвестиционными, торговыми или другими видами советов или рекомендаций, предоставленных или одобренных TradingView. Подробнее читайте в Условиях использования.
Похожие публикации
Отказ от ответственности
Информация и публикации не предназначены для предоставления и не являются финансовыми, инвестиционными, торговыми или другими видами советов или рекомендаций, предоставленных или одобренных TradingView. Подробнее читайте в Условиях использования.