
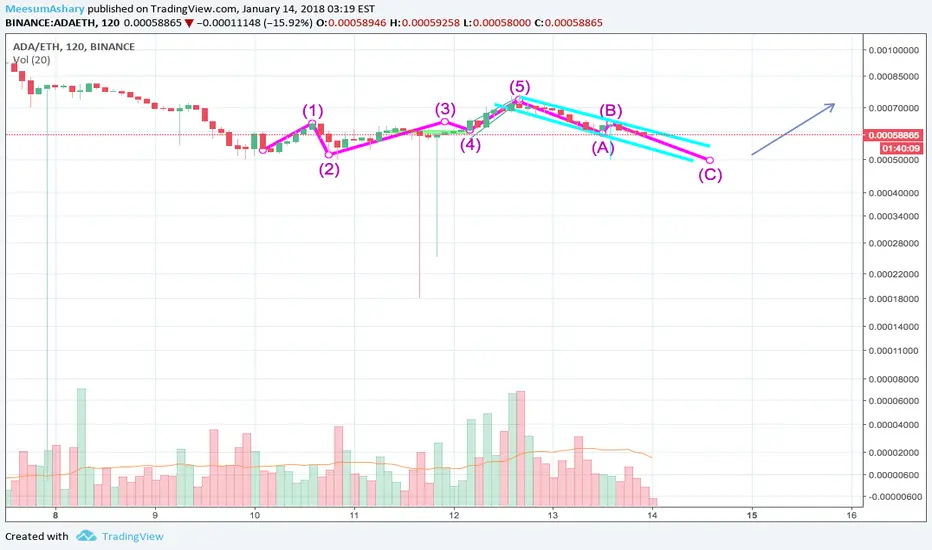
The Elliot Wave pattern shows that, after the ABC correction (Pink), prices will rise again for a while following a 1,2,3,4,5 Elliot wave.
The possible bullish trend is also confirmed by the flag pattern (Teal) seen around the ABC correction. We know that the flag pattern is a continuous pattern. This indicates that after the graph breaks out of the flag, it will resume its previous pattern. Which in this case, was a bullish trend.
Feel free to critique this analysis, as I am still fairly new to this.
The possible bullish trend is also confirmed by the flag pattern (Teal) seen around the ABC correction. We know that the flag pattern is a continuous pattern. This indicates that after the graph breaks out of the flag, it will resume its previous pattern. Which in this case, was a bullish trend.
Feel free to critique this analysis, as I am still fairly new to this.

Отказ от ответственности
Информация и публикации не предназначены для предоставления и не являются финансовыми, инвестиционными, торговыми или другими видами советов или рекомендаций, предоставленных или одобренных TradingView. Подробнее читайте в Условиях использования.
Отказ от ответственности
Информация и публикации не предназначены для предоставления и не являются финансовыми, инвестиционными, торговыми или другими видами советов или рекомендаций, предоставленных или одобренных TradingView. Подробнее читайте в Условиях использования.