
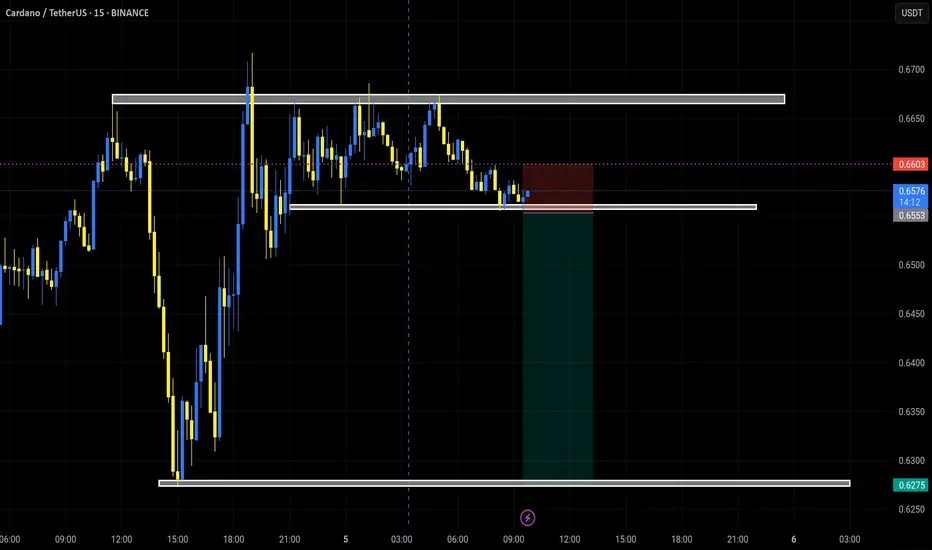
ADA/USDT – Price Action Analysis
On the 1-hour timeframe, price has been following a clear downtrend, respecting a descending channel structure. After reaching the lower boundary, sellers lost some momentum, and price started to form a rising wedge, typically seen as a bearish continuation pattern in such contexts.
Currently, price is testing a key confluence zone:
The upper boundary of the wedge
The descending trendline resistance
And also sitting below the dynamic resistance of the 200 EMA.
From a price action perspective:
Bullish candles are showing limited strength and upper wicks indicate selling pressure.
A confirmed breakdown below the wedge support could lead to further downside towards the previous demand area around 0.6550 - 0.6340.
On the 1-hour timeframe, price has been following a clear downtrend, respecting a descending channel structure. After reaching the lower boundary, sellers lost some momentum, and price started to form a rising wedge, typically seen as a bearish continuation pattern in such contexts.
Currently, price is testing a key confluence zone:
The upper boundary of the wedge
The descending trendline resistance
And also sitting below the dynamic resistance of the 200 EMA.
From a price action perspective:
Bullish candles are showing limited strength and upper wicks indicate selling pressure.
A confirmed breakdown below the wedge support could lead to further downside towards the previous demand area around 0.6550 - 0.6340.

Отказ от ответственности
Информация и публикации не предназначены для предоставления и не являются финансовыми, инвестиционными, торговыми или другими видами советов или рекомендаций, предоставленных или одобренных TradingView. Подробнее читайте в Условиях использования.
Отказ от ответственности
Информация и публикации не предназначены для предоставления и не являются финансовыми, инвестиционными, торговыми или другими видами советов или рекомендаций, предоставленных или одобренных TradingView. Подробнее читайте в Условиях использования.