Длинная
Solidus Ai Tech (AITECH)
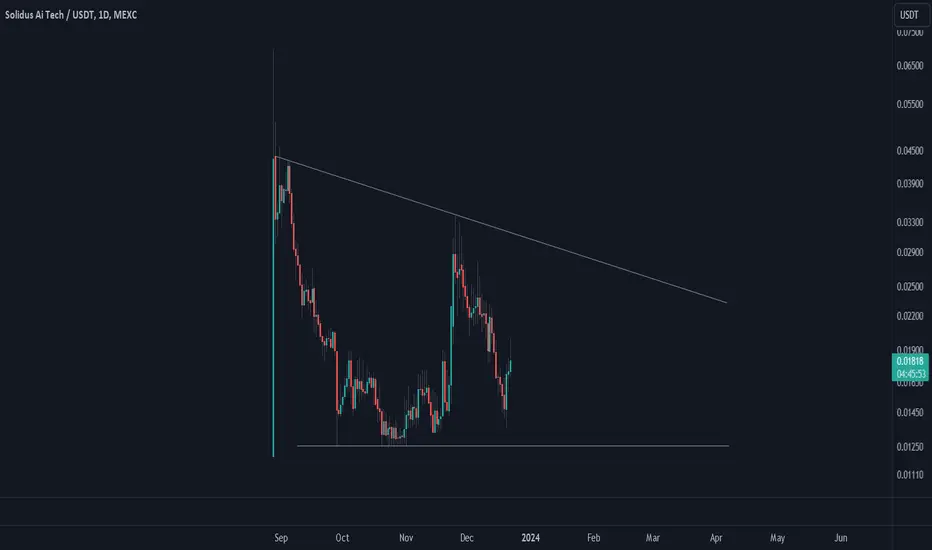
AITECH is a deflationary artificial intelligence token for the Solidus, which is a state-of-the-art High-Performance Computing (HPC) Data Centre spanning over 8,000 square feet. AITECH token will serve as a payment gateway for licensing Artificial Intelligence as a Service, Blockchain as a Service, and accessing HPC resources via their Infrastructure as a Service platform. Anyway, the project is still young but seems to have potential. Anyway, technical wise, it seems AITECH is oscillating in a somewhat wide descending triangle pattern. Let's see if AITECH can reach the upper line and break it.
Заметка
AITECH broke the minor downtrend line and is going up strongly. If AITECH break the wide descending triangle upward, it can go up equal to the triangle's width. Let's see what happens.
Заметка
So, AITECH broke the wide descending triangle upward and went up. There can be two possible targets; 1) AITECH can go up equal to the triangle's smallest width, which reached already. 2) AITECH can go up equal to the triangle's biggest width, which is the second yellow ellipse. Most probably, it is going to be between these two areas. Let's see what happens.
Заметка
AITECH broke the minor horizontal resistance area and is going toward the second target.
Заметка
So, AITECH is reaching the second target.
Заметка
So, AITECH reached the second target. It seems AITECH is moving in an ascending channel, or one might say a pitchfork. If any significant correction happens, channel's middle line and the bottom line are two possible ending levels. Let's see what happens.
Заметка
So, AITECH tried to break the 0.786 Fib level for the second time, but couldn't; maybe because of lack of momentum. There are two possible support line for AITECH's correction: channel's middle line and the bottom line. It is most probable that AITECH try to break the ATH one more time, if unsuccessful, could head down toward the channel's bottom line. Let's see what happens.
Заметка
So, after AITECH oscillated for a while under the 0.786 Fib level, then AITECH broke this level and went up. It seems that AITECH aiming for higher targets. Let's see how high it can go.
Заметка
So, AITECH went up a little further, and then a correction brought down the price to the channel's lower line. For re-entry, one has to wait for AITECH to reach either the first horizontal support area, which is aligned with the 0.382 Fib retracement level, or the next level. Let's see what happens.
Заметка
So, AITECH's correction came down to the desired area; the blue box. Also, AITECH broke the minor downtrend line too, so get ready for the next wave. Let's see what happens.
Заметка
So, AITECH's correction continued, and the price went down further. The next possible area for correction to end is the area between 0.5 and 0.618 Fib retracement levels. As Bitcoin and altcoins are still not ready to move upward, so is the AITECH, which needs a little more correction or oscillation to fill the required correction's time cycle. Anyway, there is a major downtrend line that AITECH has to break first, and then upward continuation is possible. Let's see what happens.
Сделка активна
So, AITECH went down to the area between 0.5 and 0.618 Fib retracement levels, and it seems correction ended there. Let's see when the next upward wave kicks in.
Заметка
VIP Telegram channel: t.me/saeedcrypto_publicЗаметка
AITECH could produce one of the biggest rises in the current crypto market cycle. Let's see what happens.
Заметка
So, it seems AITECH is moving in an inverted wedge pattern. Let's see if the bottom of the wedge play as a support.
Заметка
The wedge's bottom couldn't hold the price, so AITECH went down. The correction unfolded in a classic A-B-C pattern, in which wave C extended to Fib level 1. Then AITECH broke the downtrend line and went up sharply. At least another higher high and a lower high are needed for reversal confirmation.

Отказ от ответственности
Информация и публикации не предназначены для предоставления и не являются финансовыми, инвестиционными, торговыми или другими видами советов или рекомендаций, предоставленных или одобренных TradingView. Подробнее читайте в Условиях использования.
Отказ от ответственности
Информация и публикации не предназначены для предоставления и не являются финансовыми, инвестиционными, торговыми или другими видами советов или рекомендаций, предоставленных или одобренных TradingView. Подробнее читайте в Условиях использования.