
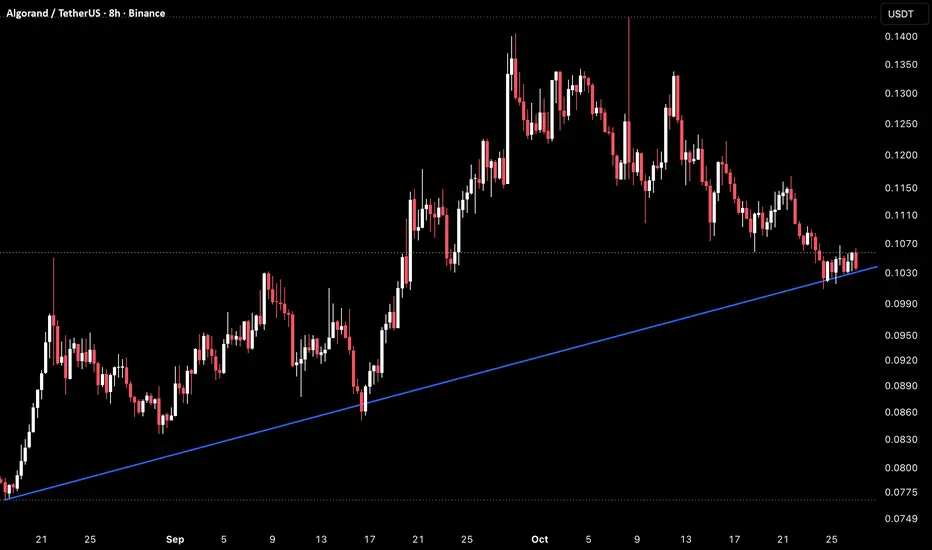
Algorand is trading around 0.1036 on the 8H timeframe after a steady decline from the late September high near 0.1400, now sitting directly on the ascending trendline that has supported this advance since the August 17 low near 0.0765.
The structure here began with a strong rally off that low, with the rising trendline holding through the early pullbacks. ALGO built a range between roughly 0.0830 and 0.0990 through early September, and the September 17 dip to 0.0855 bounced cleanly off the trendline before launching the breakout leg through 0.1070 and up to the high near 0.1400. Since then, price has printed a series of lower highs near 0.1335 on October 12 and 0.1165 on October 20, with the decline bringing ALGO back to the trendline and the horizontal level near 0.1070 that previously acted as resistance.
Price is currently consolidating at 0.1036 after the October 24 wick tagged the trendline and reversed, with candles tightening as support and resistance converge.
Key Levels To Watch:
→ 0.1400 September 29 high, breakout extension top
→ 0.1335 October 12 lower high, major resistance
→ 0.1165 October 20 lower high, first major level to reclaim
→ 0.1070 Horizontal level, key resistance to flip
→ 0.1036 Current price, sitting on trendline support
→ 0.0990 Prior consolidation, first support if the trendline fails
→ 0.0855 September 17 low, trendline bounce
→ 0.0765 Trendline origin, August 17 low
A bounce from the trendline and a reclaim of 0.1070 would keep the structure intact and set up a test of 0.1165, with a break above it opening the path toward 0.1335 and the 0.1400 September high.
Losing the trendline and the 0.0990 level would be the first real break of structure since mid August, exposing 0.0855 as the next support with the 0.0765 origin as the deeper level if the selloff extends.
Hold the trendline and ALGO builds toward another push at the highs. Lose 0.0990 and this pullback extends toward lower support.
Bias stays neutral to cautiously bullish given the trendline is still holding, but the series of lower highs means 0.1165 needs to be reclaimed to confirm the next leg higher.
The structure here began with a strong rally off that low, with the rising trendline holding through the early pullbacks. ALGO built a range between roughly 0.0830 and 0.0990 through early September, and the September 17 dip to 0.0855 bounced cleanly off the trendline before launching the breakout leg through 0.1070 and up to the high near 0.1400. Since then, price has printed a series of lower highs near 0.1335 on October 12 and 0.1165 on October 20, with the decline bringing ALGO back to the trendline and the horizontal level near 0.1070 that previously acted as resistance.
Price is currently consolidating at 0.1036 after the October 24 wick tagged the trendline and reversed, with candles tightening as support and resistance converge.
Key Levels To Watch:
→ 0.1400 September 29 high, breakout extension top
→ 0.1335 October 12 lower high, major resistance
→ 0.1165 October 20 lower high, first major level to reclaim
→ 0.1070 Horizontal level, key resistance to flip
→ 0.1036 Current price, sitting on trendline support
→ 0.0990 Prior consolidation, first support if the trendline fails
→ 0.0855 September 17 low, trendline bounce
→ 0.0765 Trendline origin, August 17 low
A bounce from the trendline and a reclaim of 0.1070 would keep the structure intact and set up a test of 0.1165, with a break above it opening the path toward 0.1335 and the 0.1400 September high.
Losing the trendline and the 0.0990 level would be the first real break of structure since mid August, exposing 0.0855 as the next support with the 0.0765 origin as the deeper level if the selloff extends.
Hold the trendline and ALGO builds toward another push at the highs. Lose 0.0990 and this pullback extends toward lower support.
Bias stays neutral to cautiously bullish given the trendline is still holding, but the series of lower highs means 0.1165 needs to be reclaimed to confirm the next leg higher.

Отказ от ответственности
Информация и публикации не предназначены для предоставления и не являются финансовыми, инвестиционными, торговыми или другими видами советов или рекомендаций, предоставленных или одобренных TradingView. Подробнее читайте в Условиях использования.
Отказ от ответственности
Информация и публикации не предназначены для предоставления и не являются финансовыми, инвестиционными, торговыми или другими видами советов или рекомендаций, предоставленных или одобренных TradingView. Подробнее читайте в Условиях использования.