
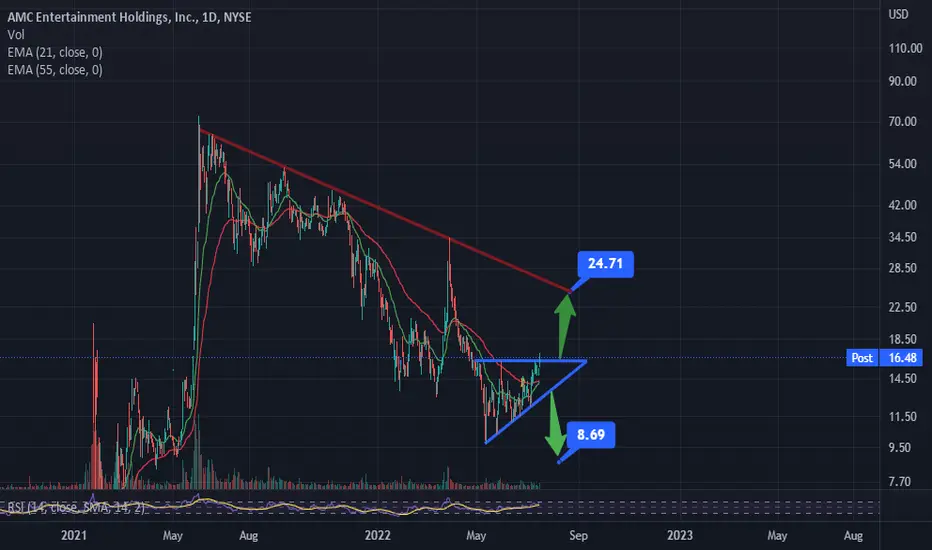
AMC has broken out of an ascending triangle pattern with a technical target to $24.71
Coincidently $24.71 is the line of resistance the price has been stuck under since it put in it’s all time high.
The crossover of the 21 and 55 ema on the daily timeframe is a very bullish statement for AMC. Furthermore, holding the 21 ema on a retrace will put the stock in a prime position for more upside action.
I would expect to see a retrace to $16 to test support of the breakout structure but we all know how violently it can move so don’t bank on a back test.
Not financial advice and just sharing an idea. Trade with caution and stop losses. Never trade with money you can’t afford to lose.
Good luck everyone
Coincidently $24.71 is the line of resistance the price has been stuck under since it put in it’s all time high.
The crossover of the 21 and 55 ema on the daily timeframe is a very bullish statement for AMC. Furthermore, holding the 21 ema on a retrace will put the stock in a prime position for more upside action.
I would expect to see a retrace to $16 to test support of the breakout structure but we all know how violently it can move so don’t bank on a back test.
Not financial advice and just sharing an idea. Trade with caution and stop losses. Never trade with money you can’t afford to lose.
Good luck everyone

Отказ от ответственности
Информация и публикации не предназначены для предоставления и не являются финансовыми, инвестиционными, торговыми или другими видами советов или рекомендаций, предоставленных или одобренных TradingView. Подробнее читайте в Условиях использования.
Отказ от ответственности
Информация и публикации не предназначены для предоставления и не являются финансовыми, инвестиционными, торговыми или другими видами советов или рекомендаций, предоставленных или одобренных TradingView. Подробнее читайте в Условиях использования.