
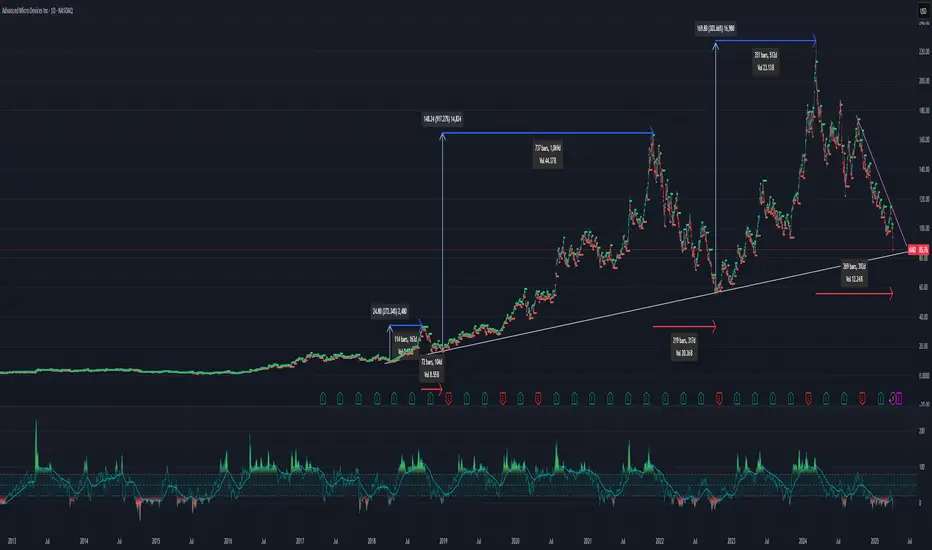
3 Positions in AMD from 2018-2025
Duration of trades: 106 - 1,064 days
Gains: +217% - +917%
Closing in on the trend line, look for a bounce at the line or likely if it goes under, wait for a rally back above the line. This chart is set at the daily timeframe. If you trade on the minor volatility within the major trend, I've found the 2 hour timeframe using a combination of indicators, Relative Trend Index and HH and LL, net favorable results.
Duration of trades: 106 - 1,064 days
Gains: +217% - +917%
Closing in on the trend line, look for a bounce at the line or likely if it goes under, wait for a rally back above the line. This chart is set at the daily timeframe. If you trade on the minor volatility within the major trend, I've found the 2 hour timeframe using a combination of indicators, Relative Trend Index and HH and LL, net favorable results.

Отказ от ответственности
Информация и публикации не предназначены для предоставления и не являются финансовыми, инвестиционными, торговыми или другими видами советов или рекомендаций, предоставленных или одобренных TradingView. Подробнее читайте в Условиях использования.
Отказ от ответственности
Информация и публикации не предназначены для предоставления и не являются финансовыми, инвестиционными, торговыми или другими видами советов или рекомендаций, предоставленных или одобренных TradingView. Подробнее читайте в Условиях использования.