Длинная
Ankr
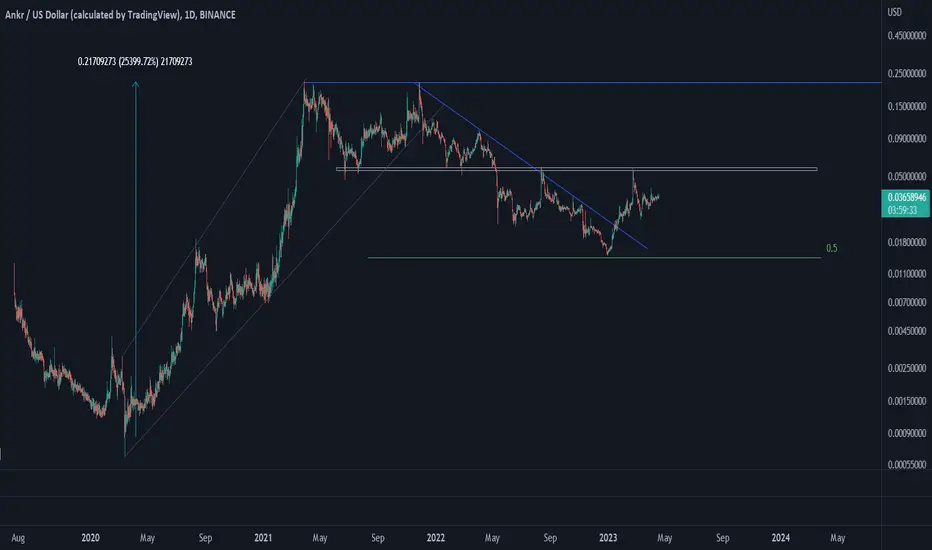
Ankr technical analysis is straightforward; almost. An impulse upward wave is followed by a corrective downward wave. After the corrective wave finished at Fibonacci retracement of 0.5, the price broke the downtrend line and it seems the next impulse wave has started. It is worth mentioning that Ankr has partnered with Microsoft, so there is a bright future for this coin. Let's see what happens.
Заметка
It seems a Head and Shoulders pattern is forming in Ankr chart. Let's see what happens.
Заметка
So, Ankr reached the major horizontal resistance area on which Ankr bounced off several times. If Ankr wants to go higher, first have to break this area. Let's see what happens.
Заметка
So, Ankr finally broke the major horizontal resistance area. Ankr probably goes up a little and then make pullback on this area; then after pullback finished, Ankr will head toward ATH. Let's see what happens.
Заметка
So, Ankr really tried to break the major horizontal resistance area, but couldn't and instead made a false breakout. Then the correction started, and Ankr went down to gain momentum. Now, it seems the correction is over since Ankr broke the downtrend line and is going up. Let's see what happens.
Сделка активна
So, after ANKR broke the downtrend line, went up toward the major horizontal resistance area and the channel's upper line. Let's see if ANKr can break through these.
Заметка
So, ANKR reached the major horizontal resistance area, again. Let's see if this time ANKR can break this are.

Отказ от ответственности
Информация и публикации не предназначены для предоставления и не являются финансовыми, инвестиционными, торговыми или другими видами советов или рекомендаций, предоставленных или одобренных TradingView. Подробнее читайте в Условиях использования.
Отказ от ответственности
Информация и публикации не предназначены для предоставления и не являются финансовыми, инвестиционными, торговыми или другими видами советов или рекомендаций, предоставленных или одобренных TradingView. Подробнее читайте в Условиях использования.