
First of all, pay attention to the timeframe | it’s a higher timeframe and takes longer.
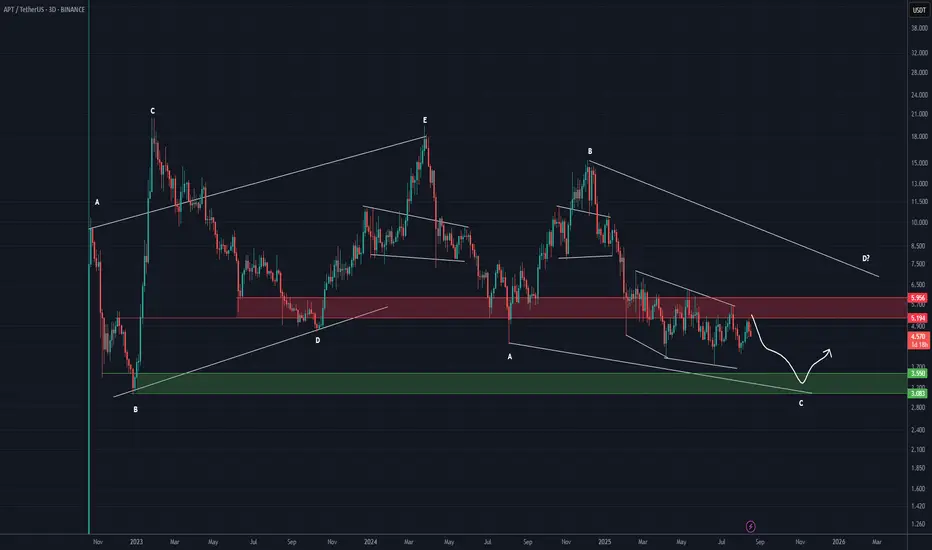
It seems that the price is in wave C of a bearish pattern. The price is trading below the supply zone, and in order to break this area, buy orders need to be accumulated.
It is expected that the price will move toward the green zone, where wave C may complete, and then we could see some recoveries from the price within the green zone.
For risk management, please don't forget stop loss and capital management
Comment if you have any questions
Thank You
It seems that the price is in wave C of a bearish pattern. The price is trading below the supply zone, and in order to break this area, buy orders need to be accumulated.
It is expected that the price will move toward the green zone, where wave C may complete, and then we could see some recoveries from the price within the green zone.
For risk management, please don't forget stop loss and capital management
Comment if you have any questions
Thank You

🔥 Don't Just Watch the Market. Understand It!
📊 Crypto Analysis & Setups:
👉 t.me/Behdark_EN
💹 Forex Analysis & Setups:
👉 t.me/FX_Behdark
🚀 Join BehDark for Market Insights, Trading Setups & Key Levels. Choose Your Market & Join Us!
📊 Crypto Analysis & Setups:
👉 t.me/Behdark_EN
💹 Forex Analysis & Setups:
👉 t.me/FX_Behdark
🚀 Join BehDark for Market Insights, Trading Setups & Key Levels. Choose Your Market & Join Us!
Отказ от ответственности
Информация и публикации не предназначены для предоставления и не являются финансовыми, инвестиционными, торговыми или другими видами советов или рекомендаций, предоставленных или одобренных TradingView. Подробнее читайте в Условиях использования.
🔥 Don't Just Watch the Market. Understand It!
📊 Crypto Analysis & Setups:
👉 t.me/Behdark_EN
💹 Forex Analysis & Setups:
👉 t.me/FX_Behdark
🚀 Join BehDark for Market Insights, Trading Setups & Key Levels. Choose Your Market & Join Us!
📊 Crypto Analysis & Setups:
👉 t.me/Behdark_EN
💹 Forex Analysis & Setups:
👉 t.me/FX_Behdark
🚀 Join BehDark for Market Insights, Trading Setups & Key Levels. Choose Your Market & Join Us!
Отказ от ответственности
Информация и публикации не предназначены для предоставления и не являются финансовыми, инвестиционными, торговыми или другими видами советов или рекомендаций, предоставленных или одобренных TradingView. Подробнее читайте в Условиях использования.