
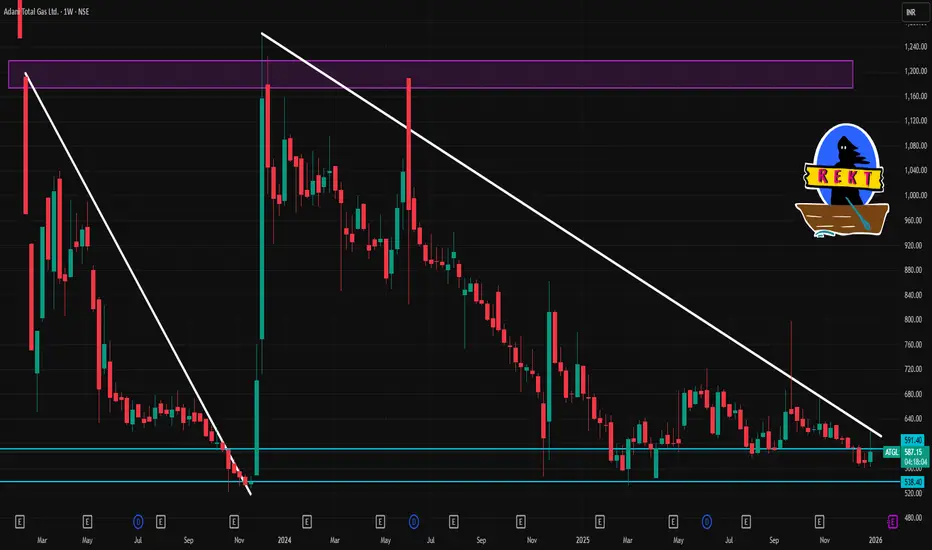
📊 Latest Price (approx): ~₹590–₹595 on NSE (price fluctuates within the day) — current levels seen near this range.
📈 Weekly Support & Resistance Levels (pivot‑based)
These are weekly pivot‑derived levels that traders often use to gauge likely support and resistance zones for the week ahead:
🔹 Weekly Resistance Levels
R1: ~₹622
R2: ~₹637
R3: ~₹657
🔸 Weekly Pivot (mid zone): ~₹602
🛡️ Weekly Support Levels
S1: ~₹587
S2: ~₹567
S3: ~₹552
These weekly pivots are from standard pivot point calculations and give you the broad weekly range to watch.
📍 Key Round Levels to Watch (Weekly)
Resistance zones:
~₹620–₹630: short‑term overhead supply/resistance.
~₹650+: higher resistance if the market turns bullish later in the week.
Support zones:
~₹580: immediate support around current price band (often reacts intraday).
~₹560–₹570: stronger weekly support — key level if price weakens.
~₹550: deeper support on weekly frame.
📌 Weekly Strategy Levels
👉 Bullish scenario: A sustained close above ₹620 for the week could open up moves toward ₹637–₹657.
👉 Bearish scenario: If the stock breaks below ₹587 on a weekly close, watch support ₹567, then ₹552.
📈 Weekly Support & Resistance Levels (pivot‑based)
These are weekly pivot‑derived levels that traders often use to gauge likely support and resistance zones for the week ahead:
🔹 Weekly Resistance Levels
R1: ~₹622
R2: ~₹637
R3: ~₹657
🔸 Weekly Pivot (mid zone): ~₹602
🛡️ Weekly Support Levels
S1: ~₹587
S2: ~₹567
S3: ~₹552
These weekly pivots are from standard pivot point calculations and give you the broad weekly range to watch.
📍 Key Round Levels to Watch (Weekly)
Resistance zones:
~₹620–₹630: short‑term overhead supply/resistance.
~₹650+: higher resistance if the market turns bullish later in the week.
Support zones:
~₹580: immediate support around current price band (often reacts intraday).
~₹560–₹570: stronger weekly support — key level if price weakens.
~₹550: deeper support on weekly frame.
📌 Weekly Strategy Levels
👉 Bullish scenario: A sustained close above ₹620 for the week could open up moves toward ₹637–₹657.
👉 Bearish scenario: If the stock breaks below ₹587 on a weekly close, watch support ₹567, then ₹552.

Contact Knowledgehub for a detailed consultation: Dm on WhatsApp: [wa.link/a2o0kz]-
Phone No: [+91 93102 26243]-
Email: [tradingviewknowledgehub@gmail.com]---
-- Let’s achieve success together!
Phone No: [+91 93102 26243]-
Email: [tradingviewknowledgehub@gmail.com]---
-- Let’s achieve success together!
Похожие публикации
Отказ от ответственности
Информация и публикации не предназначены для предоставления и не являются финансовыми, инвестиционными, торговыми или другими видами советов или рекомендаций, предоставленных или одобренных TradingView. Подробнее читайте в Условиях использования.
Contact Knowledgehub for a detailed consultation: Dm on WhatsApp: [wa.link/a2o0kz]-
Phone No: [+91 93102 26243]-
Email: [tradingviewknowledgehub@gmail.com]---
-- Let’s achieve success together!
Phone No: [+91 93102 26243]-
Email: [tradingviewknowledgehub@gmail.com]---
-- Let’s achieve success together!
Похожие публикации
Отказ от ответственности
Информация и публикации не предназначены для предоставления и не являются финансовыми, инвестиционными, торговыми или другими видами советов или рекомендаций, предоставленных или одобренных TradingView. Подробнее читайте в Условиях использования.